It Looks Like The Next Major Stock Market Top Will Arrive In October 2017


We believe markets are lining up for a major top later in 2017, possibly in the August to October time period. There are several patterns we are watching that lead us to this conclusion. First let’s take a look at our first chart, a Rising Bearish Wedge termination top pattern.

The Rising Bearish Wedge since August 2015 is finishing a multi-decade Jaws of Death pattern, and a multi-century Bull market. This five wave Rising Bearish Wedge (a-up, b-down, c-up, d-down, e-up) has likely finished the first three of the five subwaves, and the decline since March 1st, 2017 is wave d-down, with another downleg to complete d-down likely in the next month or so. Then, a final rally leg toward 22,500 in the Industrials should conclude the Bull market, perhaps around the August /October 2017 time period. This upside target is based upon the likelihood markets rise to a normal overthrow above the rising upper boundary trend-line shown above.
We should see considerable Bearish divergences occur as stocks climb in their final wave e-up, perhaps divergences between tech indices and Blue Chips, and most likely a divergence between the NYSE Cumulative Advance/Decline Line and Blue Chip stock averages.
This Rising Bearish Wedge is the final move for Wave (E ), which was the Bull market that started at the end of the Great Recession in March 2009.
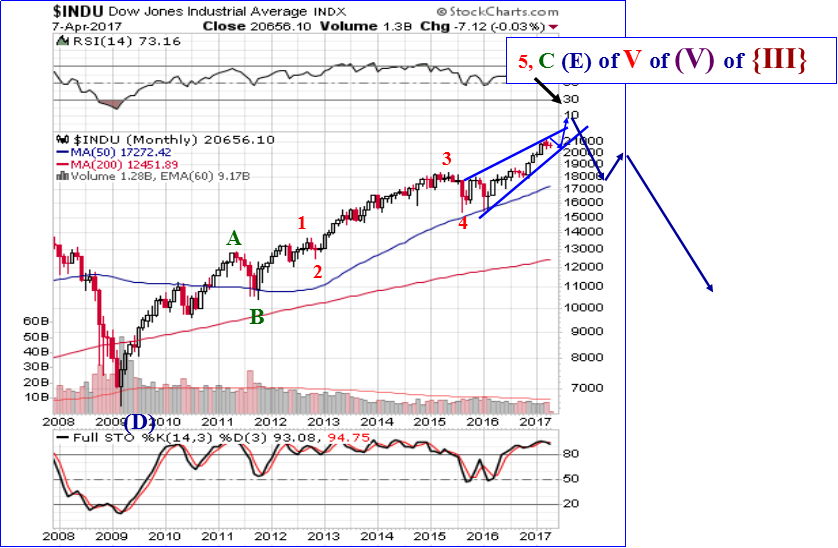
The March 1st top gives us two definitive touch points for the upper boundary of the Rising Bearish Wedge, to go with three definitive touch points already in place for the lower boundary.
Rising Wedges are patterns that see convergence over time between the upper and lower boundary lines, and are larger degree stock market trend termination patterns, often seen at tops.
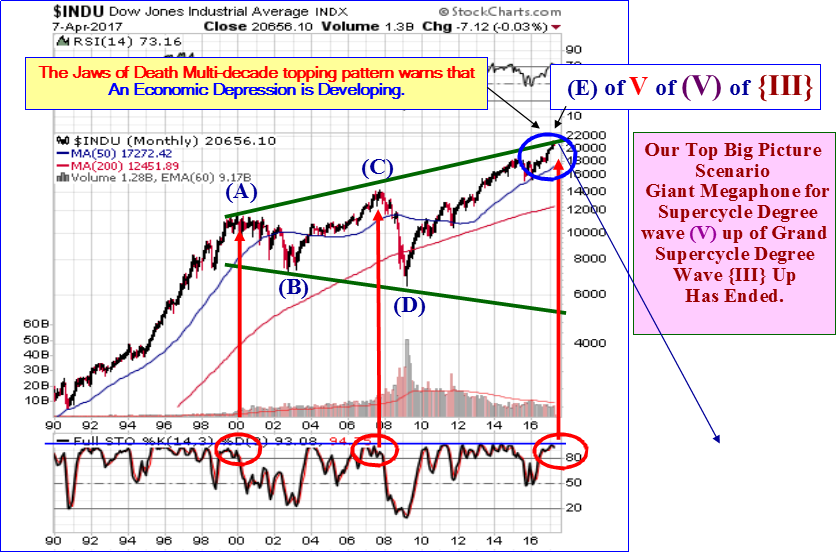
The big picture is shown above. The Bull market from 2009 is wave (E ), the final rally leg of a Megaphone or Broadening Top pattern, a.k.a. a Jaws of Death pattern. Wave E’s usually extend, tracking along the upward sloping upper boundary.
The Monthly Full Stochastics are overbought, supportive of a conclusion to this pattern at any time it chooses to finish. The past two major tops for this pattern, wave (A) and wave (C ) also occurred when the monthly Full Stochastics were overbought. An overbought level does not mean an important top is in, however an important top is not going to happen unless the FS is overbought.
What this pattern is warning is that a massive Bear market in stocks is in our near future, and given how mature wave (E ) appears to be, and how the monthly FS is overbought, we need to be ready for a conclusion to this pattern and a powerful downside resolution at any time. But when can we know the next great Bear market in stocks is starting?
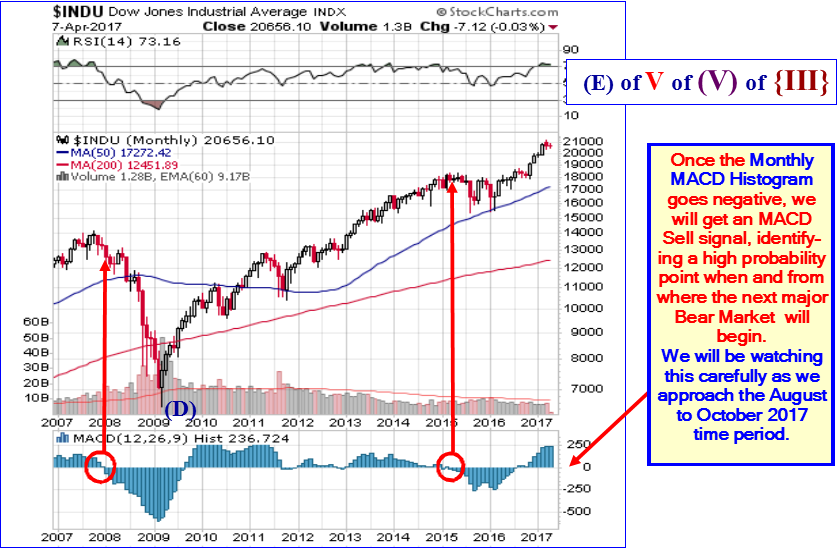
The above chart gives us an almost precise signal for when, and from what price level, the next great Bear Market in stocks will begin. The previous chart, the Megaphone Jaws of Death pattern, gave us the ballpark early warning.
This analysis gives us precise identification of the Bear Market’s start, to within a few months.
Here is how it works: When the Moving Average Convergence/Divergence histograms (a measure of the difference between the two speed moving averages) goes negative, it means a Bear market in stocks is starting, and because this is a Monthly chart, it measures severe Bear Markets. The previous two times we saw this were in late 2007 and again in early 2015. The 2007 Bear market lasted in stocks through March 2009. The 2015 Bear Market was not as severe, but did see a stock market decline over 15%.
The nice feature of this indicator is that it also gave an “all-clear” signal when it went positive, a stock market Buy signal.
While this measure does not “hit” the precise tops and bottoms, it signals pretty close to tops and bottoms, giving us confidence to get out before too much damage happens, or to get in before too much opportunity has passed.
Further, our three key stock market indicators, our Primary Trend Indicator, our intermediate-term Secondary Trend Indicator, and our short-term Purchasing Power Indicator give great guidance as to when new investable and tradable trends are beginning, both up and down.
********
At www.technicalindicatorindex.com we have developed proprietary key trend-finder indicators and also track and identify high probability starts and conclusions of trends for our subscribers. Any trading program is only as good as the entry and exit indicators used.
Get a FREE 30 Day Trial Subscription to receive our Daily and Weekend U.S. and International Market Forecast Reports at www.technicalindicatorindex.com Simply click on the button at the upper right of the home page. We cover stock markets and Gold daily and have Buy / Sell signals. We also offer a Platinum Trading service. Email us at [email protected] for information on that program.
When did Noah build the ark? Before it rained. Well, it is starting to rain. We believe it is now time to make sure our arks are built and can float. We can help you at www.technicalindicatorindex.com with our daily and weekend market updates, or conservative portfolio model, and Platinum educational Trading program.
Do not be satisfied hearing what the market did; learn how to predict what the market is going to do. Join us at www.technicalindicatorindex.com as we study the language of the markets. Markets tell where they are headed. Technical Analysis is the science where we learn and apply the forecasting language of the markets.
Dr. McHugh’s book, “The Coming Economic Ice Age, Five Steps to Survive and Prosper,” is available at amazon.com at http://tinyurl.com/lypv47v
Robert McHugh Ph.D. is President and CEO of Main Line Investors, Inc., a registered investment advisor in the Commonwealth of Pennsylvania, and can be reached at www.technicalindicatorindex.com. The statements, opinions, buy and sell signals, and analyses presented in this newsletter are provided as a general information and education service only. Opinions, estimates, buy and sell signals, and probabilities expressed herein constitute the judgment of the author as of the date indicated and are subject to change without notice. Nothing contained in this newsletter is intended to be, nor shall it be construed as, investment advice, nor is it to be relied upon in making any investment or other decision. Prior to making any investment decision, you are advised to consult with your broker, investment advisor or other appropriate tax or financial professional to determine the suitability of any investment. Neither Main Line Investors, Inc. nor Robert D. McHugh, Jr., Ph.D. Editor shall be responsible or have any liability for investment decisions based upon, or the results obtained from, the information provided. Copyright 2017, Main Line Investors, Inc. All Rights Reserved.


