Junk Bond Market Imminent Collapse Threatens (Unwelcomed Big Rate Rises)


Everyone is so focused on looking at the Fed and whether or not it decides to raise rates by a puny 0.25%, that they are completely overlooking the fact it is the market’s role to set interest rates…and if the Fed is not up to the job, then the markets will eventually take over and do it in a manner that is likely to involve increases vastly greater than a mere 0.25%, which given the current fragile and extremely unstable debt structure, can be expected to have catastrophic consequences.
The chart for Junk Bonds looks terrible - and it is already right at the point of breaking down from a big top pattern. This frightening development doesn't seem to have been noticed by many people, but it portends rising yields first on low quality debt that will lead rapidly to a severe credit crunch that will work its way back towards supposedly higher quality bonds and Treasuries, causing a bond market crash and rising rates at the worst possible time when the world economy is in the throes of a deflationary implosion.
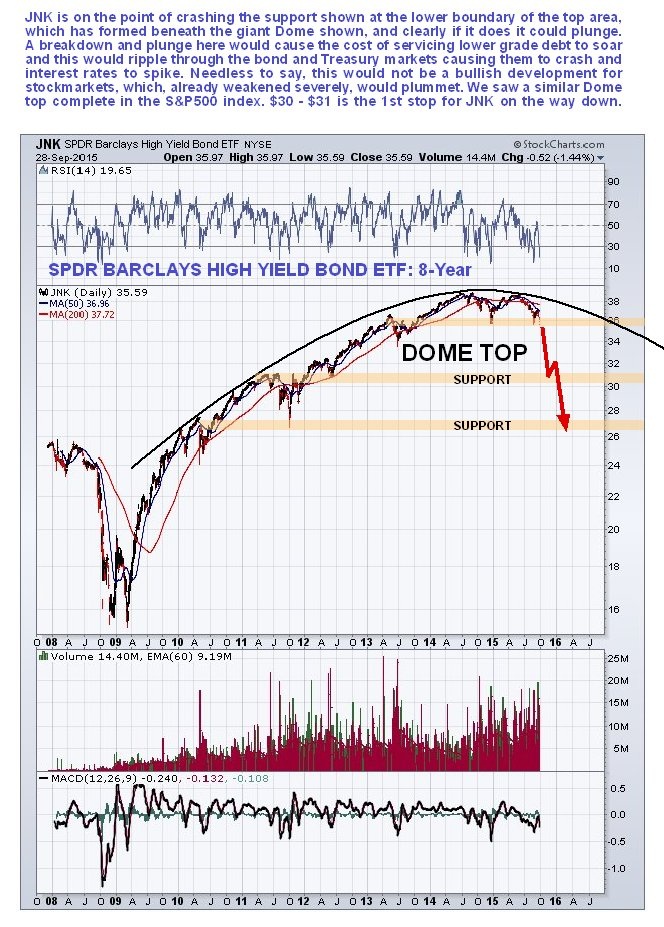
Let's now look at the long-term 8-year chart for the imperiously named SPDR Barclays High Yield Bond ETF, or in other words "The Junk Bond ETF". On this chart we can see how, after rounding over beneath a big Dome Top, JNK is on the point of breaking down beneath key support at the lower boundary of the top pattern, which can be expected to lead to a plunge. On this chart, the drop of recent days doesn't look at all dramatic, and furthermore we can see that it potentially has much further to fall - it could easily plummet back into the low $20's.
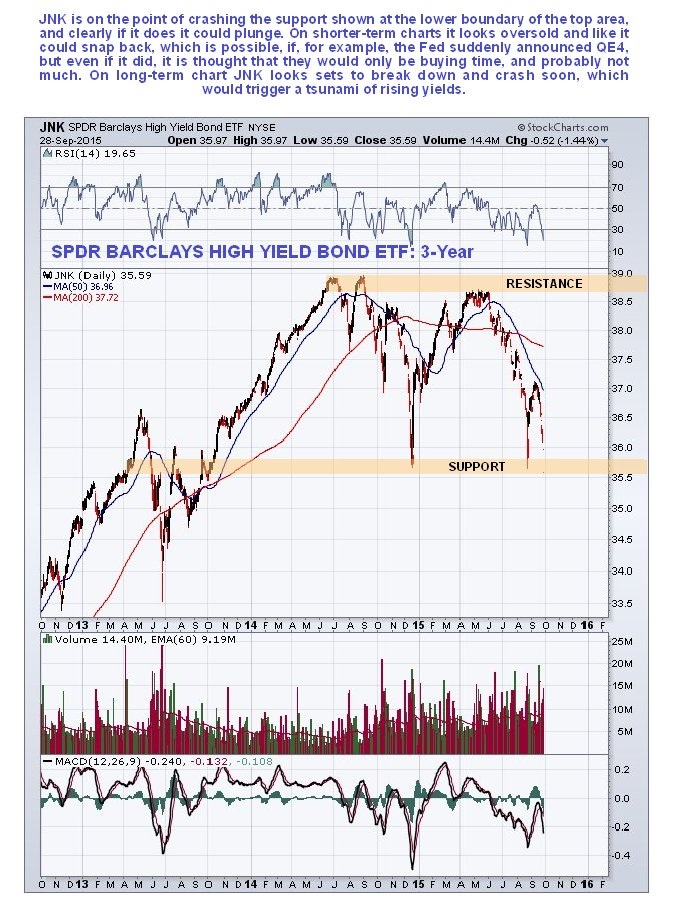
On the 3-year chart we can see how JNK is right at the point of breaking down from its top pattern. On this chart it also looks like it is getting very oversold and like it could bounce back. Could it? - anything is possible and the Fed could suddenly defuse the situation temporarily by announcing QE4, but this would only buy time and JNK would later break down from this top pattern anyway. With everything unraveling fast globally, it is very possible that QE4 will quickly become an irrelevant act of desperation anyway, and have very little net effect. When looking at this 3-year chart, remember to refer back to the 8-year chart to remind yourself of the ominous big picture. A bounce here would be just a blip in the larger scheme of things, which portends sharply rising rates as the global economy goes down in flames like the Hindenburg.
If JNK does fall as far as this chart is suggesting is possible, interest rates will skyrocket and all hell will break loose involving widespread Sovereign defaults and bursting asset bubbles. The stockmarket losses up to this point will pale into insignificance compared to what could be coming. No-one will be interested in what the Fed says anymore, and they'll be lucky if the press even bother to turn up for their meetings.
If this assessment of the outlook for Junk Bonds and debt generally is correct, then the most important thing that investors and ordinary citizens should do is to get out of debt or reduce it as soon as possible. Debt made sense during the “risk on” epoch when interest rates were kept artificially low for years, as you could borrow at very low rates to play various asset bubbles such as property speculation and stocks, but with this “golden age” looking set to come to an abrupt end, it’s time to liquidate and pay debt down before rates start to soar.
********
Courtesy of Courtesy of http://www.clivemaund.com

Clive P. Maund’s interest in markets started when, as an aimless youth searching for direction in his mid-20’s, he inherited some money. Unfortunately it was not enough to live a utopian lifestyle as a playboy or retire very young. Therefore on the advice of his brother, he bought a load of British Petroleum stock, which promptly went up 20% in the space of a few weeks. Clive sold them at the top…which really fired his imagination. The prospect of being able to buy securities and sell them later at a higher price, and make money for doing little or no work was most attractive – and so the quest began, especially as he had been further stoked up by watching from the sidelines with a mixture of fascination and envy as fortunes were made in the roaring gold and silver bull market of the late 70’s.
Clive furthered his education in Technical Analysis or charting by ordering various good books from the US and by applying what he learned at work on an everyday basis. He also obtained the UK Society of Technical Analysts’ Diploma.
The years following 2005 saw the boom phase of the Gold and Silver bull market, until they peaked in late 2011. While there is ongoing debate about whether that was the final high, it is not believed to be because of the continuing global debasement of fiat currency. The bear market since 2011 is viewed as being very similar to the 2-year reaction in the mid-70’s, which was preceded by a powerful advance and was followed by a gigantic parabolic price ramp. Moreover, Precious Metals should come back into their own when the various asset bubbles elsewhere burst, which looks set to happen anytime soon.
Visit Clive at his website: CliveMaund.com


