Lab Note #2 – Gold Hit the Mark: What It Means Now?


Gold tagged our green zone and then the blue support line (based on the range after the breakdown below the rising wedge) with surgical precision.
Sometimes, the market just confirms everything you mapped out. Today (Asian trading hours) was one of those days.
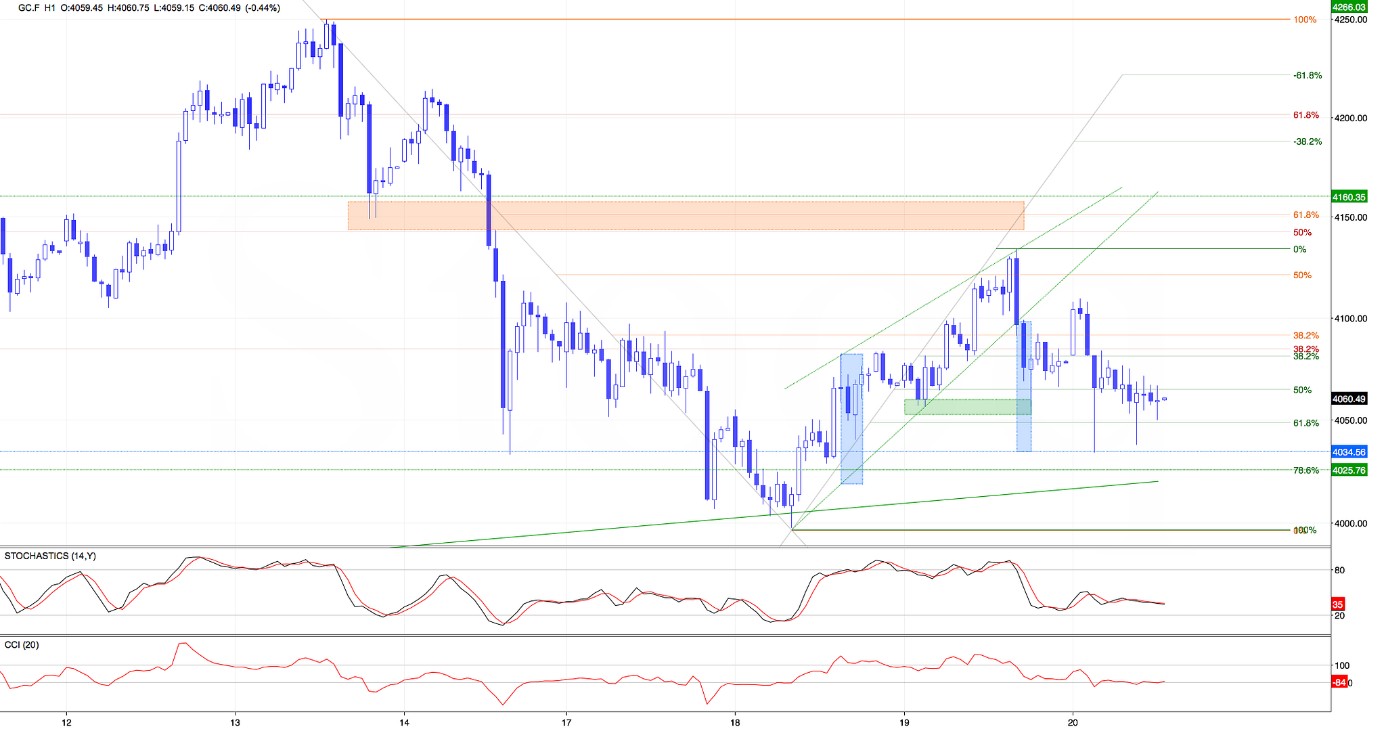
At first price dropped exactly into the green support area we highlighted earlier – right between the 50% and 61.8% Fibonacci retracement levels and bounced. It was clean. No noise. No guesswork.
So, what does this tell us?
1. Structure works.
The more precise your levels, the clearer your edge. These aren’t magic lines – they’re psychology in motion. Fear and greed are mapped in candles.
2. Confluence attracts action.
When price reacts this perfectly, it means other traders are watching too. Algorithms, smart money, even discretionary traders – they all saw it. That’s the power of stacked signals.
3. It’s not just about the past – it’s about what’s next.
Current Outlook
- Gold is wavering just above 4050 after reacting from the green support zone.
- Both indicators still lean bearish – no reversal yet.
- Price action looks cautious – buyers haven’t taken control, but they defended a key area.
- Bias: remains very short-term bearish unless we see a breakout above 4100-4110.
If we lose the 4035-4050 zone, we might test 4025 where the 78.6% Fibonacci retracement is. But if bulls reclaim 4100 with strength? The mood changes.
Watch and wait. No need to jump the gun. Let the setup tell you when it’s ready.
Missed the breakdown under the wedge? Don’t worry – another setup’s always coming.
*******


