Late Innings For the Gold Stock Rally


The gold stock rally is near our long-standing upside target of HUI 500 +/-
Of course, a target is just a target. Not a stop sign. But while today’s bulls were cowering or chasing Nvidia and other sexy headline items back in January, NFTRH was discussing why the macro-fundamental picture was aligning positive for the gold mining industry.
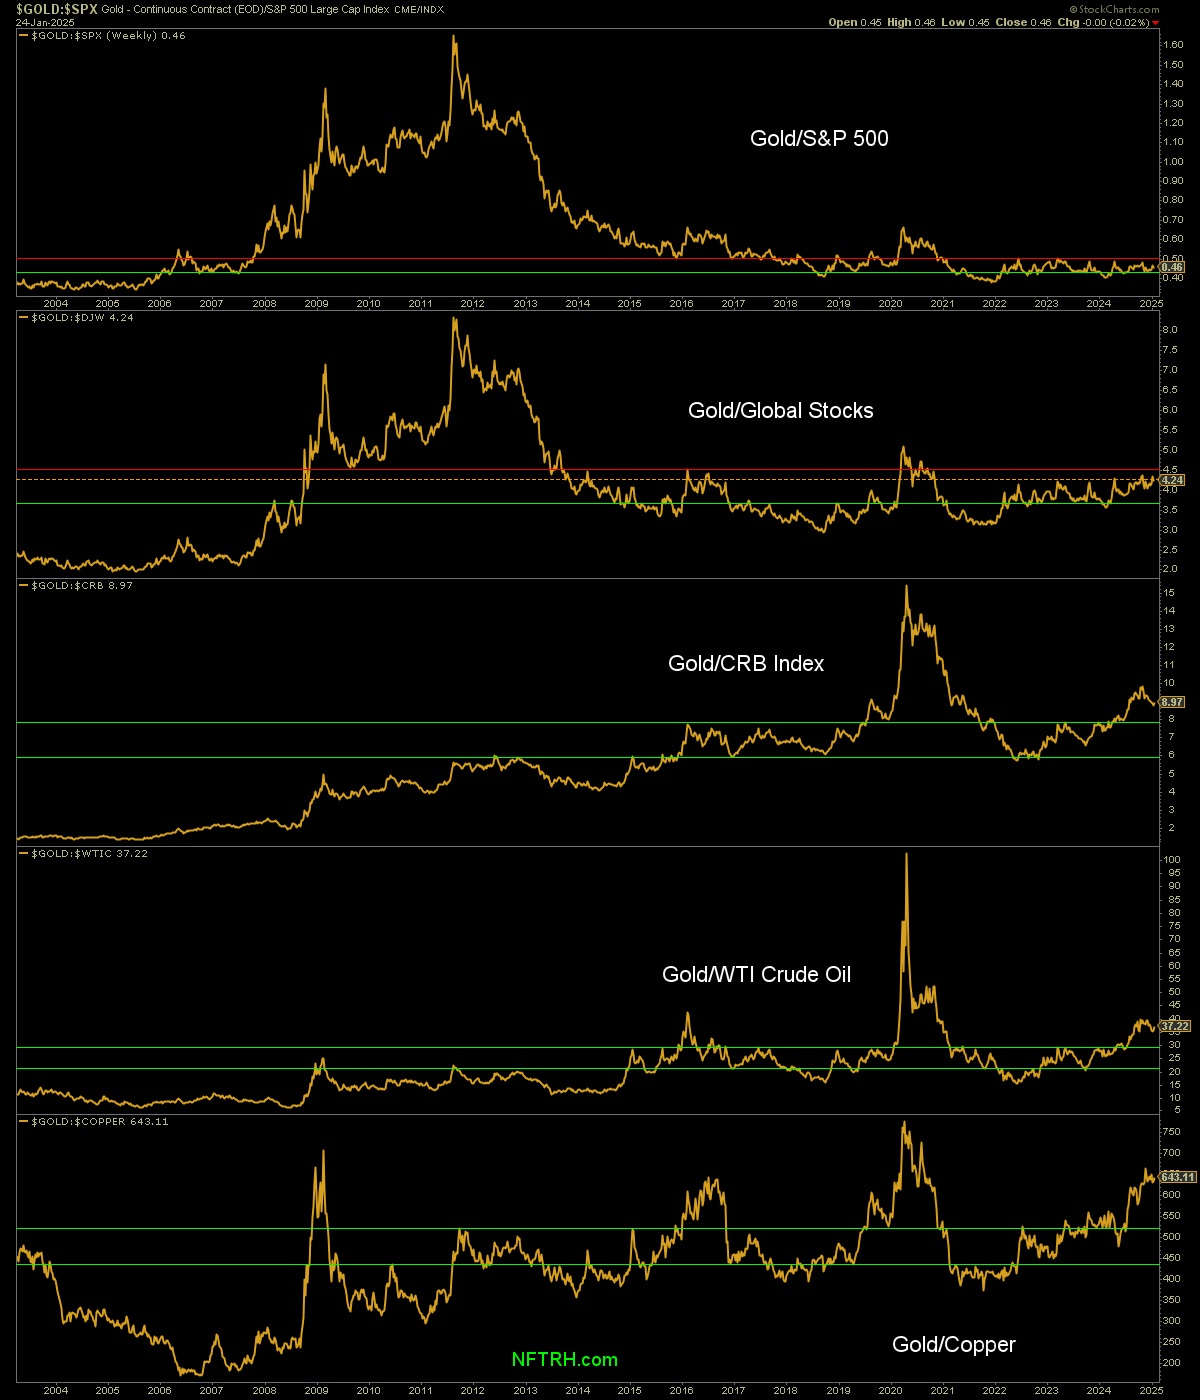
I believe backing up my assertions, so as just one example, the January 26th edition of Notes From the Rabbit Hole (NFTRH 846) included this picture of the “last man standing” in the way of a purely bullish fundamental view of gold mining among other bullish signs for gold’s “real” price, as measured against cyclical markets.
Gold’s ratios to other markets continue to be constructive. This weekly chart gives a bigger picture view and it shows Gold/Commodities firmly trending up in what is disinflationary, counter-cyclical signaling. But it is not yet “deflation scare” crisis. It is being interpreted by bubble heads far and wide as “Goldilocks”… ah, just right! I continue to see the S&P 500 as the “last man standing” in the way of a solid counter-cyclical, possibly deflationary view.
Well, the last man standing (SPX) eventually cracked and the best of the rally ensued for the counter-cyclical gold stock sector. Also, from the summary segment of that January report:
Precious Metals: Gold broke out of its Symmetrical Triangle and above resistance. Hence, the long-standing target of 3000+ is loaded. Silver broke above the wedge (handle, bull flag) top and the 50 day average, nesting atop those markers currently. As long as it continues to do that or better, we are targeting 42. GDX needs to clear 38.72 and hold it to officially break the correction. If so, using HUI the next target is 375+ (current price: 305.86).
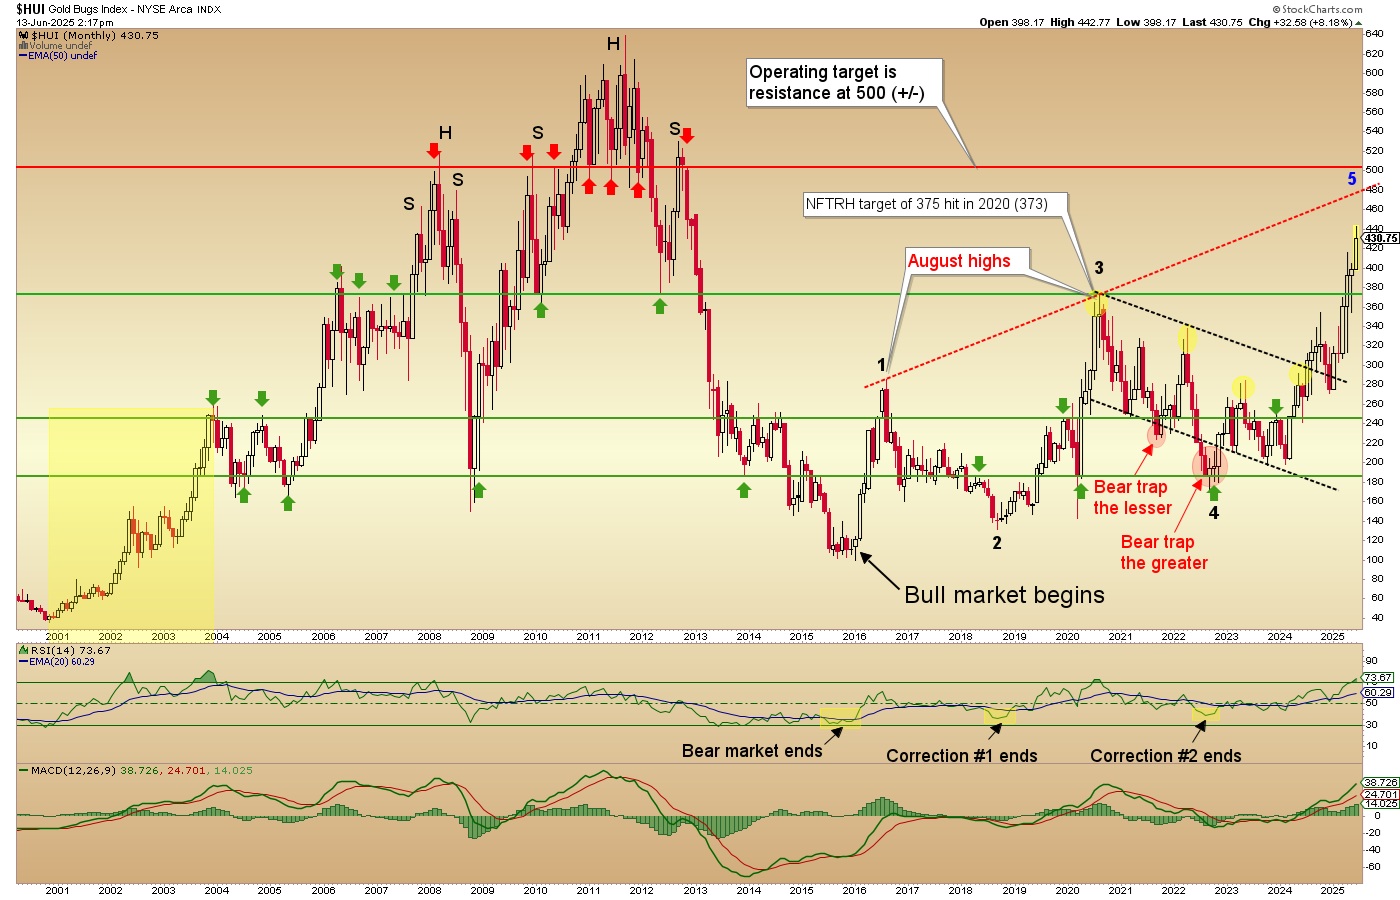
Gold went on to smash its target, silver has still not reached its target (since revised downward a bit, after the Cup & Handle pattern failed) and GDX obviously cleared 38.72 and broke its correction. HUI broke above 375, dropped to test and shake out the cling-ons, and then left that marker in the dust.
This brought on the current big picture target of 500 (+/-). HUI (currently 430) is only about 16% from the target zone, while leaving behind 115% of chart real estate from the 2024 lows and 145% from the bear market low in 2022.
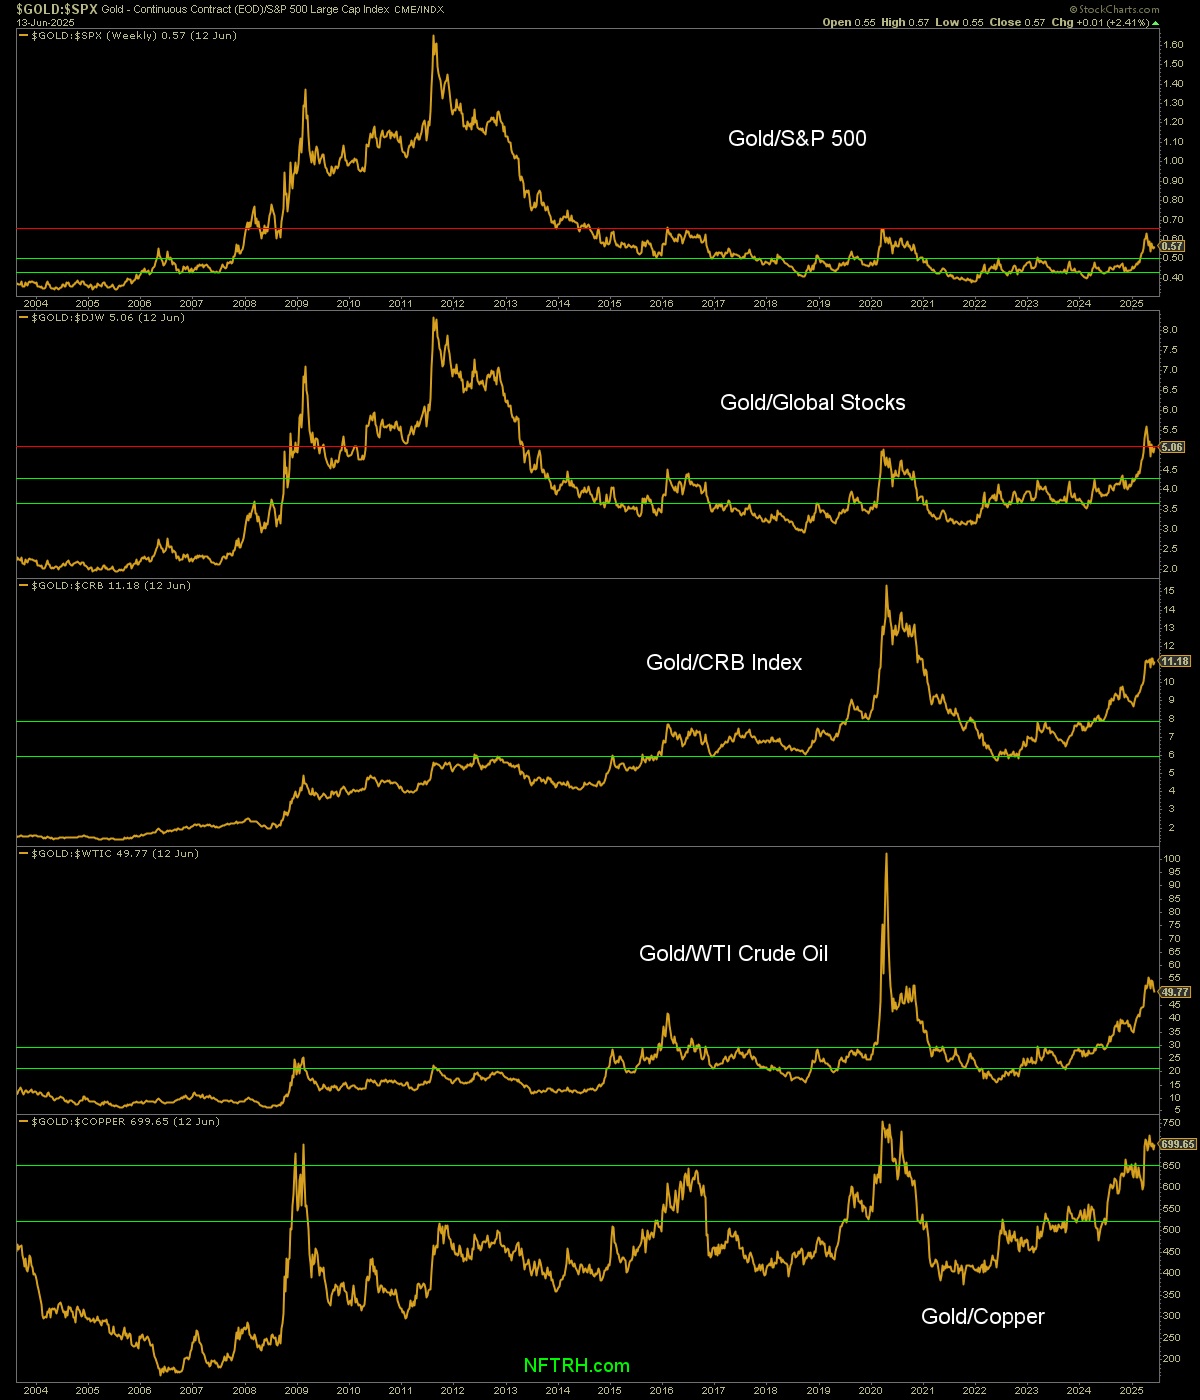
Per the chart above, the fundamentals had actually been grinding positive since 2022 (neutral vs. stock markets). Here is the updated version of that chart. A wise investor or trader will tune out war/politics and inflation noise and focus on what matters; gold’s relationship to cyclical and more inflation sensitive markets. The situation has obviously improved, fundamentally.
Some say that technicals lead the fundamentals. Well, that notion is probably courtesy of people who think they can use charts in a vacuum to effectively manage a markets. The fundamentals actually started leading the gold miners by a country mile. It was when the last man standing, the stock market, finally cracked that things really got cooking.
Today we have a situation where the stock market’s relief rally (which we also anticipated quite well) has bent the fundamentals, but has been far from breaking them.
But there are signs of excess within the precious metals complex, internally. And again, we are only 16% from target. A target does not need to be a stop sign, but when you’ve had a target in place for years as an objective, it’s probably a good idea to respect it. NFTRH associate, Hammer (@joe_hammer_gb), who has cooked up quite an interesting cycle timing system, is looking for an end to this phase of the bull through completely different methods than my target. He has been appropriately bullish gold stocks, and has for some time viewed June as a timing window.
This public post is far from comprehensive. We will look at the sector’s internals, momentum and of course fundamentals, along with more technicals this weekend in NFTRH 867. But boiling it down to one chart – a chart I have used for years now, since the bull began in 2016 – it will pay to be conscious of where we are vs. where we have been, and the once-future expectations that are now only 16% away. It’s a risk/reward thing.
Oh, and the situation is getting overbought on the monthly chart and big profits are on paper, if not in hand. It is long-standing tradition in the gold “community” to call “buy”, but not so much to call “sell”. Indeed, I am not calling “sell” either. I am calling a target that is finally within hailing distance concurrent with an associate focused on timing (June).
For “best of breed” top-down macro analysis and market strategy covering Precious Metals, Commodities, Stocks and much more, subscribe to NFTRH Premium, which includes a comprehensive weekly market report, detailed NFTRH+ updates and chart/trade setup ideas, and Daily Market Notes. Receive actionable (free) public content at NFTRH.com and subscribe to our free Substack. Follow via X @NFTRHgt and BlueSky @nftrh.bsky.social, and subscribe to our YouTube Video Channel. Finally, check out Hammer’s trade (long and/or short) setups.
********
More from Gold-Eagle


