Life Is Tough For…


…any newsletter author who is inherently optimistic about the future of gold and silver. Disappointment is the name of the game. It is not a matter of mere days or weeks; not months, or ‘gasp!’ even years of consistent disappointment. More than two decades have passed since the first blatant intervention to prevent the price of gold to rally beyond $400/oz. While many have speculated that the metal prices are expected to break free soon, my contributions included, there is as yet little more than hope to fuel our optimism. Supported by a belief in Stein’s Law.
My realisation that the price of gold price was being controlled – silver was not as yet in the cross-hairs – came in February 1996. The price of gold had completed a large 18 month near symmetrical triangle, and broke higher after it had completed wave 5 of the pattern; exactly as technical theory predicted. Moving higher after the break at about $390, the price of gold soon reached $415 to give a strong buy signal and then reversed in its tracks to break below $400 and keep on going down.
The explanation of why this was happening soon became known to the regular visitors to the popular gold-eagle.com website. Gold’s bullish reaction had scared the central banks into exploiting the low near risk-free lease rate for gold in a climate where a 30-year Treasury bond had a yield in excess of 7%. They opened their vaults to what were then still a relatively new phenomenon - large hedge funds – allowing them free access to lease gold at 0.5% p.a. Loading up on a few tons of gold and selling them in probably the OTC market, they could invest the proceeds at more than 14x the cost.
No wonder the PM market was swamped with supply and the price dropped fast.
The premise of course was that later when the price was low enough, the hedge funds would buy back the gold they had sold and return these to the vaults. The profit they made from the spread would probably be peanuts compared to the capital profit they made on the deal, effectively by shorting gold.
Their exhilaration did not last very long, less than two years. Two crises erupted in the financial world that resulted in a jump in the price of gold. The Asian Tigers became troubled kittens and rocked the world and a little later, Russia – in a mess after the Iron Curtain had rusted through – defaulted on its loans. It was evident that when a crisis ignited demand for gold it would be too late for the hedge funds to join the rush to buy gold; they would be adding gasoline to a raging fire.
The scramble for gold ended when Switzerland, holder of 3500 tons of gold, out of the blue announced they would sell half their gold and use the proceeds for humanitarian causes. The two sentence announcement, if memory serves, included the statement that more details would be forthcoming later after the decision had been debated, or words to that effect. It had the desired result in cooling down demand, as did the also irrational proposal, in reaction to the Russian default, to sell half of the UK’s gold in a series of auctions designed to move the gold at the lowest bid price.
When the gold price broke clear below $300/oz compelling many gold mines to reduce production to high grade areas in order to make a profit, it became evident that the game was over – the price had to be allowed to increase again, which it then did after it had tested the $250/oz level on two occasions.
How the hedge funds cleared their short positions with the central banks is not known – which probably was done in cash as the gold most likely had never moved out of the vaults, except for the metal that went to India for the jewelry market. Which meant a new way of controlling the price of gold had to be found; enter COMEX and the game that has now frustrated all of us, writers and readership alike, for the past two decades. And still continues to do so.
Silver was disregarded as not of any consequence for the first part of this saga. There was the flurry of activity when the Hunt brothers tried to corner the silver market, but when that attempt in the late 1970s was defused by changing the COMEX rules, silver went dormant again until after 2000. When the price of gold began to march higher off the lows at $250/oz, silver soon followed its example. It then also joined gold on the COMEX hit list. In time it became the more critical of the two metals for those who were shorting the price. Because silver is an industrial metal and relatively few mines primarily produce silver, rather than as a byproduct from a base metal mine, its above ground reserves are much smaller than for gold.
So we continue to wait for what is the only solution in sight – for COMEX to run out of metal to deliver against contracts. By all accounts, that ought to have happened long ago. But stratagems such as EFPs and rumours of gold being diverted from other uses to mint large bars for COMEX delivery are postponing the day of reckoning.
But, as hinted in the introduction, Herb Stein’s Law from the 1980s nevertheless does apply still: “If something cannot continue indefinitely, it will stop.” The question so far unanswered is when we can expect this to happen to gold and/or silver.
Herb Stein’s law also applies to Wall Street. Given the mess made of the economy by Covid-19 and related issues, it is clear that equity prices cannot continue indefinitely as they had been doing – setting new all time highs nearly every week. The question here is not only when it will stop, but also will it do so with a bang or a whimper?
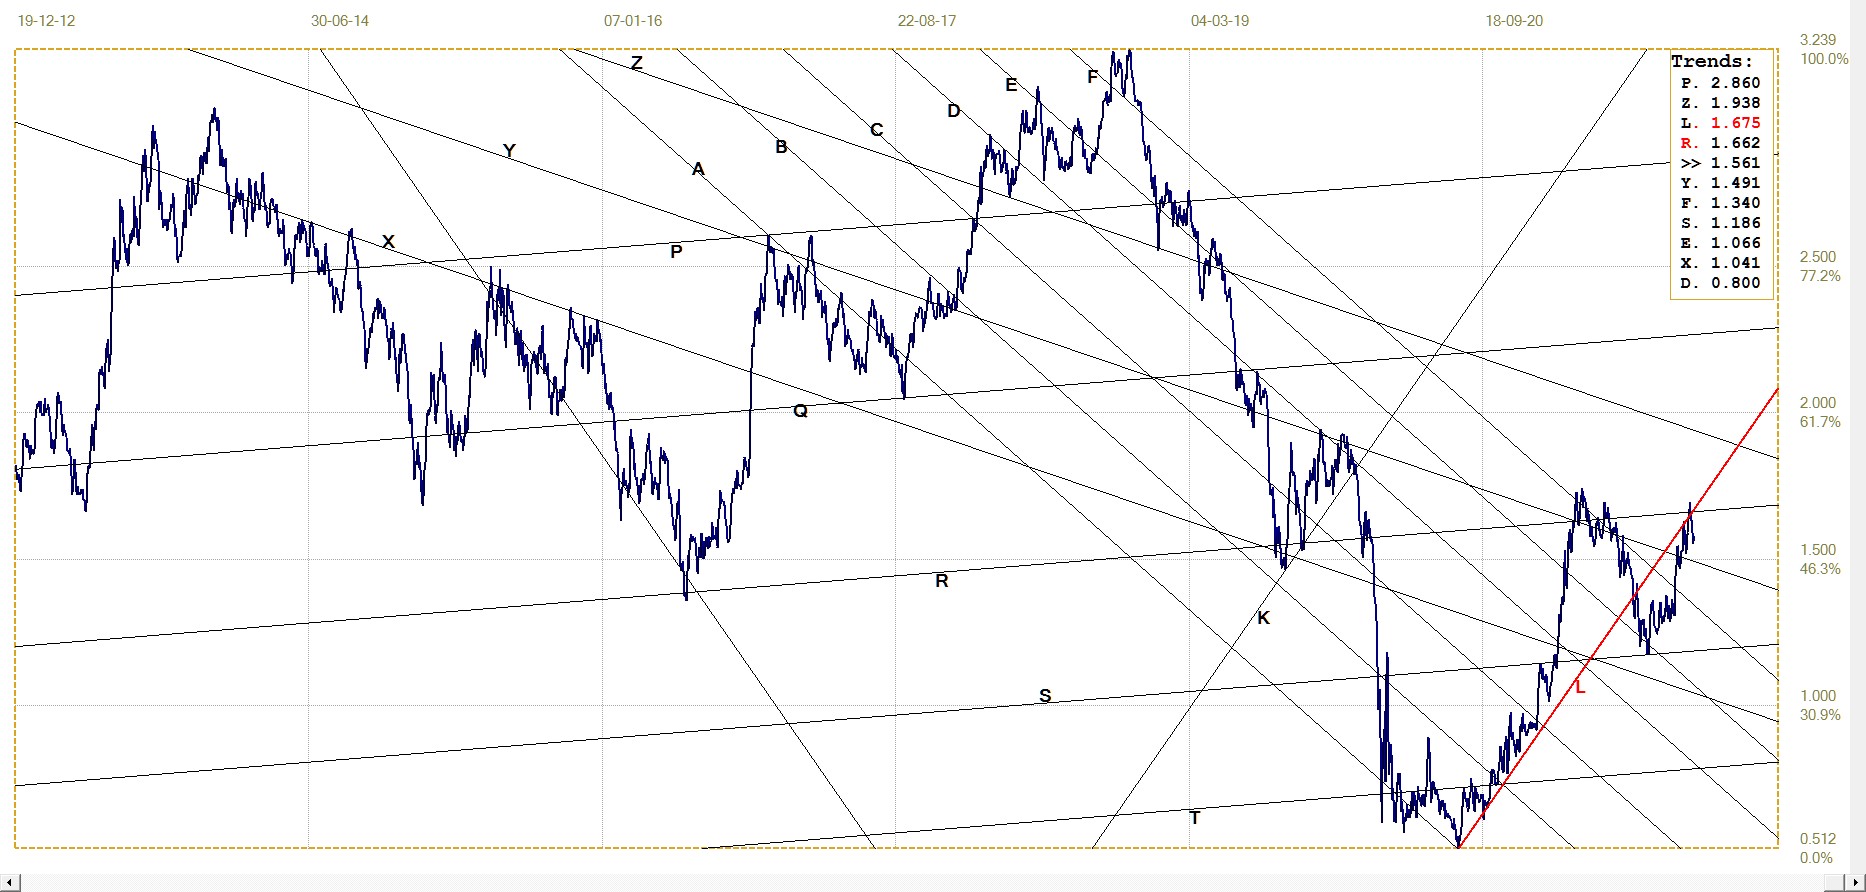
Euro–Dollar
The euro seemed to have ended the slide against the dollar that had kept it in the steep bear channel KL. However, the recovery off line E ran out of steam just when it looked last week as if the euro had turned bullish. On Friday the dollar staged a rally out of the blue to reach above 94 against the dollar index. The euro felt the head wind and reversed almost all of its recent gains to end the week at the support of line X.
Investors must have thought that if all three major equity indices can set new all time highs there must be something good in the economy, despite appearances to the contrary. It can’t be coincidence and so the dollar must be a buy as well.
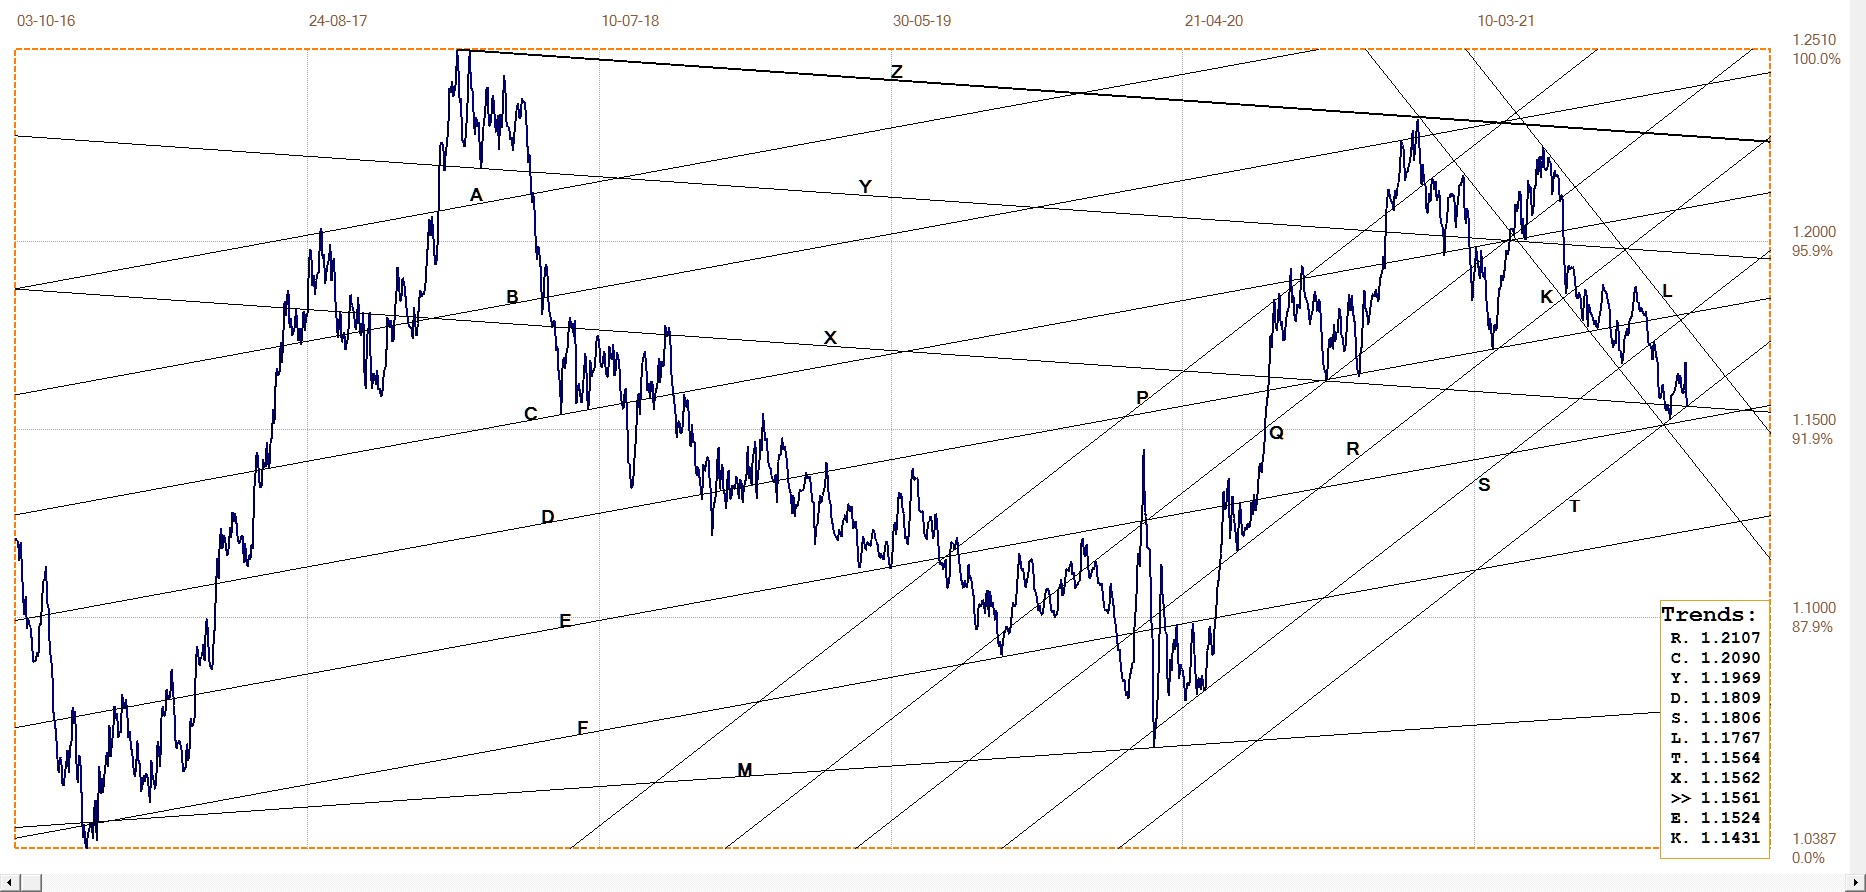
Euro–dollar, last = $1.1561 (www.investing.com)
DJIA daily close
As discussed here during recent weeks, the evidence from intra-day trading behaviour and the shifts in the trading volume, all pointed to a major buyer entering the market whenever it looked as if the Bears could take control. After several weeks of market action that had Wall Street teetering on the edge of the bear trend being predicted by almost all maker? commentators, last week the Bulls took the bit between the teeth to ramp Wall Street up in a near straight line.
Is it because of the prospect of more government largesse being dispensed under the pretext of infrastructure development, or to combat climate change, or whatever is the crusade of the day? Or is it simply that there is enough liquidity in the economy to keep equities buoyant, even with the off-take that finds its way into the crypto domain where it mostly lies dormant as far as the real economy is concerned?
It is well known to old timers that a long bull market often ends with a blow-off rally. Whether this will be another such example, to prove the doomsayers correct, remains to be seen.
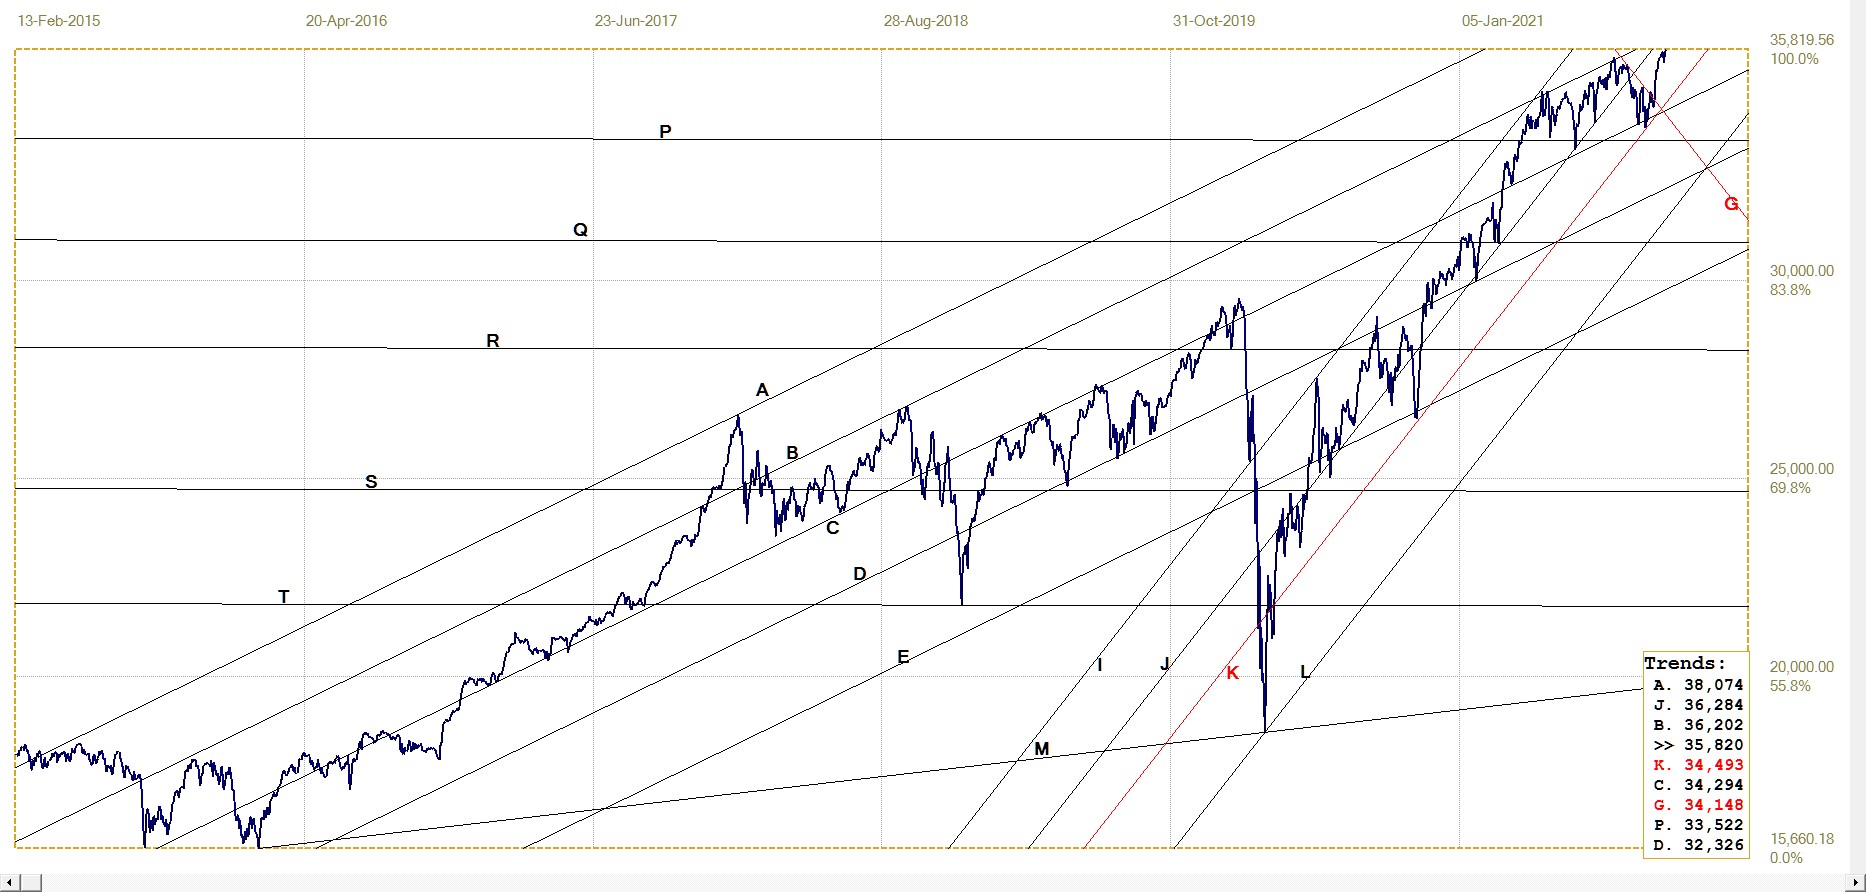
DJIA. last = 35819.56 (money.cnn.com)
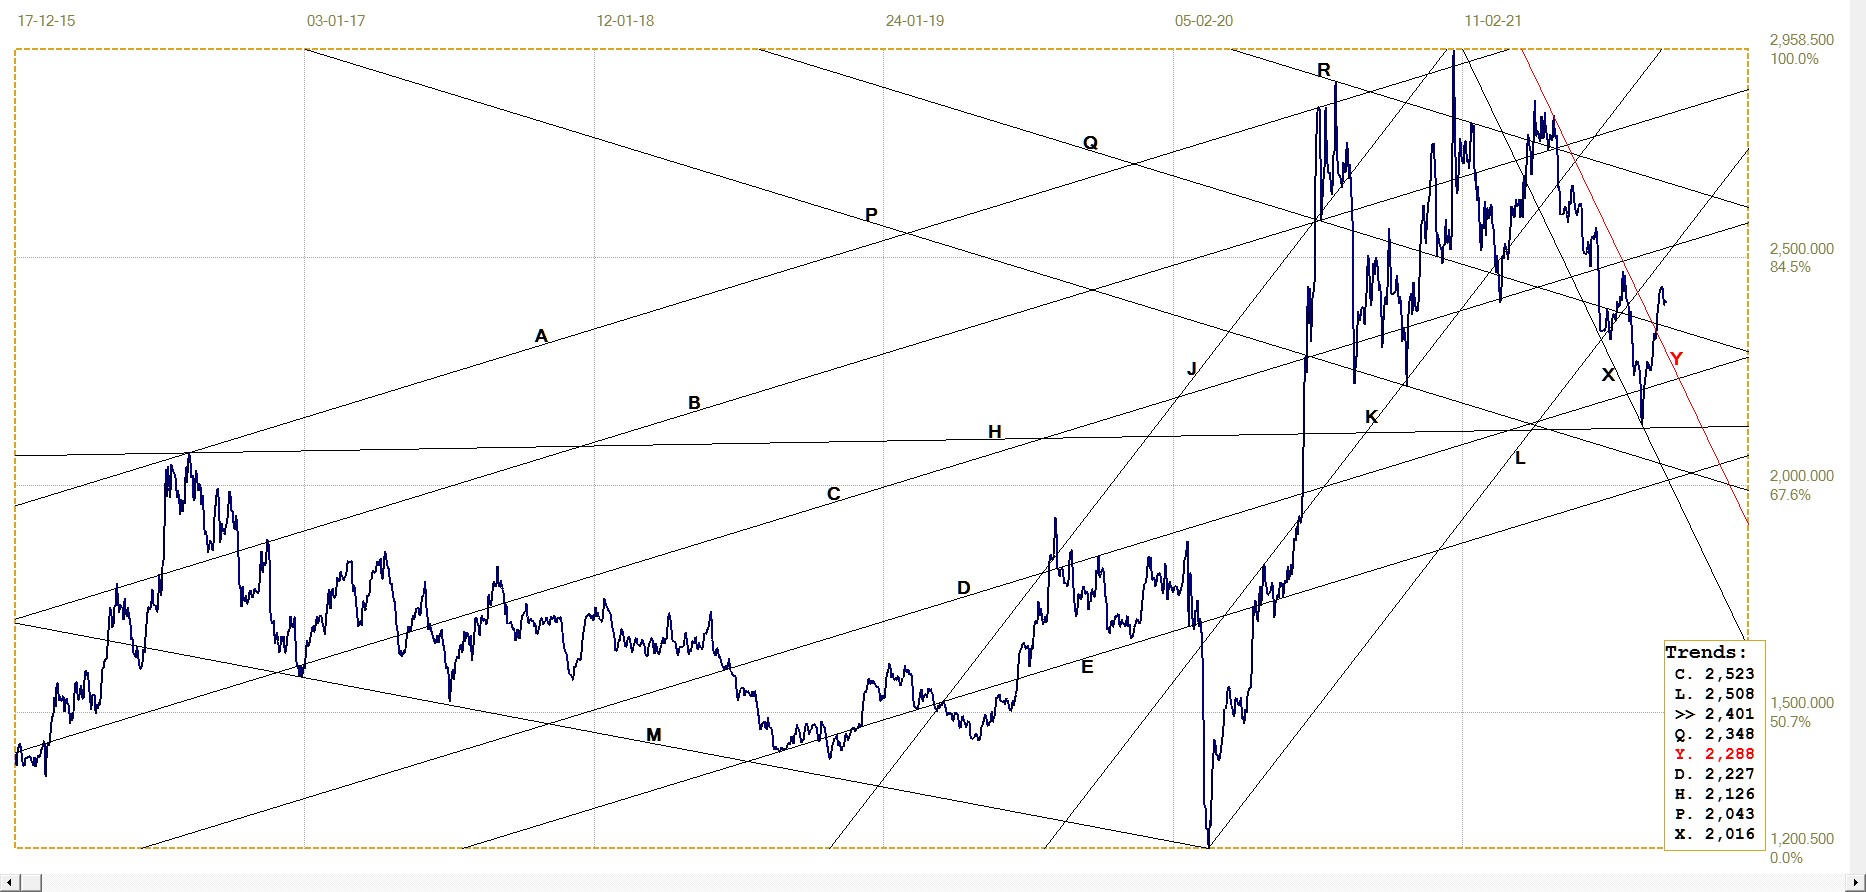
Gold London PM fix – Dollars
Gold price – London PM fix, last = $1760.15 (www.kitco.com)
Last week’s comment, that gold was in the rarely seen situation where it was not the leader of the PM metals but trying to play catch-up with silver, still holds. For a while last week it looked as if gold had cleared the $1800 hurdle and could be challenging silver for the leadership. Then comes Friday and both metals were hammered by the suddenly rampant dollar.
The gold price not only failed to hold at $1800, but plummeted. Silver also felt the effect of the stronger dollar, but managed to hold the London fix a fraction above $24, then ended the day 6c below that level, still in contention. At least gold’s London PM fix held near line D and then rebounded into the US close later – nevertheless still short of $1800, while showing some technical promise.
Euro–gold PM fix
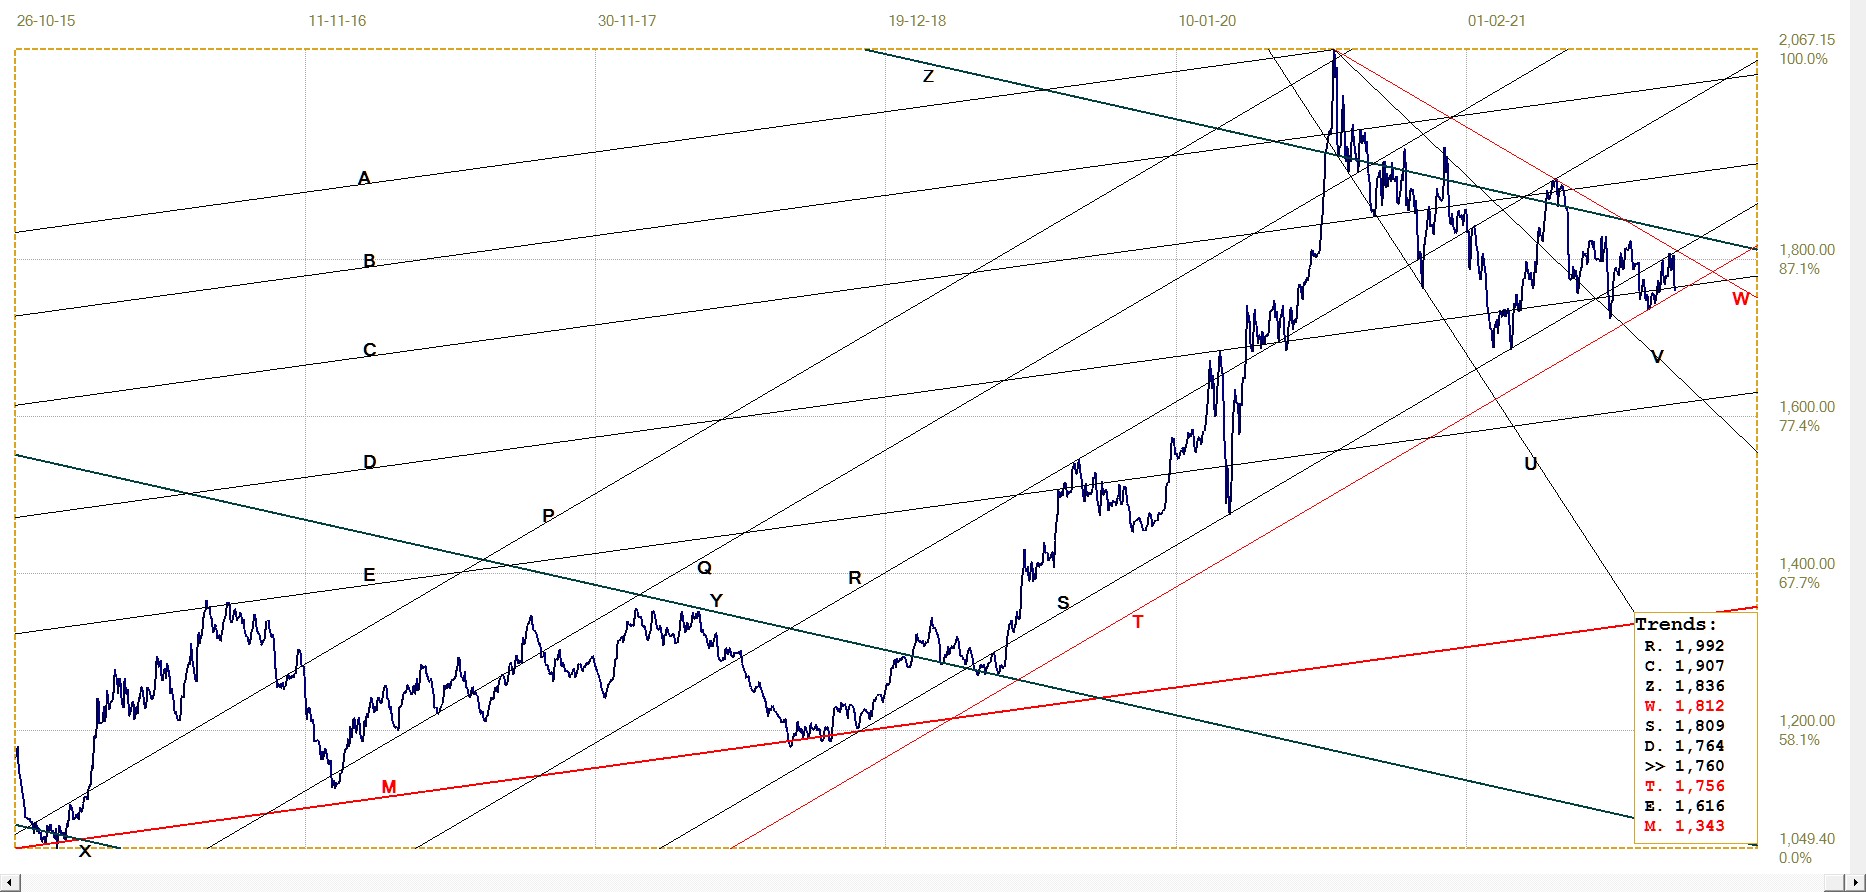
The euro price of gold valiantly tried to hold the new recovery back into bull channel RS after having twice broken lower, but then failed to extend. The attempt failed on Friday when the gold price fell steeply at the time of the London fix. The euro price of the metal was not reprieved by a weaker euro and it has now broken clear below the channel.
Technically the price still has some support to trigger a rally as long as it holds in the narrow channel ST. It all depends on whether Friday’s dollar rally was a flash in the pan roor? a definite change in the dollar that will see further ripples in various markets this week and later.
Euro gold price – PM fix in Euro. Last = €1524.12 (www.kitco.com)
Silver Daily London Fix
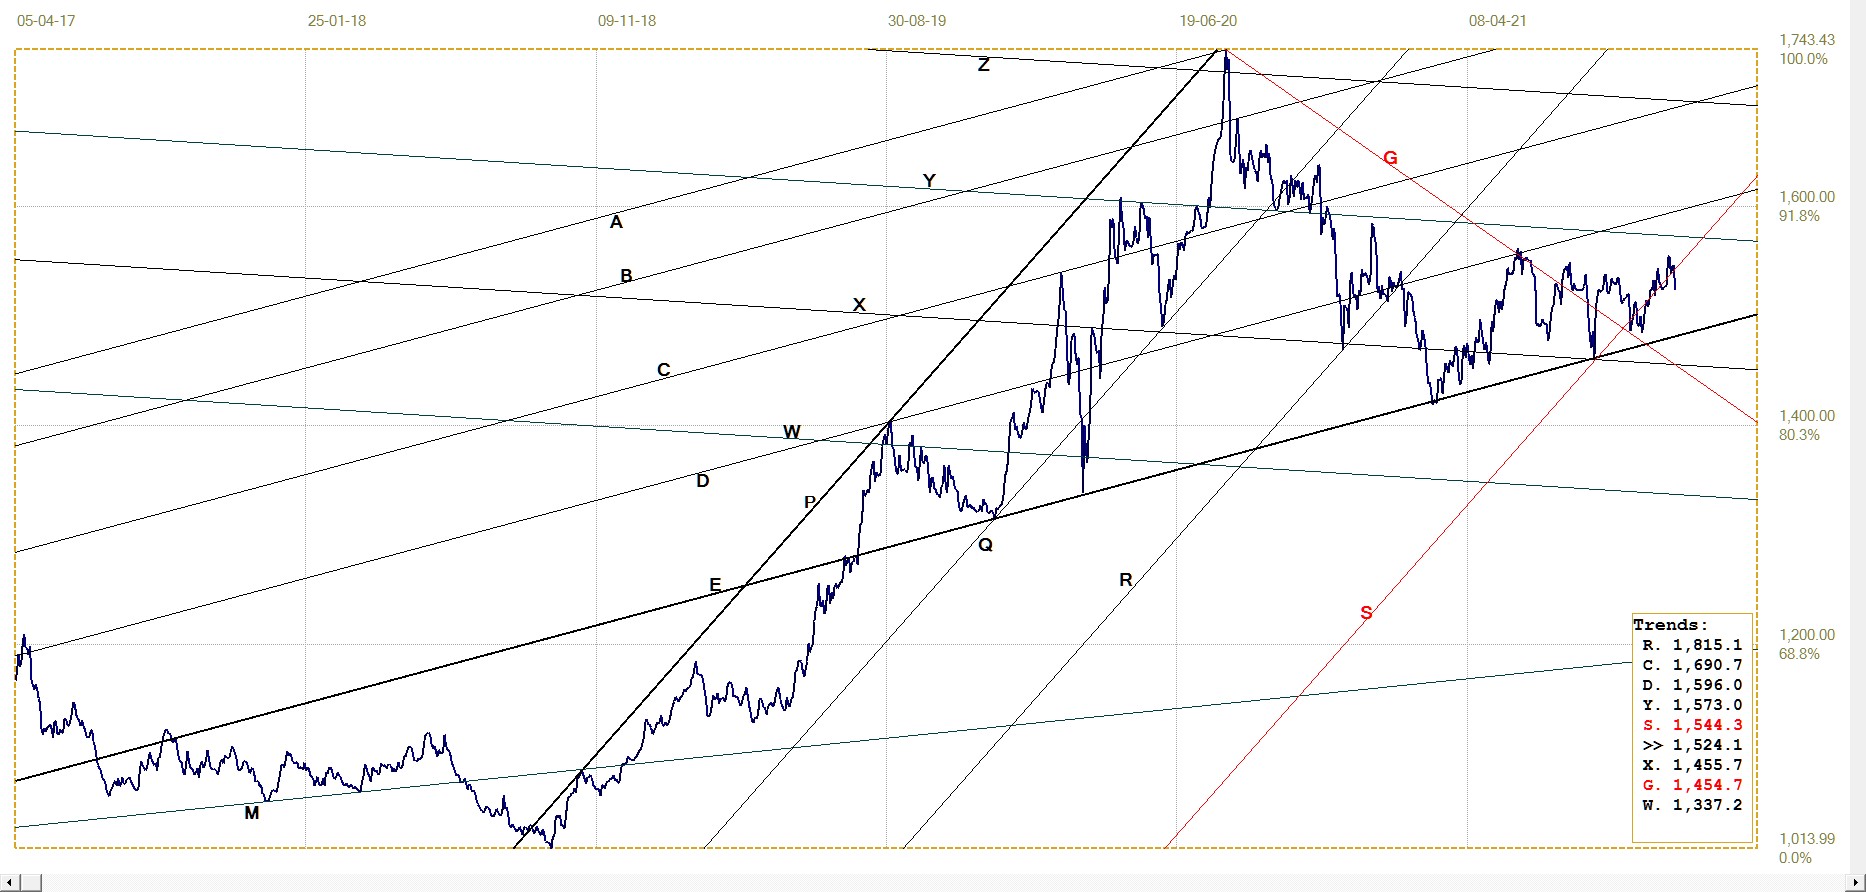
Silver daily London fix, last = $24.01 (www.kitco.com)
That This chart shows that the price of silver weathered the sudden dollar strength late last week better than what the price of gold could do. This implies silver remains at point, with gold coming along in its wake once the trend is established.
The clean break above steep bear channel and into the upper band of channel PQR that contains the top formation is bullish, but this has to be confirmed by a break back into the main bull channel JKL.
U.S. 10–year Treasury Note
Just when it looked as if the yield on the US 10-year Treasury note was confirming the general expectation for higher inflation by breaking back into channel KL and also to above line R?, the yield reversed the trend last week to break below line R and out of channel KL.
What happened raised interesting questions. Did the yield break lower because of good evidence that the trend in higher inflation is proving to be transitory? Or can it be that the stronger dollar attracted (foreign) investors back into the bond market? Or is it that counter-intuitive behaviour in too many markets triggers suspicion that there is behind the scenes activity in the markets other than the normal market forces.
10–year Treasury note, last = 1.561% (Investing.com )
West Texas Intermediate crude. Daily close
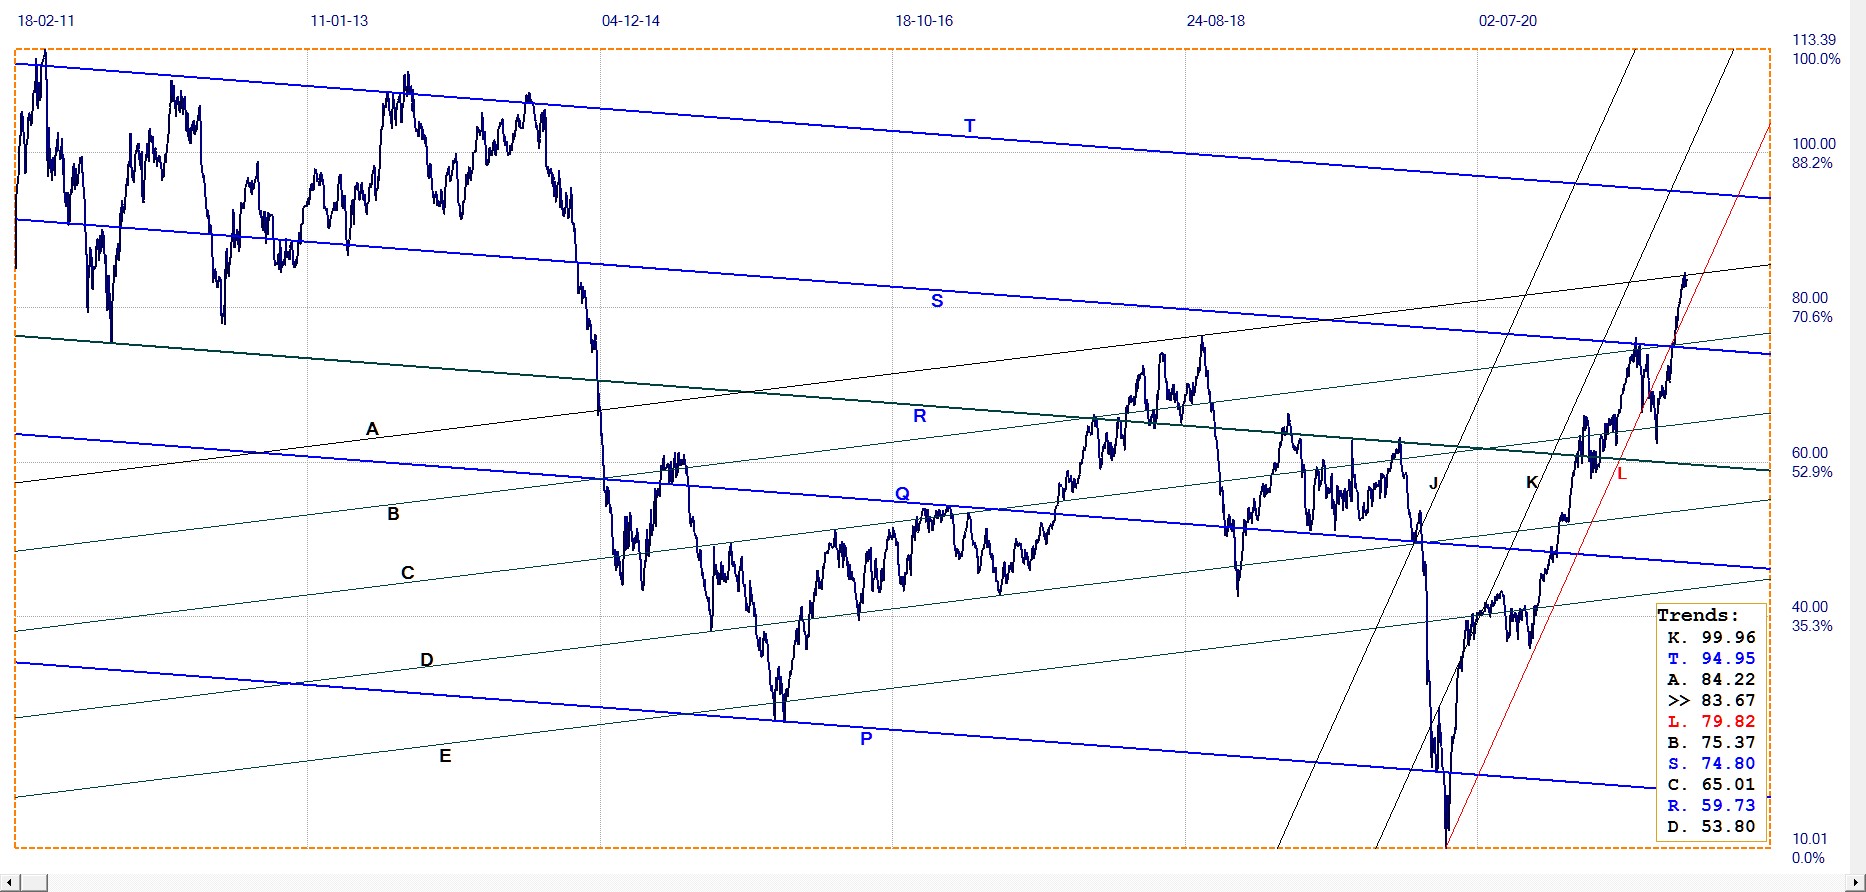
WTI crude – Daily close, last = $83.67 (www.investing.com)
It has been known for a long time that too much liquidity, too low interest rates and too much meddling by the government in the economy in general and in markets in particular have undesirable consequences. The world now sits with an energy crisis due to a combination of factors, some with their origins in the muddle through economy all countries experience as a result of Covid regulations, of their own governments and of those in neighbouring countries.
The rising trend in the price of crude oil has stalled at line A. Line A is the top of the large chart pattern between lines A and P – a megaphone. Such widening patterns reveal a buildup of more intense pressure and typically contain steep and sustained trends, as in this instance. If the price were to break higher out of this chart pattern, a strong and sustained rising trend can be expected.
© 2021 daan joubert.
********


