Long Cycles And Trend Changes


S&P500 Index: It bottomed in March 2009 about 670 and is currently about 2,000. The S&P, thanks to QE, ZIRP, Central Bank purchases, and who knows what other contrivances, has levitated to the magical 2,000 level. Will it go higher?
Dollar Index: The dollar index, currently about 83, is well below its high in 2002 at about 120. However it is also well above its 2008 low around 72. Will capital flows into the US and the fear trade continue to levitate the dollar?
Gold: Gold prices peaked in August 2011 about $1,920 and today gold sells for about $1,260. However, prices have retreated to 2010 levels but are still far above the lows in 2001 at about $255. Is gold ready to rally?
What about cycles?
- I have little faith in short term cycles which can be easily overwhelmed by other forces.
- I prefer longer cycles as I believe they are more reliable.
- I think any cyclic analysis should be confirmed with additional technical and fundamental analysis.
S&P500 Index: Consider the following graph of monthly prices for 30 years. The blue vertical lines are drawn every 81 months – about 7 years. Note the highs in 1987, 1994, 2000, 2007, and 2014, and note the current “over-bought” condition of the S&P as indicated by the MACD and TDI indicators. This graph does not conclusively inform us that the S&P is ready to correct, but it does indicate that the S&P could be forming a 7 year cyclic top with a low due perhaps in 2016 – 2019.
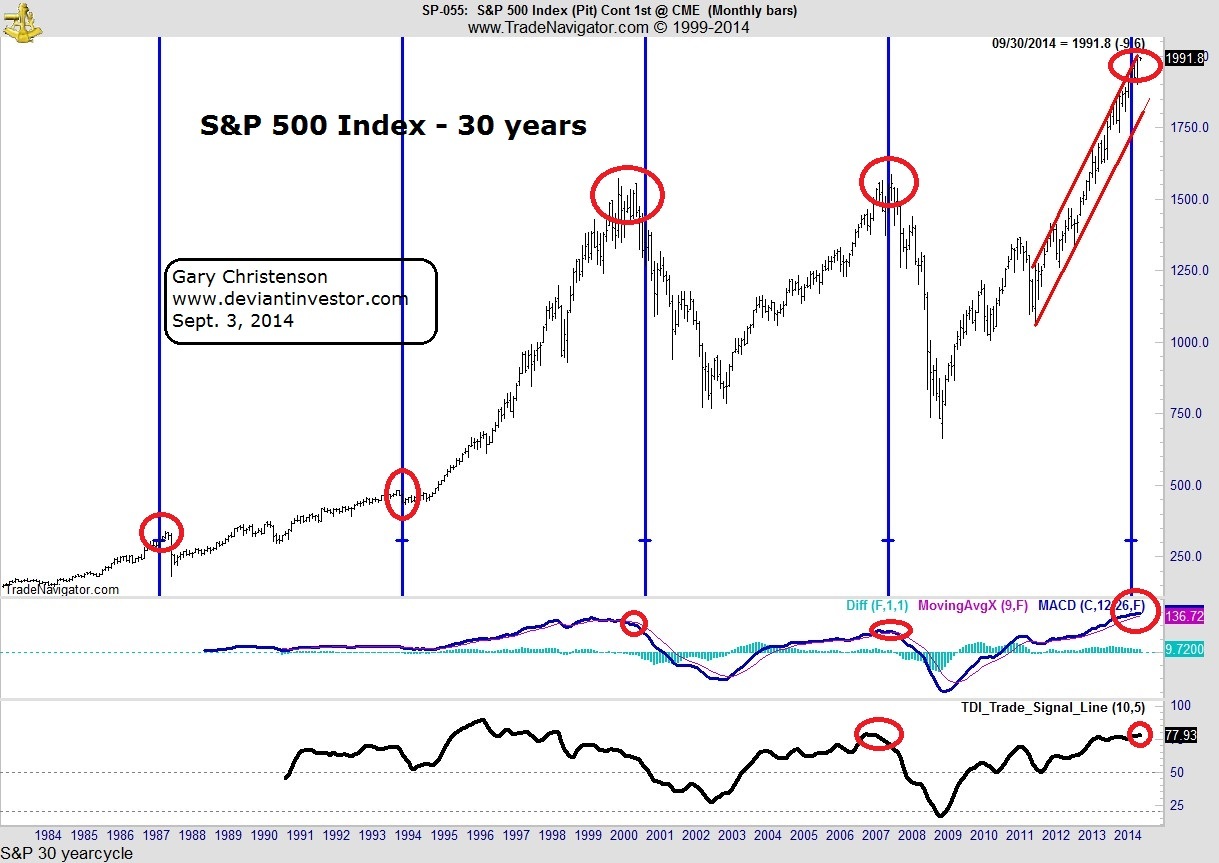
S&P500 Index – 30 Years
Dollar Index: Consider the following graph of monthly prices over nearly 30 years and the vertical blue lines every 75 months. Note the alternating high – low pattern with a high in 1989, low in 1995, high in 2002, low in 2008, and possible high in 2014. The dollar index might move higher and take longer but it could be topping now. The monthly TDI is modestly over-bought and the weekly (not shown) is strongly over-bought. The dollar index could be peaking.
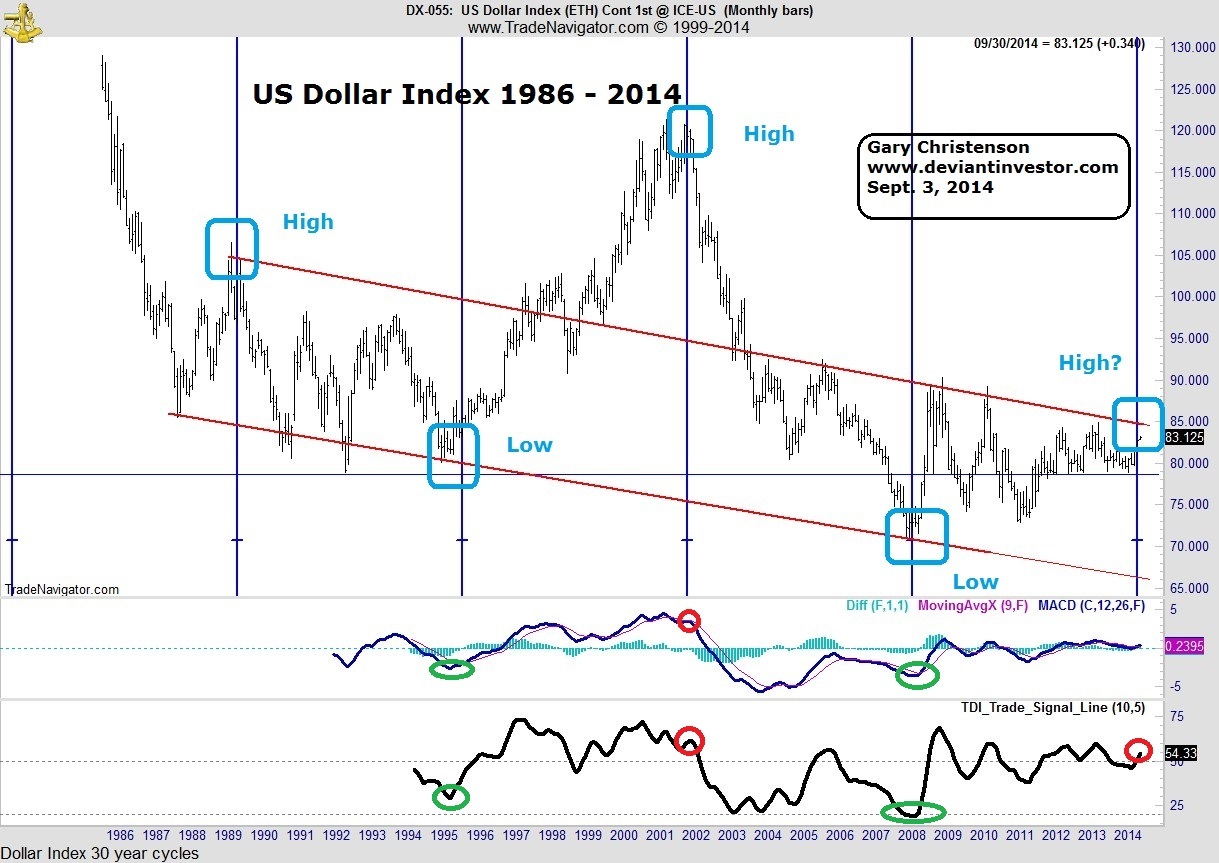
US Dollar Index
Gold: The gold chart shows 20 years of prices with blue vertical lines every 56 months. Note the lows in 1999, 2004, 2008, and 2013. Gold appears to have made a long term low in 2013 – 2014 and has built a base from which another rally should appear. The MACD and TDI indicators are oversold and indicate strong rally potential. Further, my long-term empirical gold model indicates that current gold prices are too low by about 20%, which will provide a “tail-wind” for gold prices over the next several years, independent of massive QE, more wars, dollar weakness, and economic slumps that create even more unpayable debt.
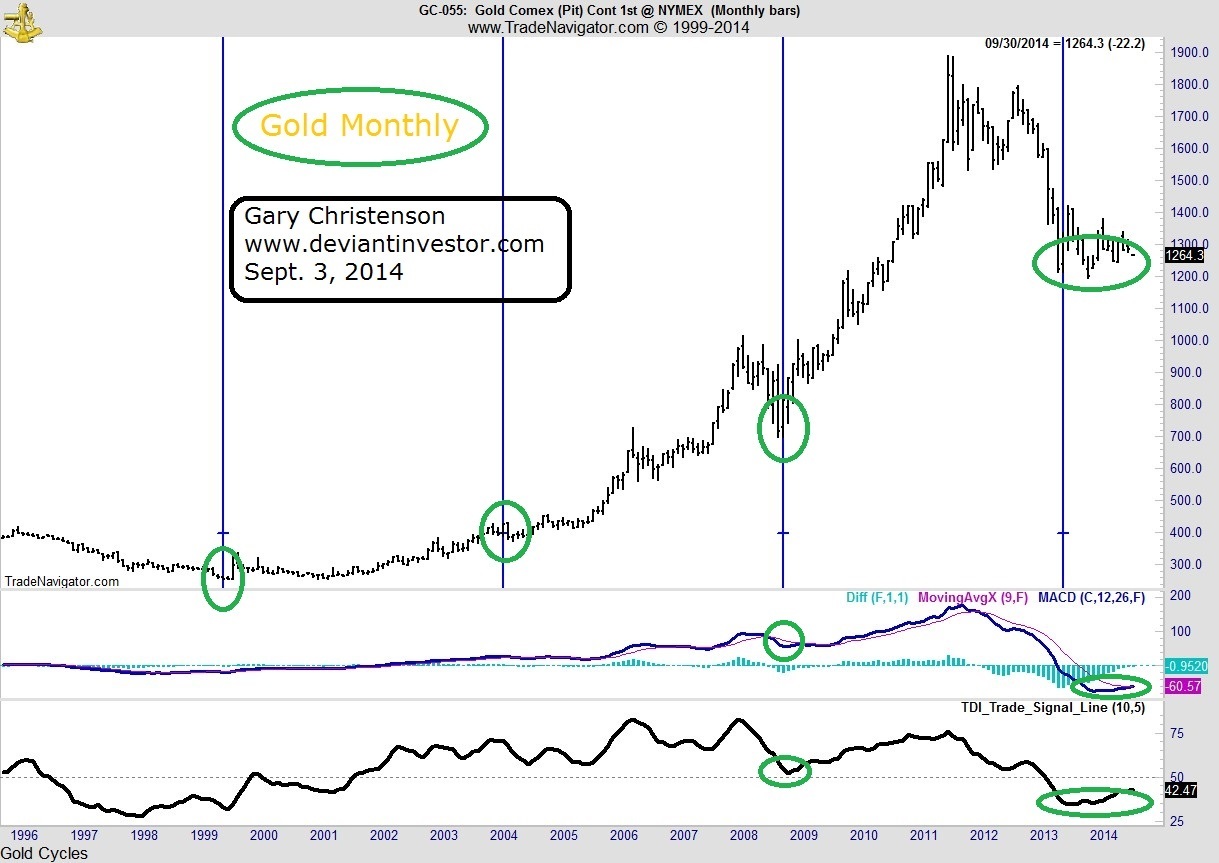
Gold Prices – 20 Years
Given the troublesome economic conditions in the world and potential expansion of war in the Ukraine, Iraq, Syria, North Africa, and elsewhere, there is considerable risk that the S&P could fall substantially and a strong probability that gold will rally. Furthermore, there is a growing global movement away from the use of the dollar in global trade, led by China and Russia, and that bodes poorly for long-term dollar strength, particularly as cycles indicate a potential top due in 2014. A fall in the dollar would likely be accompanied by a rise in gold prices.
Markets can move farther and take longer than most people expect, but it is certainly time to consider that the S&P is quite high and ready to reverse its five plus year uptrend, and that gold is too low and set to reverse its three year downtrend.
********
My book (“Gold Value and Gold Prices From 1971 – 2021”) describes my gold price projection model in detail, and discusses many other topics such as QE, counter-party risk, gold cycles, price projections from other writers, price bubbles, ratios to the Dow and silver, and when to sell gold. My book is now available at my retail site and at Amazon in paperback and eBook.
 Gary Christenson is the owner and writer for the popular and contrarian investment site Deviant Investor and the author of the book, “Gold Value and Gold Prices 1971 – 2021.” He is a retired accountant and business manager with 30 years of experience studying markets, investing, and trading. He writes about investing, gold, silver, the economy and central banking.


