Long Or Short Stocks Is The Question: I've Got The Answer!


Stocks managed their third session higher as of Thursday June 27th and its too late to jump onto that move. Major indexes and leading stocks have rebounded into resistance along with a few key moving averages. The next 1-3 days favor a pause or pullback at the least simply because of the selling momentum and multiple resistance levels being tested. It is only natural for traders and investors to pull some money off the table or short at these levels.
Stepping back seven days and looking at the overall stock market we have seen a substantial drop in prices across the board. A Ton of stocks have formed their first impulse thrust to the downside which is typically what happens when a stock market is in a topping process (Stage 3 Distribution). The type of damage we had cannot be fixed overnight. This will be a process if it is to resolve to the upside and price action will remain wild (volatile).
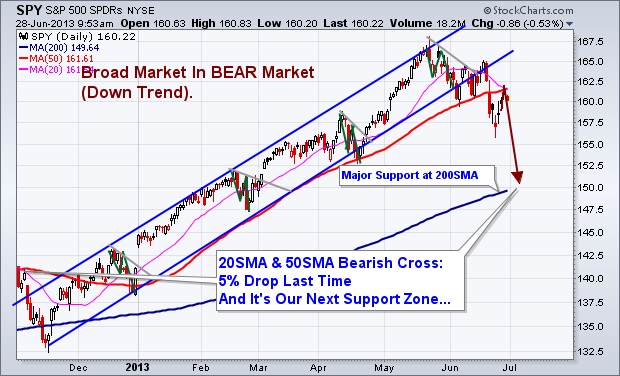
The odds from a technical analysis stand point using Price, Momentum, Cycles, Volume and Moving Averages point to lower prices still to come. Actually they point to another 5% drop from the current level.
Major Points to Be Aware Of:
• 20 Simple Moving Average is crossing below the 50SMA. Last time this took place it triggered a 5% drop in the SP500.
• Price has bounced for three consecutive days. This typically puts the odds in favor for a pullback.
• Price bounced and hit it’s head on the 20 and 50 moving averages on Thursday (RESISTANCE).
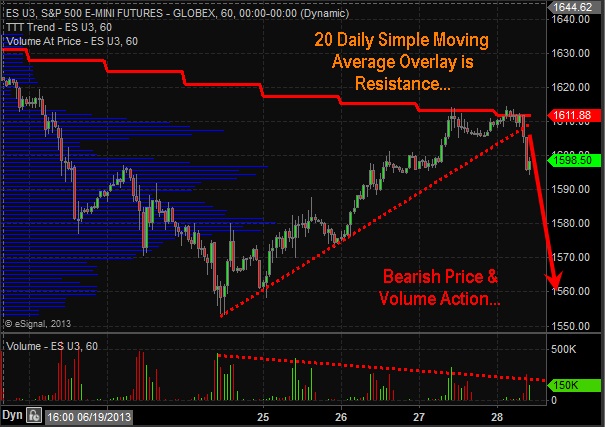
• Market Time Cycles are in a decline phase meaning there will be a negative bias and seller will be actively pulling price lower on bounces.
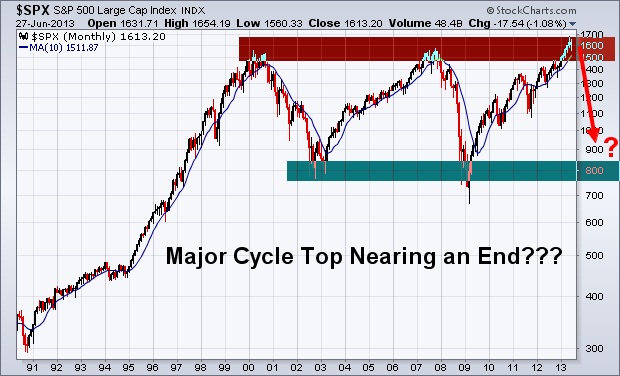
• Major Long Term Chart looks favorable for a bear market to start which may last 12 months. If so this is just the beginning of some scary yet highly profitable potential trades in the coming year. Stocks fall 3-7 times faster than they rise…
Daily SP500 Trend & Analysis Chart
Long Term SP500 Trend Chart
BEARISH SP500 Price & Volume – 60 Minute Intraday Chart
Looking at these charts from a long term, intermediate and short term basis the odds are favoring lower prices. Being short stocks or buying inverse ETF’s is the current play for the market. But analysis and trends are subject to change depending on price and volume action each week. Do not get your heart set on the BIG picture outlook of a yearlong selloff. That could prove to be dangerous. We take this market one bar or candlestick at a time and trade based on current short term analysis.
********
Get My Daily Video, Updates & Alerts Here: www.TheGoldAndOilGuy.com
Chris Vermeulen
Disclaimer:
This material should not be considered investment advice. Technical Traders Ltd. and its staff are not a registered investment advisors. Under no circumstances should any content from this website, articles, videos, seminars or emails from Technical Traders Ltd. or its affiliates be used or interpreted as a recommendation to buy or sell any type of security or commodity contract. Our advice is not tailored to the needs of any subscriber so go talk with your investment advisor before making trading decisions This information is for educational purposes only.

Chris Vermeulen has been involved in the markets since 1997 and is the founder of Technical Traders Ltd. He is an internationally recognized technical analyst, trader, and is the author of the book: 7 Steps to Win With Logic
Through years of research, trading and helping individual traders around the world. He learned that many traders have great trading ideas, but they lack one thing, they struggle to execute trades in a systematic way for consistent results. Chris helps educate traders with a three-hour video course that can change your trading results for the better.
His mission is to help his clients boost their trading performance while reducing market exposure and portfolio volatility.
He is a regular speaker on HoweStreet.com, and the FinancialSurvivorNetwork radio shows. Chris was also featured on the cover of AmalgaTrader Magazine, and contributes articles to several financial hubs like MoneyShow.com.


