Long-Term Patterns In Stocks, Gold And Crude Oil


The MONTHLY S&P500 Index
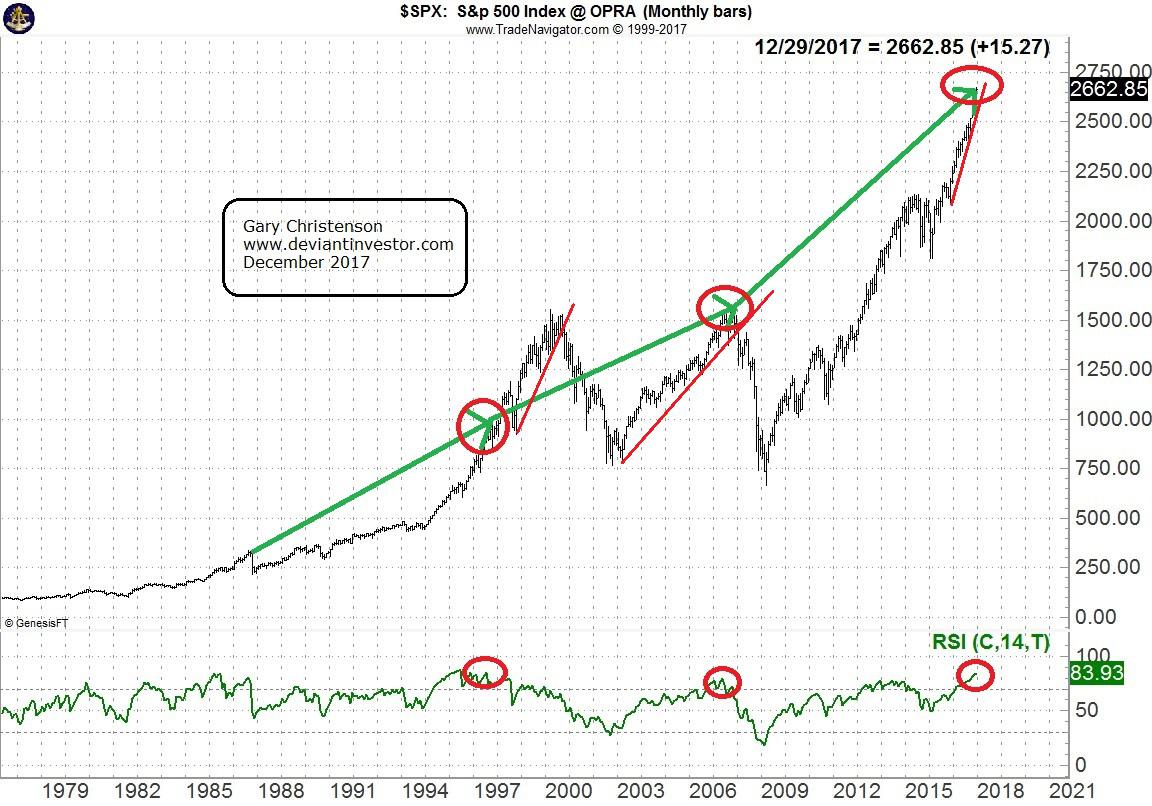
The green arrows are 10 years long. Peaks indicated are in 1987, 2007 and potentially 2017.
The pause in 1997 was not a top because the market rally extended into early 2000. The current peak in 2017 could also extend, but valuation and timing indicators show high risk.
When the monthly RSI (timing indicator at bottom of graph) exceeds 70, turns down, and prices fall below the red support line, a significant correction or crash is possible. Those crashes occurred in 1987, 2000, and 2008. The S&P is ready to make a similar correction or crash in 2017 or 2018. The RSI has reached its highest level in two decades.
The S&P 500 Index, DOW, NASDAQ, DAX and many other indices are excessively high, thanks to central bank “stimulus” and QE policies. The monthly chart of the S&P shows S&P prices are in a high risk danger zone.
Possible tops have occurred before, but instead of crashing, the market sometimes zoomed higher. Do you own due diligence.
Also, read “Hindenburg Omen Meets Titanic Syndrome.” However, if you want to believe the S&P is going higher, read “Stock Market Crash … Another Lie”
The Gold Market And Its 10-year Pattern
The gold market has an approximate 10-year low to high pattern.
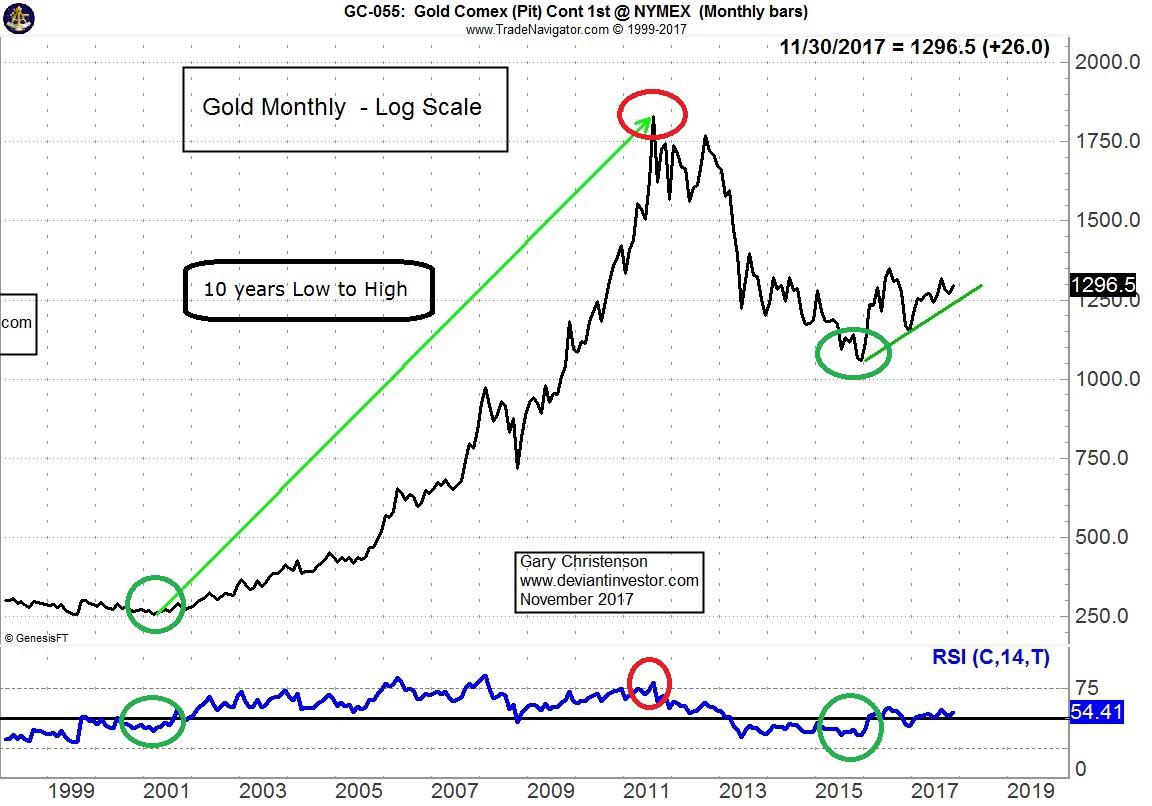
Gold: 2001 – 2011
The dashed green arrow shows that gold bottomed in April 2001 and peaked in August 2011, ten years later. Gold prices bottomed in late 2015 and could rally for many years.
Gold: 1970–1980 And 1982–1993
Gold sold for about $35 per ounce in 1970, although the market was controlled. In January 1980, ten years later, it sold for over $850. Gold prices crashed to a low in June 1982 and eleven years later they peaked in August 1993.
A ten year low to high pattern, beginning with the late 2015 low in gold prices, suggests a gold price high during the middle of the next decade.
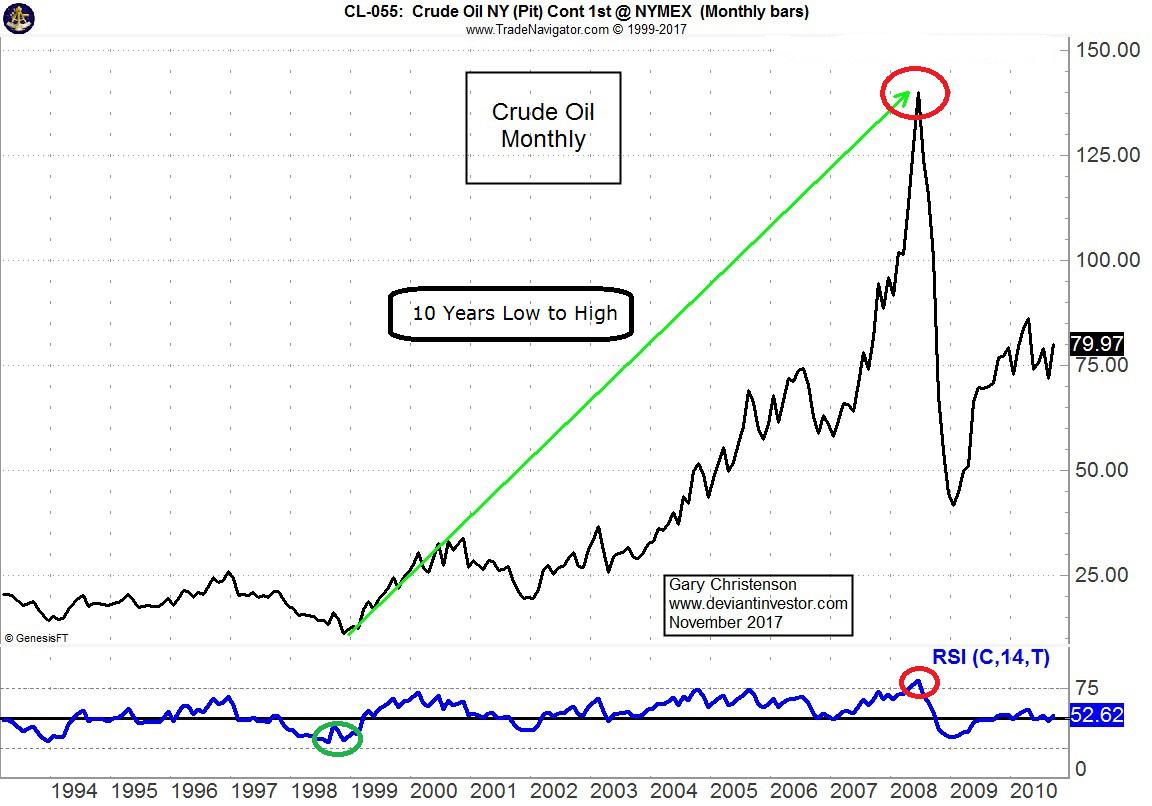
The Crude Oil Market 1998–2008
Crude oil prices bottomed in 1998 at under $11.00 and rose to nearly $150 per barrel in 2008, ten years later.
The Silver Market – Same 10-Year Pattern As Gold
Silver prices have a 10-year low to high pattern similar to gold.
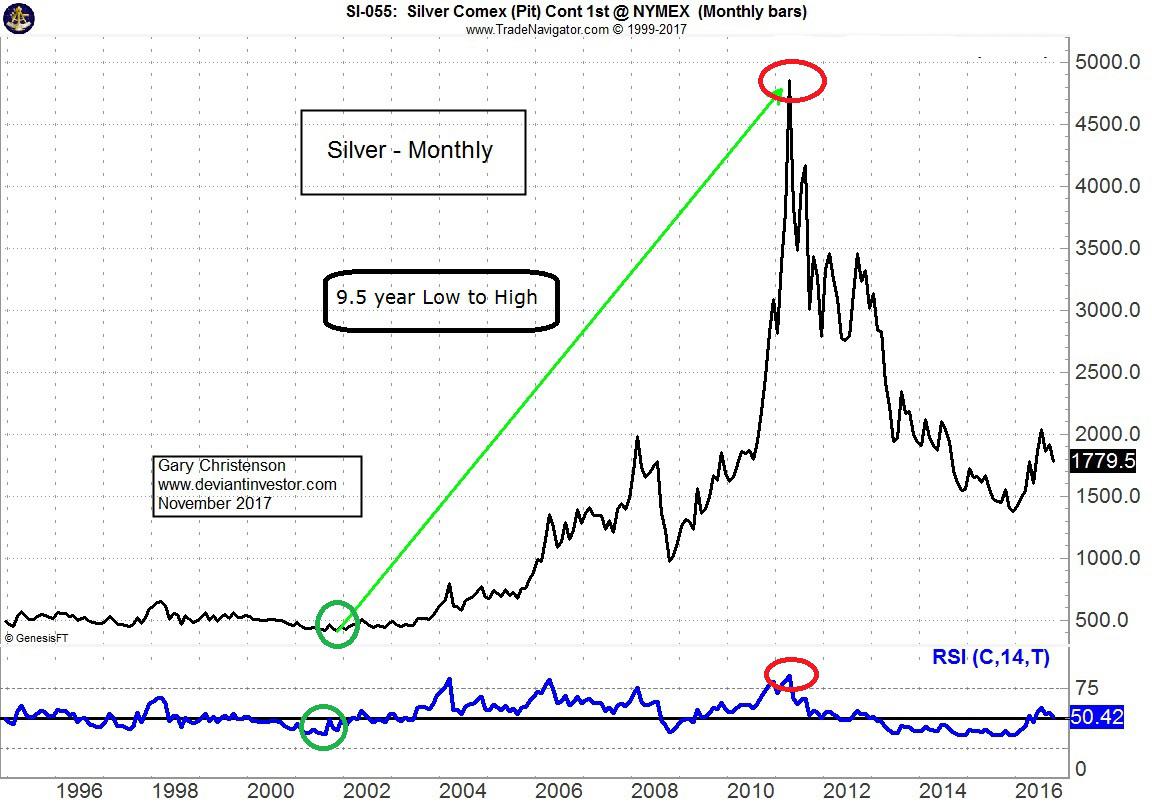
Silver prices bottomed in November 2001 and rallied from $4.01 to over $48 in April 2011, about 9.5 years. Silver prices bottomed again in December 2015. A nine to ten year low to high pattern suggests a high well into the next decade.
Given the exponential increases in global debt and increasing consumer prices, the coming silver and gold highs could be many times larger than today’s relatively inexpensive prices of about $1,250 for gold and $16.00 for silver.
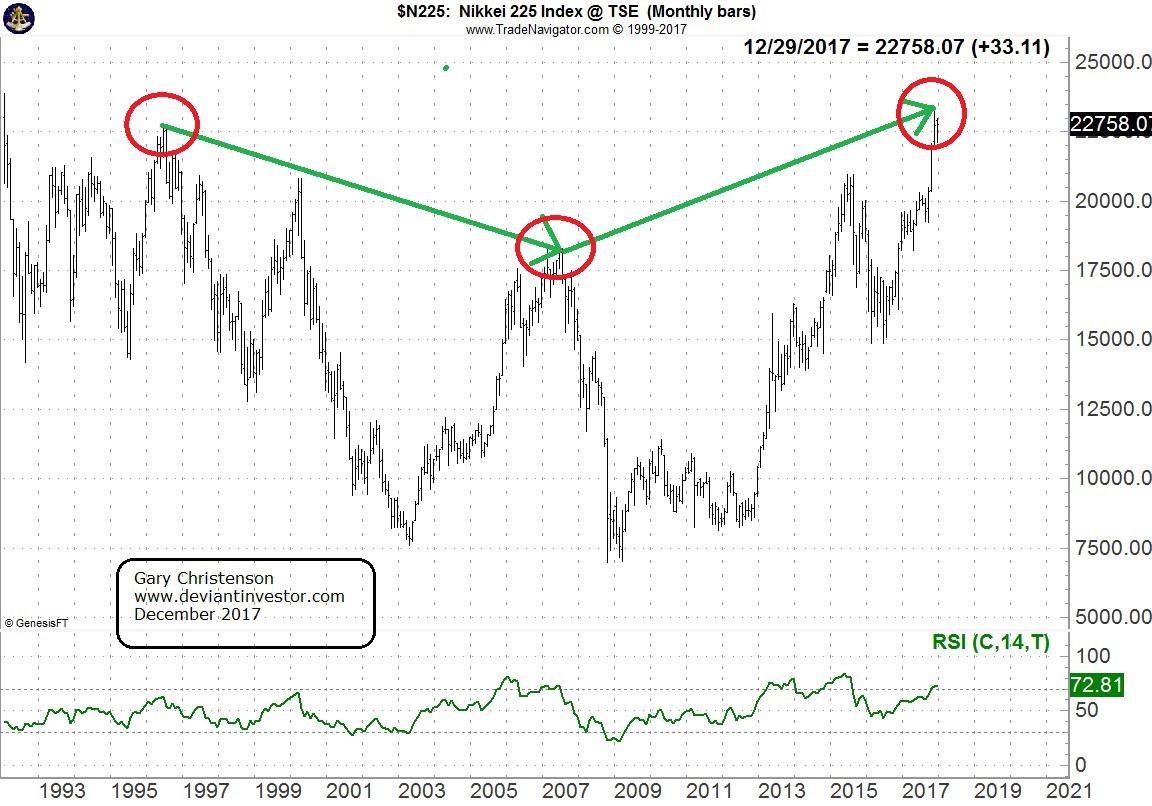
The Nikkei 225 Index
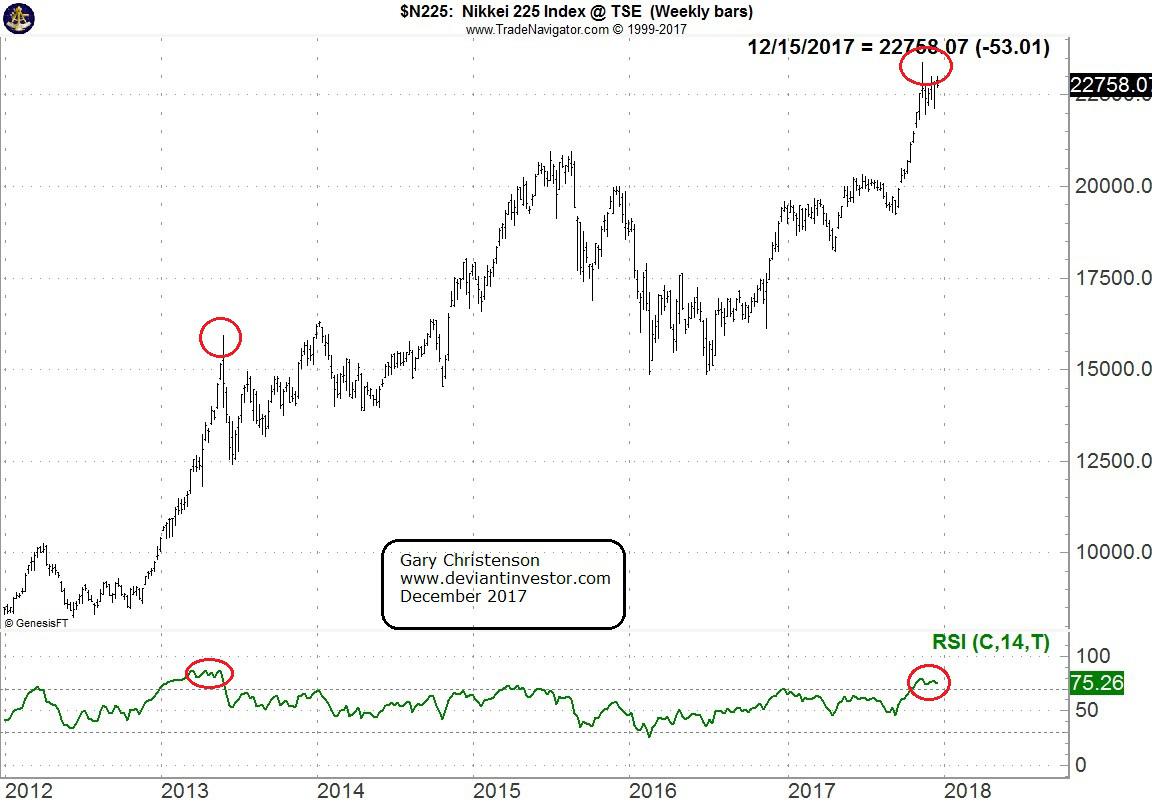
The Japanese Nikkei 225 Index shows a pattern similar to the S&P500 and DOW Index. The Nikkei peaked in mid-2007 and has rallied, in part due to purchases by the Japanese Central Bank, into late 2017. We shall see if 2017 is a lasting high. The weekly chart (shown below) indicates a possible rollover in prices and RSI.
Total Debt Securities
The St. Louis Federal Reserve publishes data for total debt securities in the United States. In 1971 President Nixon severed the last connection between gold and the U.S. dollar, which encouraged expansion of currency in circulation, debt, and continual devaluation of the dollar.
Date Total Debt Securities In $millions
1971 772,728
1981 2,224583
1991 7,902,302
2001 16,767,365
2011 33,868,046
2017 41,800,000
2021 52,771,000 (assuming continued exponential growth
2031 94,505,000 of 6.0% per year, the compounded rate
2041 $169,245,000 for the last 20 years)
The pattern for total debt is simple: up, Up and UP. This makes the pattern for the dollar’s purchasing power equally obvious: down, Down and DOWN.
SO WHAT?
-
Dollar devaluation is central bank and governmental policy. Expect it to continue.
-
To preserve purchasing power, your income, savings and retirement must grow more rapidly than the dollar is devalued.
-
The stock markets (DOW, S&P500, NASDAQ, DAX etc.) have increased in price since 1982, 2002 and early 2009.
-
Gold and silver have increased in price since 1971, 1991, 2001 and late 2015.
-
Buy low, sell high! Buying gold and silver in January 1980 and April 2011 was unfortunate timing.
-
Buying the US stock market in early 2000 and mid-2007 was unfortunate timing. We may look back from future years and compare 2017 to 2007.
-
The stock market indices, as of late December 2017, are expensive and ripe for a correction. Today is a high risk time to purchase most stocks.
-
Central banks have levitated stock markets since 2009 via the injection of trillions of digital currency units in addition to outright purchases of stocks and ETFs. But central banks are not all-powerful. If they were, the market disasters in 2000 and 2008 would have been prevented. More crashes will occur.
CONCLUSIONS
-
Dollar devaluation is central bank and government policy. It will continue.
-
Stock markets have been levitated by central bank “stimulus” and “printing.” Most stocks are now dangerously high, whether measured by fundamentals or technical timing indicators.
-
Stock markets MAY have already turned lower as indicated by the daily and weekly charts. The monthly charts say, “Look out below!”
-
Gold and silver prices are currently inexpensive and will rise substantially as dollar devaluation continues. Fear and panic from stock and bond sell-offs will also push gold and silver prices much higher.
-
Take advantage of current low metals prices by purchasing silver, platinum and gold.
Gary Christenson
The Deviant Investor
 Gary Christenson is the owner and writer for the popular and contrarian investment site Deviant Investor and the author of the book, “Gold Value and Gold Prices 1971 – 2021.” He is a retired accountant and business manager with 30 years of experience studying markets, investing, and trading. He writes about investing, gold, silver, the economy and central banking.
More from Gold-Eagle


