A Macro/Macro View: Waves And Cycles (Part II)


Last week, I mainly discussed the coming economic crash and where we are in the cycles. I also talked about the short-term stock market cycles, which I believe have peaked as of Friday or will peak on Monday. In this segment, I will mainly talk about my short-term work.
Due to the fact that the waves no longer move up in 5 wave sequences anymore, and the normal cycles are changing rapidly, I have had to augment my wave work with other data including astro-cycles and more technical data. This has forced me to buy other timing experts’ work to meld with my own so I can hone my timing skills better.
Ideally, the 16 TD top was to occur on the stock market on the 21st. We also have some astro signatures suggesting a top between Friday and this Monday. The daily MACD is diverging badly from the last 16 TD top suggesting that this wave up since September 7 is a Y (irregular on the SPX) or B wave top (failing on the NASDAQ). This, along with other data like Fibonnaci support, the dollar index and past cycles and wave structures lead me to believe we should fall about 5% into around October 8 with a target near SPX 2792.
Meanwhile, the dollar should rally. GDX topped on its 16 TD top Thursday last week and we got out for a nice profit on NUGT. Our call for a low on Wednesday was met mainly with the NASDAQ, which powered higher into Friday. The actual 8 TD low came two days earlier as it did the 16 TD cycle before.
The overall Cycle/Wave pattern calls for a move up to around 3016 SPX by around Nov 1, or about a 7 ½ % move up from the October low. What comes next may surprise a lot of people. We are calling for a move down to near 2667 by or around Nov 15. The week of the US mid-term election may become the catalyst point or secondary (b wave) top that sends the market into a (c wave) tailspin. Could it be that the Democrats control the House again? We shall soon see.
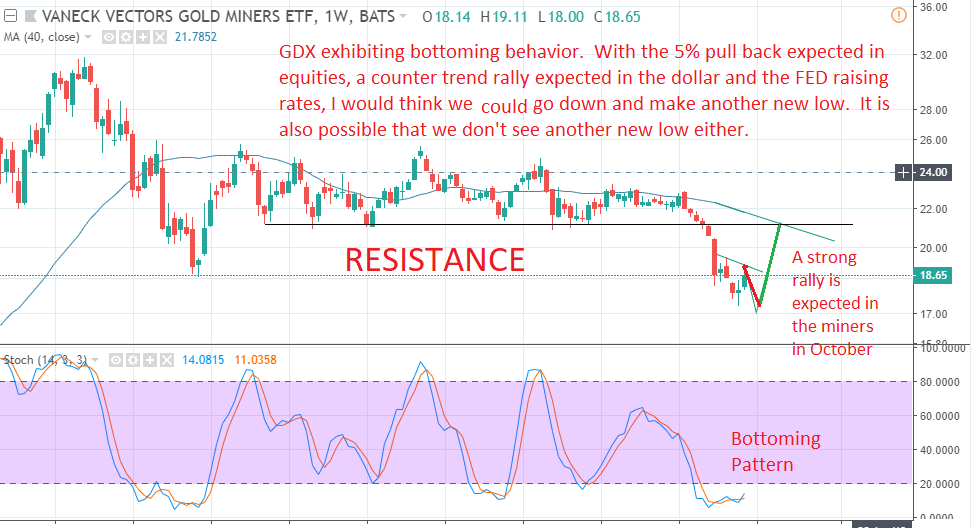
As far as the precious metals and mining stocks are concerned, with what I see: dollar strength ahead and a falling stock market into October 8th +/-, I would think we either pull back to a secondary low or possibly form a new low around Oct 4-8 on GDX. There is a case for a head and shoulders bottom forming, giving us a nice target of around 21.50 on GDX by the end of October. NUGT buyers on this coming dip should make some nice coin on the coming rally, (at least that is my opinion). As far as anything beyond that, it remains to be seen. I have been negative on the precious metals for quite some time.
As far as I can see, we are in a technical precious metals bear market and have been since 2011. My work suggests we have a ways to go before it bottoms in any meaningful way (other than perhaps another fierce short covering rally like we had in 2016). My thinking it won’t happen (THE bottom) until the 7-8 year cycle bottoms no earlier than late 2022.
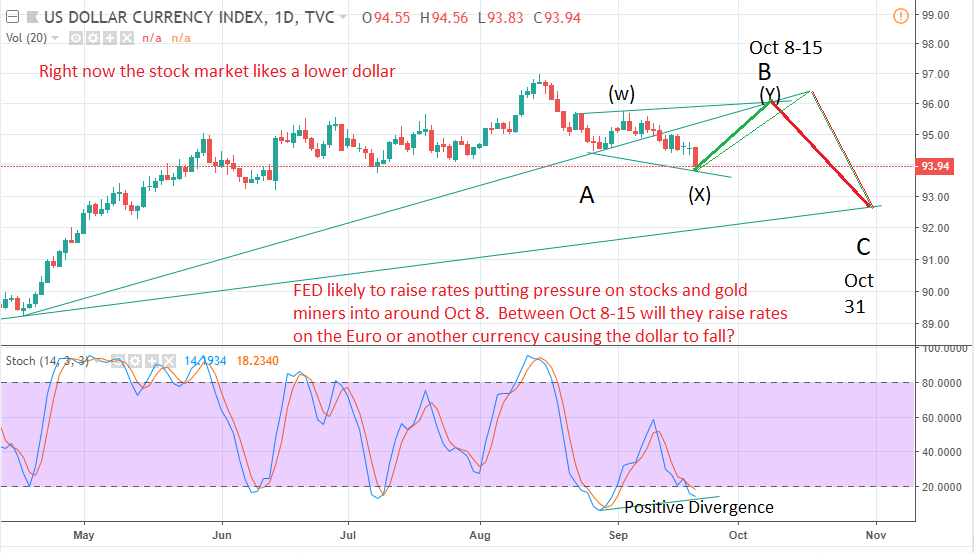
The dollar should drop again beginning around Oct 8th or so into late October completing an abc drop. This should be the catalyst for both a fierce mining share rally and stock market rally in October. I don’t know what the catalyst for that would be, but it could be a foreign central bank raises their interest rates a couple of weeks after the FED does their magic. We’ll see, some interesting times ahead.
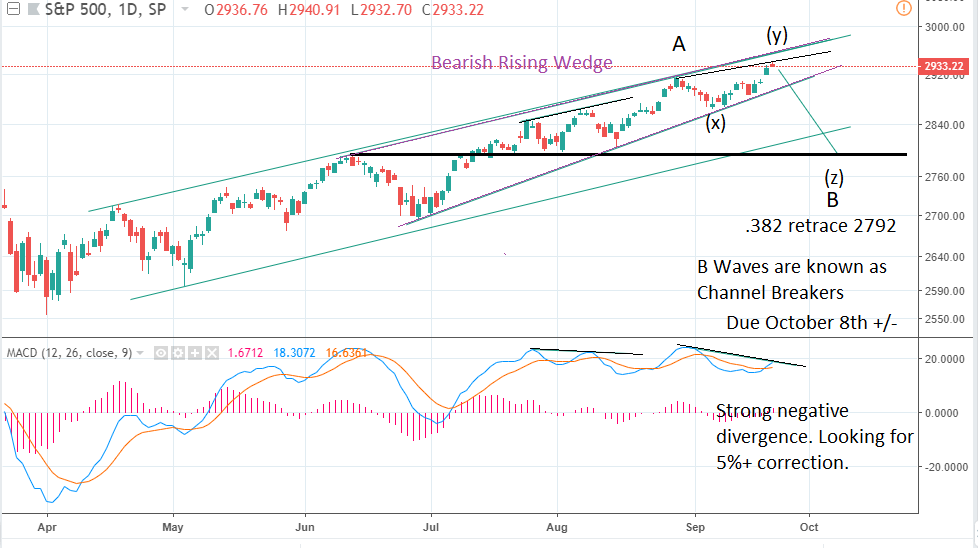
The chart below shows that we are in a bearish rising wedge. Notice also the glaring negative divergence on the daily MACD. The .382 retracement figure of 2792 is the ideal target for the bottom and fits for my projection to 3016 SPX by Nov 1.
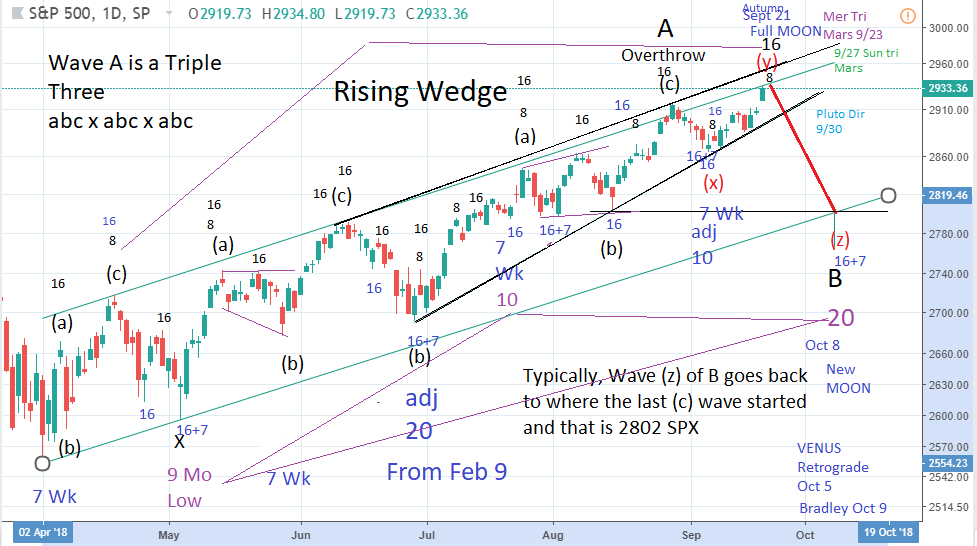
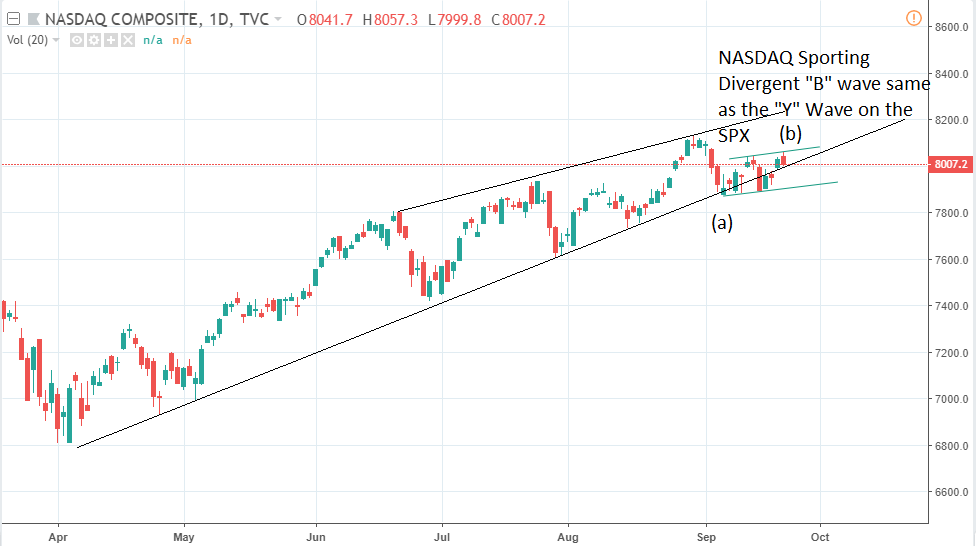
We have also finished a Triple Three pattern A Wave since April 2 (next chart), which suggests we see a B Wave decline. B Waves and 4th waves are known as channel breakers so the charts below figure. We also have the negative B Wave top NASDAQ market that did not make new highs. It has been the leader for quite some time, so watch out!
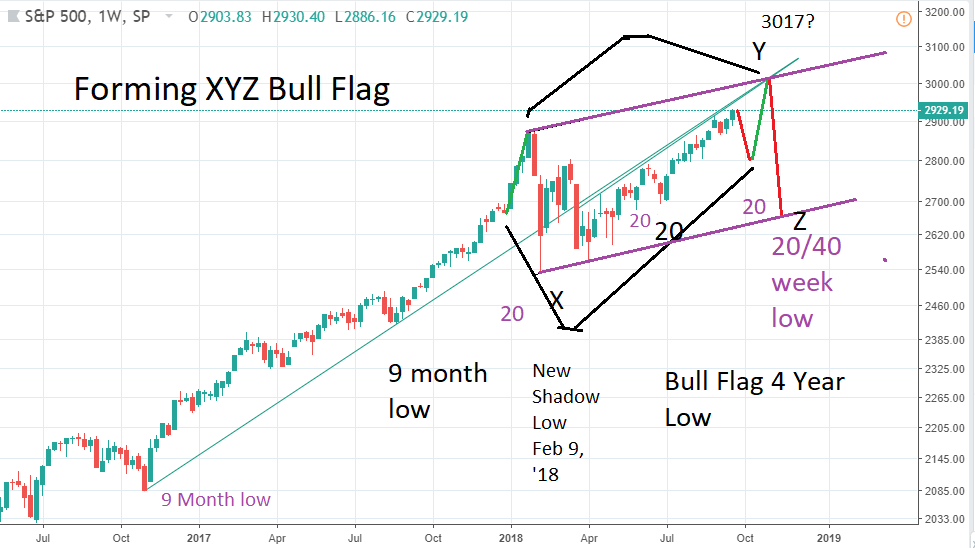
In Elliott terms, the XYZ pattern irregular flat like this is a very bullish pattern and in this instance launches Wave C into early Nov. +/-, topping WAVE Y of a larger bull flag pattern as seen below.
Below, we see the expected GDX rally target up against some serious resistance near 21.50. Also, we see the ABC decline in the dollar with B sporting the typical “wxy” bear flag.
An important note: I’m no longer taking anymore clients at BluStar Market Timer. If you are interested in getting my ETF trading signals, you can sign up at http://eaglesoveramerica.com for a much reduced price. I’m trying to help as many people as I can get ready for the Great Reset of 2020-2023.
*********


