Major Catalysts Building for Gold


Although precious metals have rebounded, some consternation remains that they could be headed much lower before a major bottom.
However, when one considers the fundamental backdrop, one will realize that a major turn is soon at hand.
At the end of September, the S&P 500 closed below its 40-month moving average. Over the past 40 years, the S&P 500 has closed below this line only twice (excluding Covid).
As we’ve written and mentioned in video commentaries, a close below the 40-month moving average following a lengthy uptrend signals the start of a new secular bear market.
The vertical lines on the weekly chart below mark when the S&P 500 closed below its 40-month moving average and a secular bear market began.
As it pertains to Gold, this is extremely important because it marks the start of secular bull markets in Gold.
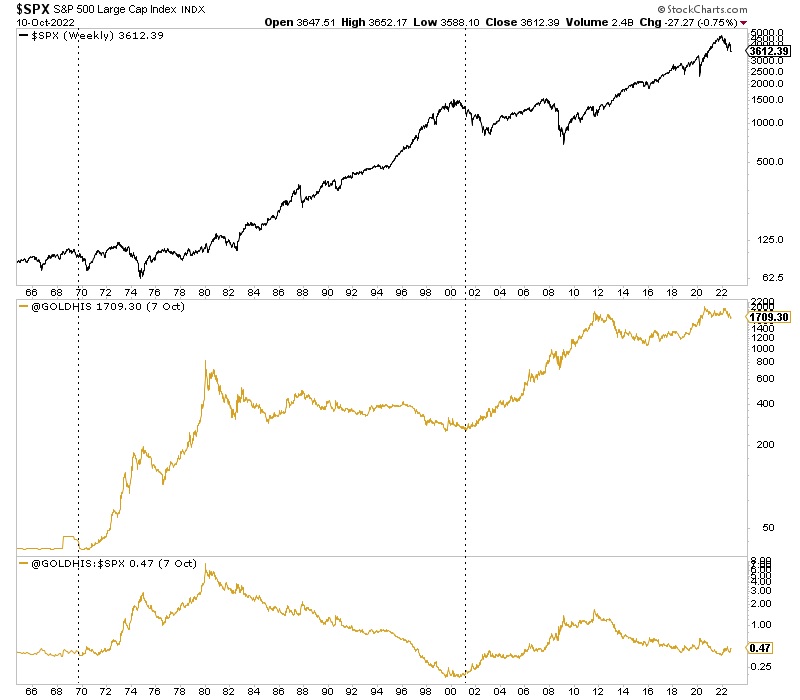
Gold and gold stocks began to outperform the stock market several weeks ago when the S&P 500 lost its 40-month moving average.
Consider that a mini-catalyst.
The first real catalyst is obvious. That’s when the Fed stops hiking rates.
Regardless of Fed rhetoric, the market will determine when the Fed needs to stop hiking rates. As late as October 2021, the Fed was not planning on hiking rates until 2023!
Suppose the trend in the stock market, economic data, the increasing risk of something in the financial system breaking, and the sudden weakening in the labor market all continue. In that case, it is absurd to think they will hike beyond December.
Furthermore, it’s equally absurd to think they will be able to pause until 2024.
History shows that rate cuts are coming and that during inflationary eras, rate cuts come faster than you think.
In the last nine Fed rate hike cycles, the average and median time from the last rate hike to the first cut was five months. However, from 1966 to 1989, which was mostly an inflationary period, the time between the last rate hike to the first cut in four of the five Fed cycles was only one to two months.
The Fed easing policy is the second major catalyst.
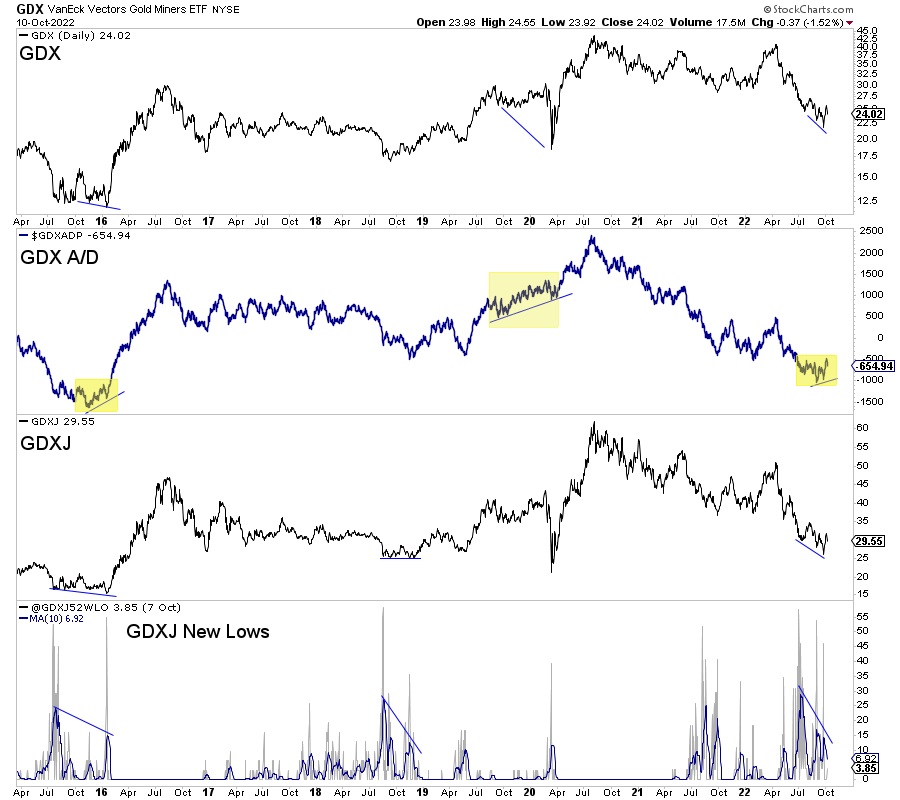
Circling back to the present, I want to note the positive technical developments in the gold stocks. They are showing important positive divergences.
The chart below shows that the GDX advance decline line has made its third positive divergence since 2015. The advance-decline line is one of the best technical leading indicators.
We also plot GDXJ and the number of new 52-week lows, smoothed with a 10-day moving average. The recent divergence is in line with the divergences at the 2018 and 2016 lows.
These catalysts are imminent from a medium to intermediate-term standpoint but not imminent with respect to the short term.
The Fed could remain tight for a short while longer, and another leg lower in the equity market (which could put a bit of downward pressure on precious metals) may be necessary for the Fed to shift course officially.
That being said, when we consider the secular trend change soon to transpire, any more weakness will lead to one of the best buying opportunities.
********

Jordan Roy-Byrne, CMT is a Chartered Market Technician and member of the Market Technicians Association. He is the publisher and editor of TheDailyGold Premium, a publication which emphasizes market timing and stock selection, as well as TheDailyGold Global, an add-on service for subscribers which covers global capital markets. He is also the author of the 2015 book, The Coming Renewal of Gold’s Secular Bull Market which is available for free. TheDailyGold.com was recently named one of the top 50 Investment Blogs by DailyReckoning and WalletHub.
More from Gold-Eagle


