Major Markets Analysis


GOLD
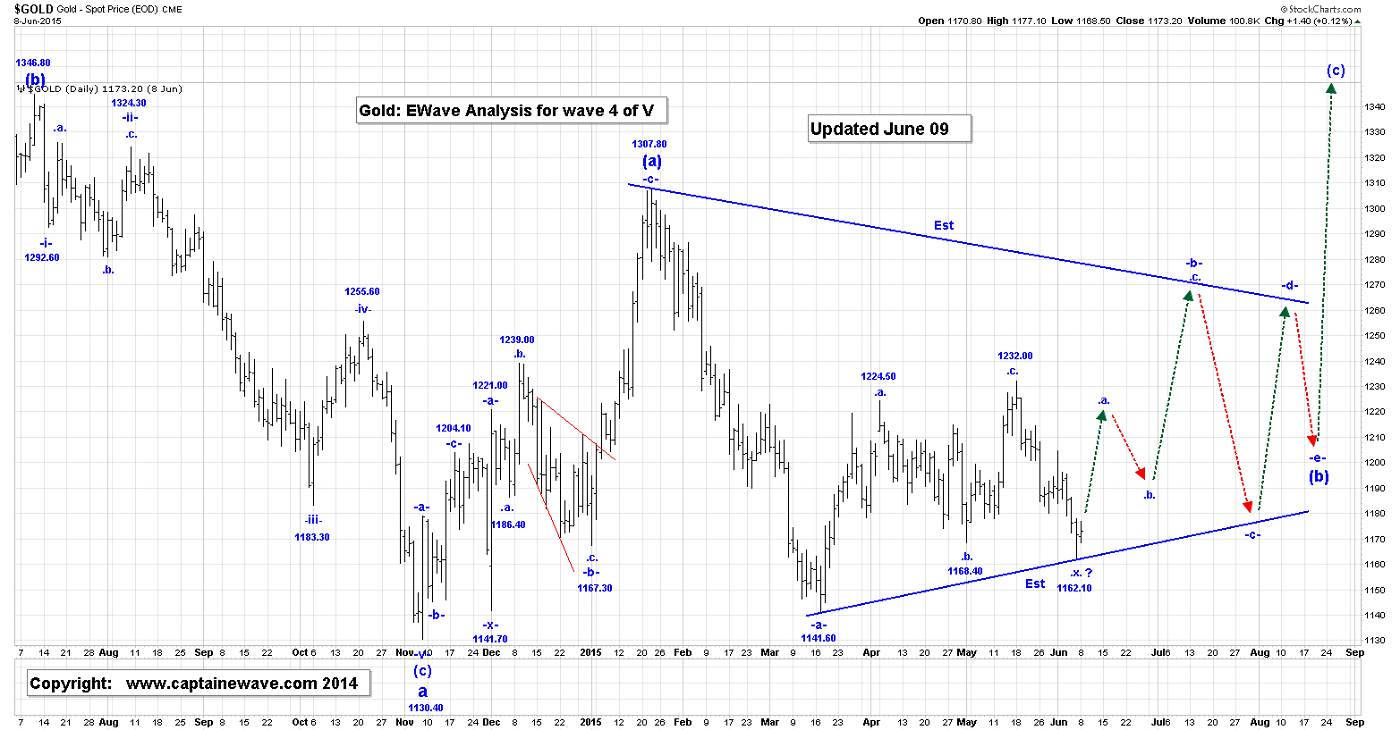
See the attached Daily Gold Compressed Wave (b) Chart:
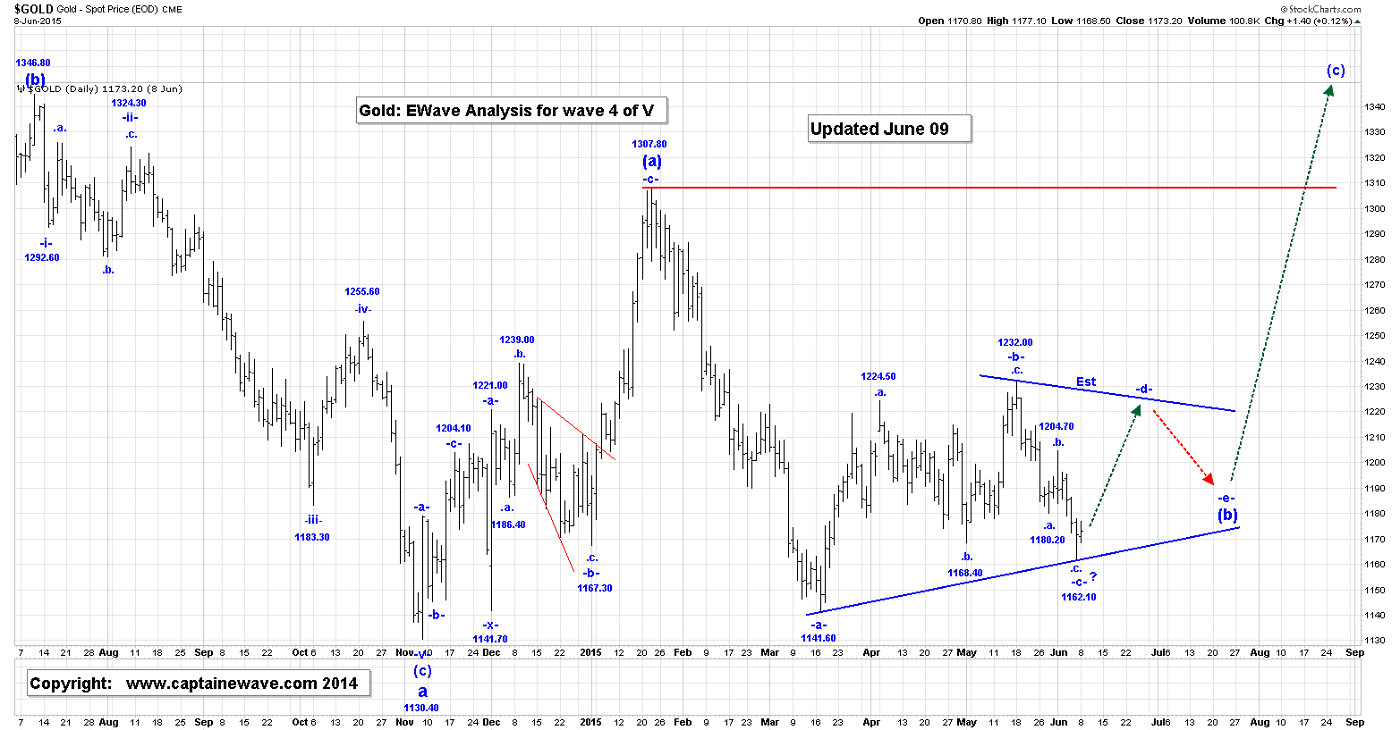
Gold was up smartly in the overnight session, reaching 1182.50, at the time that this Post was being written. We are working on the assumption that that we are now rallying in wave -d- of our compressed wave (b) Option 1. Wave -c- of this Option ended at last Friday’s low of 1162.20.
Since we are within the legs of a triangle we know that each leg must consist of at least one .a., .b., c. pattern, but could have up to three. It is difficult to know what form this pattern will take, but for the time being we will assume that wave .a. of -d- is going to be an impulsive sequence. So within wave .a. we could have:
^i^ = 1177.00;
^ii^ = 1168.90;
^iii^ rally is now with the following projections:
^iii^=^i^ = 1183.70;
^iii^ =1.618^i^ = 1192.80
For our compressed wave (b) option to remain valid, wave -d- cannot rally above the wave -b- high of 1232.00.
Note: Some Subscribers have asked us whether the drop from 1232.00 to 1162.20 could become a five-wave affair.
The answer is no, as the current rally has now overlapped with the 1180.20 low.
This drop from 1232.00 to 1162.20 is now confirmed to be a 3 wave drop, which is bullish. We will repeat our current Options one more time, for new Subscribers:
Option 1(Compressed Wave (b)):
-a- = 1141.60;
-b- = 1232.00;
-c- = 1162.20, if complete;
-d- rally should be starting now;
-e- to go.
In this Option we should now be rallying in wave -d-. Wave -d- will consist of at least one .a., .b. .c. pattern, but can have up to three, and wave .b. could be triangle. This Option will likely take a couple of months to complete.
Option 2: (Standard Wave (b)):
-a- = 1141.60;
-b-:
.a. = 1224.50;
.b. = 1168.40;
.c. = 1232.00;
.x. = 1162.20;
In this case we should now be starting our second .a, .b. ,.c. pattern within wave -b- only.
This Option will likely that 6 plus months to complete.
Our preferred is Option 1, as this would line up with our thinking in regards to the HUI/GDX.
No change to our current 17 long positions, risking to 1141.50.
CRUDE
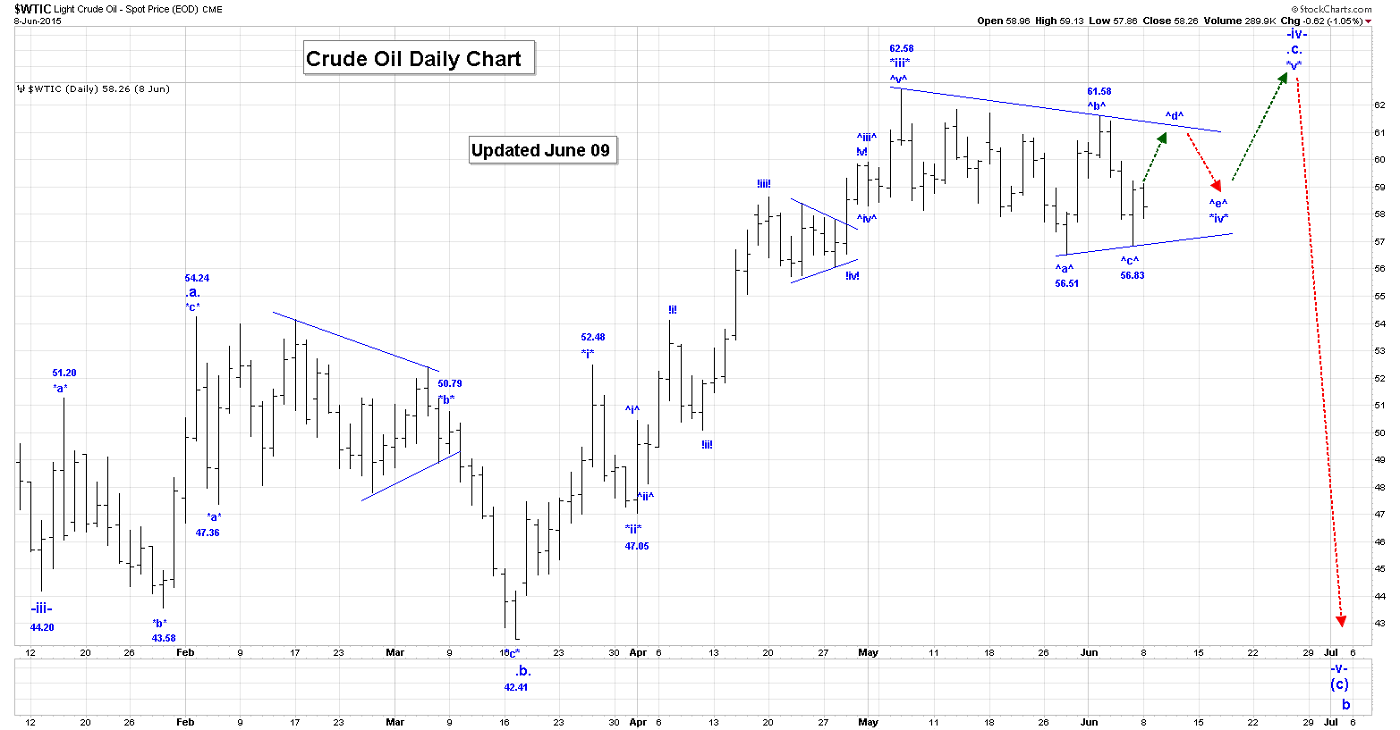
We are working on the assumption that wave *iv* in crude is a triangle, as follows:
^a^ = 56.52;
^b^ = 61.58;
^c^ = 56.86;
^d^ rally is now underway;
^e^ to go.
For this triangle Option to remain valid we cannot drop below the wave ^a^ low of 56.52.
In the overnight session, crude was stable, but on the Intraday Chart, the wave pattern from the 59.22 high to the 58.43 low look corrective. Crude should move higher.
We are long 8 positions with 58.00 puts.
S&P500
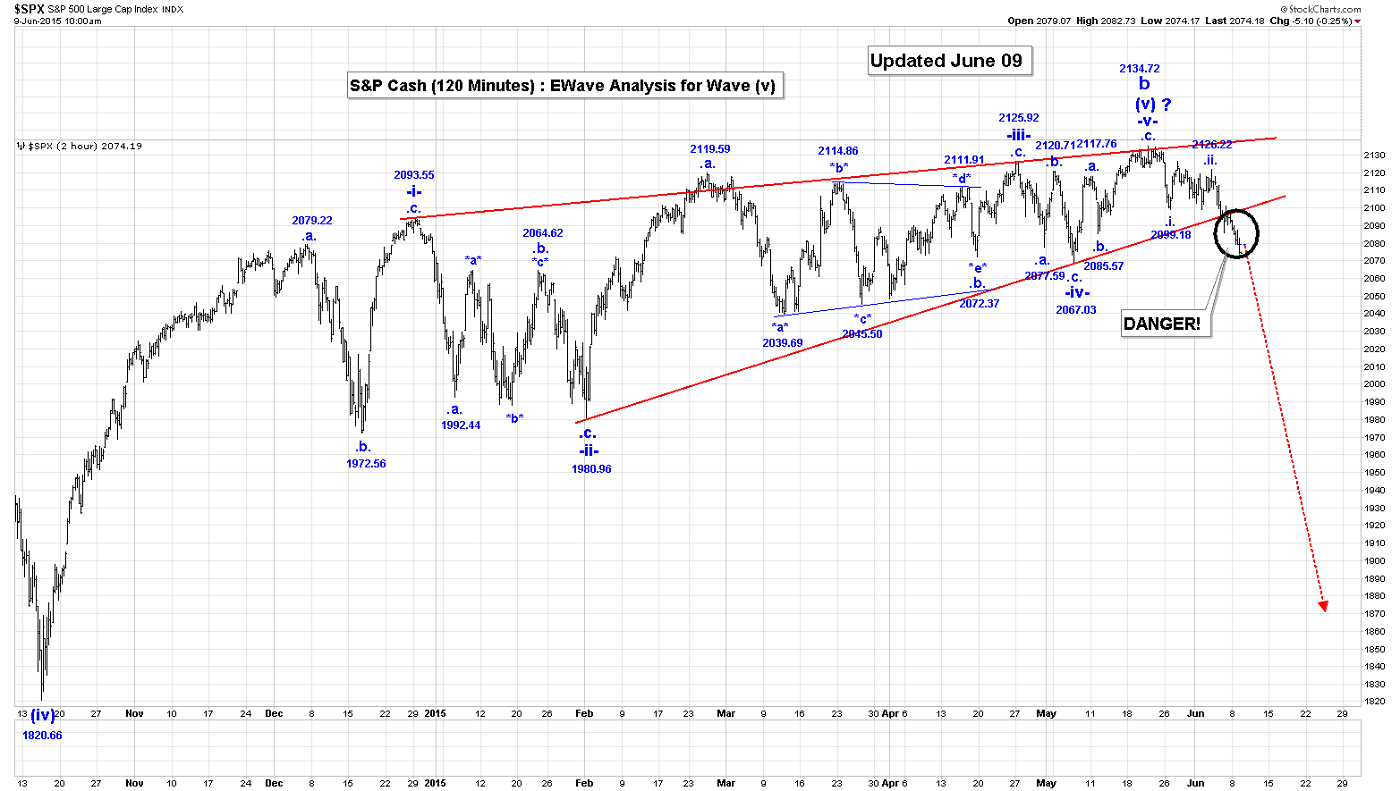
The S&P is now at the cross roads as we are clinging to the lower red redline of our ending diagonal triangle. In the overnight session, the S&P did not accomplish very much.
As you can see on the attached 120 Min S&P Chart, this market is trying to stay above the lower red trend line of our ending diagonal triangle.
We are already short this market , and would be very happy to see this support line break, but you can also see on the above 120 Min Chart that the trading patterns between our second wave .a. and second wave .b. are full of overlapping waves.
This action is bullish, unless some sort of failure analysis is used, which we do not want to consider that this time.
Based on what we see, we are still expecting a rally in our second wave .c. to at least reach the 2134.72 high. A significant break of the lower red redline would likely suggest that something else is going on, and that a major top is in!
We are short 3 S&P500 positions at 2115, with 2125 calls and will add 5 more short positions at 2065.
USDX
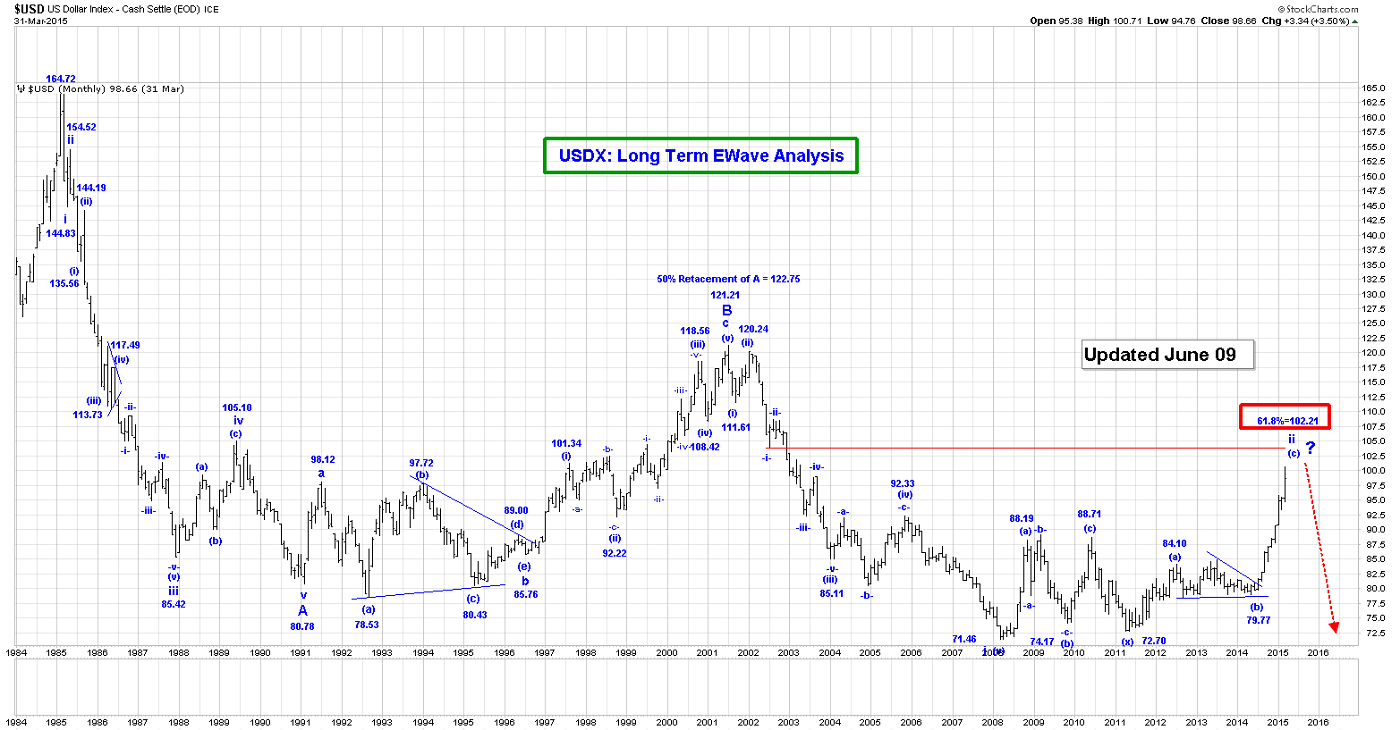
The USDX was lower in the overnight session reaching 95.98, at the time that this Post was being written.
We believe that our second wave *b*, ended at 96.95.
Our current wave -iv- count looks like:
*a* = 94.88;
*b* = 100.27;
*c* = 93.16;
*x*:
^a^ = 95.94;
^b^ = 94.89;
^c^ = 97.87, to complete wave *x*;
*a* = 94.67;
*b* = 96.95, if complete;
*c* is now.
The minimum target for the second wave *c* is the bottom of the first wave *c* which is 93.16. Another projection is:
*c*=1.618*a* = 91.77
We are short 5 positions, risking to 97.88.
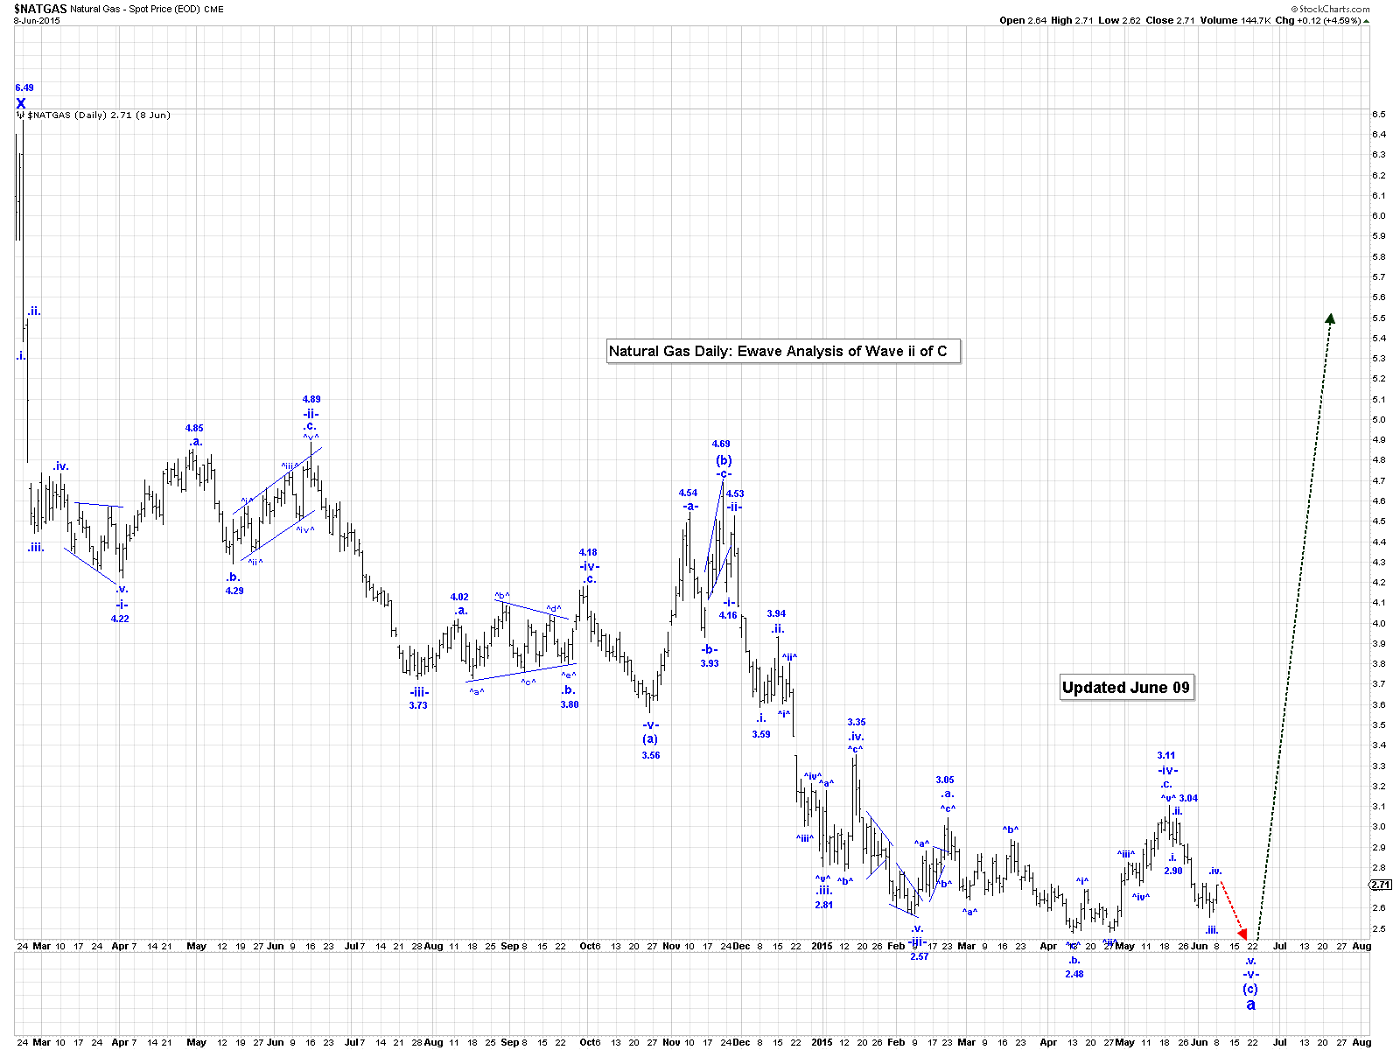
NATGAS
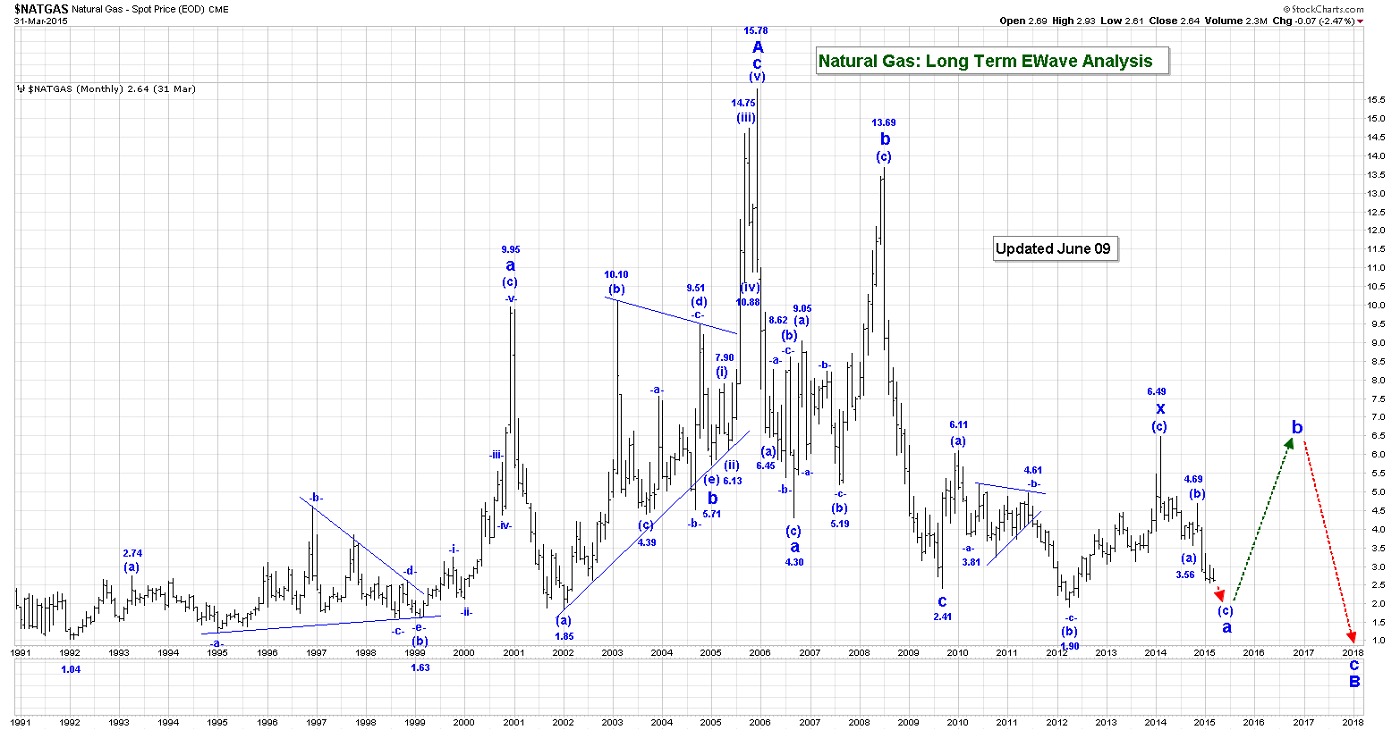
See the attached Daily NG Chart
Over the weekend we made a significant revision to the long term direction of NG.
AS you can see on the attached Long term NG Chart, we now believe that NG is ultimately going significantly lower, likely to the 1.30/1.50 area, perhaps over the next year or so.
It now appears that we are falling in our second a, b, c, pattern within B. We had previously thought that the 1.90 low was the end of wave B. So we expect that we are getting close to completing our second wave a, that started at the wave x high of 6.49.
The detailed count of our second wave a is shown on the attached Daily NG chart. We are likely now in the tail end of wave -v- and wave (c). Our minimum target for end of wave -v- is the wave -iii- low of 2.48.
Upon completion of our second wave a we should see NG rally all the way back to the 6.49 area. This is because our second wave a was a three wave drop. This means that our second wave b will either be a flat or irregular correction.
In the case of a flat, our second wave b will come very close to 6.49, and in the case of an irregular type correction it will exceed 6.49. We will trade the second wave b rally. It will consist of at least one (a), (b), (c) pattern, but could have up to three.
In the overnight session NG was higher reaching 2.65, at the time that this Post was being written. We are likely rallying in wave .iv. of -iv-, as can be seen on the attached Daily NG Chart.
HUI/GDX
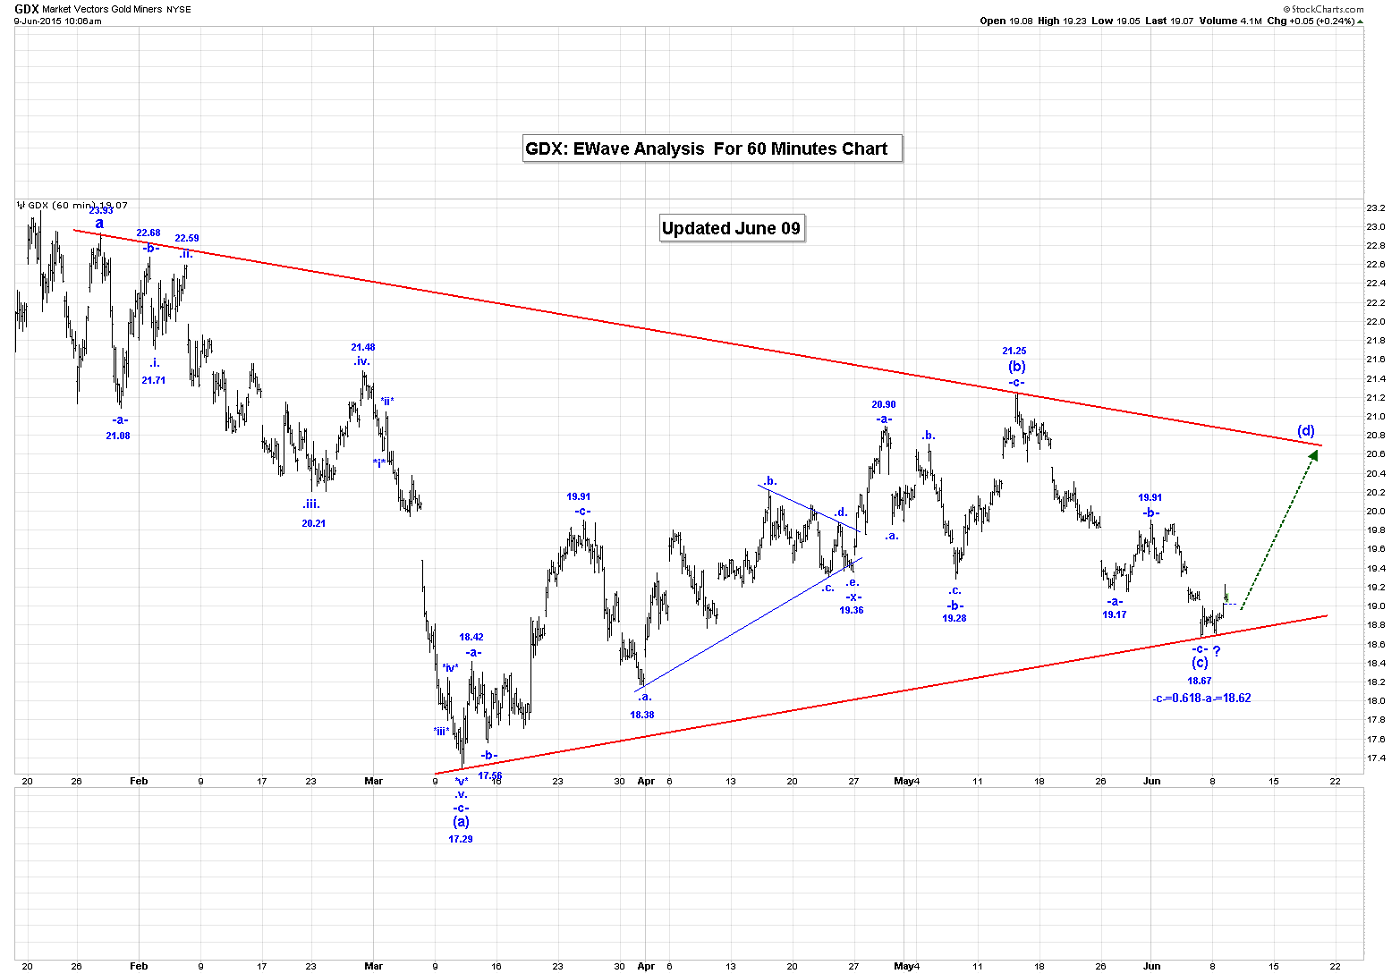
Note the -c-=0.618-a- projection of 18.62.
We are assuming that wave (c ) is now complete at 18.67, and that the next big event will be a nice rally in wave (d)!!
Long GDX, risking to 17.28!
********
Email: [email protected]
Website: www.captainewave.com
Risk: CAPTAINEWAVE.COM IS AN IMPERSONAL ADVISORY SERVICE. AND THEREFORE, NO CONSIDERATION CAN OR IS MADE TOWARD YOUR FINANCIAL CIRCUMSTANCES. ALL MATERIAL PRESENTED WITHIN CAPTAINEWAVE.COM IS NOT TO BE REGARDED AS INVESTMENT ADVICE, BUT FOR GENERAL INFORMATIONAL PURPOSES ONLY. TRADING STOCKS DOES INVOLVE RISK, SO CAUTION MUST ALWAYS BE UTILIZED. WE CANNOT GUARANTEE PROFITS OR FREEDOM FROM LOSS. YOU ASSUME THE ENTIRE COST AND RISK OF ANY TRADING YOU CHOOSE TO UNDERTAKE. YOU ALSO AGREE TO BEAR COMPLETE RESPONSIBILITY FOR YOUR INVESTMENT RESEARCH AND DECISIONS AND ACKNOWLEDGE THAT CAPTAINEWAVE.COM HAS NOT AND WILL NOT MAKE ANY SPECIFIC RECOMMENDATIONS OR GIVE ADVICE TO YOU OR ANY OF ITS CLIENTS UPON WHICH THEY SHOULD RELY. CAPTAINEWAVE.COM SUGGESTS THAT THE CLIENT/MEMBER TEST ALL INFORMATION AND TRADING METHODOLOGIES PROVIDED AT OUR SITE THROUGH PAPER TRADING OR SOME OTHER FORM OF TESTING. CAPTAINEWAVE.COM, ITS OWNERS, OR ITS REPRESENTATIVES ARE NOT REGISTERED AS SECURITIES BROKER-DEALERS OR INVESTMENT ADVISORS EITHER WITH THE U.S. SECURITIES AND EXCHANGE COMMISSION OR WITH ANY STATE SECURITIES REGULATORY AUTHORITY. WE RECOMMEND CONSULTING WITH A REGISTERED INVESTMENT ADVISOR, BROKER-DEALER, AND/OR FINANCIAL ADVISOR. IF YOU CHOOSE TO INVEST WITH OR WITHOUT SEEKING ADVICE FROM SUCH AN ADVISOR OR ENTITY, THEN ANY CONSEQUENCES RESULTING FROM YOUR INVESTMENTS ARE YOUR SOLE RESPONSIBILITY.
ALL INFORMATION POSTED IS BELIEVED TO COME FROM RELIABLE SOURCES. CAPTAINEWAVE.COM DOES NOT WARRANT THE ACCURACY, CORRECTNESS, OR COMPLETENESS OF INFORMATION AVAILABLE FROM ITS SERVICE AND THEREFORE WILL NOT BE LIABLE FOR ANY LOSS INCURRED. DUE TO THE ELECTRONIC NATURE OF THE INTERNET, THE CAPTAINEWAVE.COM WEBSITE, ITS E-MAIL & DISTRIBUTION SERVICES AND ANY OTHER SUCH "ALERTS" COULD FAIL AT ANY GIVEN TIME. CAPTAINEWAVE.COM WILL NOT BE RESPONSIBLE FOR UNAVAILABILITY OF USE OF ITS WEBSITE, NOR UNDELIVERED E-MAILS, OR "ALERTS" DUE TO INTERNET BANDWIDTH PROBLEMS, EQUIPMENT FAILURE, OR ACTS OF GOD. CAPTAINEWAVE.COM DOES NOT WARRANT THAT THE TRANSMISSION OF E-MAILS, OR ANY "ALERT" WILL BE UNINTERRUPTED OR ERROR-FREE. CAPTAINEWAVE.COM WILL NOT BE LIABLE FOR THE ACTS OR OMISSIONS OF ANY THIRD PARTY WITH REGARDS TO CAPTAINEWAVE.COM DELAY OR NON-DELIVERY OF THE CAPTAINEWAVE.COM NIGHTLY EMAILS OR "ALERTS". FURTHER, WE DO NOT RECEIVE ANY FORM OF PAYMENT OR OTHER COMPENSATION FOR PUBLISHING INFORMATION, NEWS, RESEARCH OR ANY OTHER MATERIAL CONCERNING ANY SECURITIES ON OUR SITE OR PUBLISH ANY INFORMATION ON OUR SITE THAT IS INTENDED TO AFFECT OR INFLUENCE THE VALUE OF SECURITIES.
THERE IS NO GUARANTEE PAST PERFORMANCE WILL BE INDICATIVE OF FUTURE RESULTS. NO ASSURANCE CAN BE GIVEN THAT THE RECOMMENDATIONS OF CAPTAINEWAVE.COM WILL BE PROFITABLE OR WILL NOT BE SUBJECT TO LOSSES. ALL CLIENTS SHOULD UNDERSTAND THAT THE RESULTS OF A PARTICULAR PERIOD WILL NOT NECESSARILY BE INDICATIVE OF RESULTS IN FUTURE PERIODS. THE RESULTS LISTED AT THIS WEBSITE ARE BASED ON HYPOTHETICAL TRADES. PLAINLY SPEAKING, THESE TRADES WERE NOT ACTUALLY EXECUTED. HYPOTHETICAL OR SIMULATED PERFORMANCE RESULTS HAVE CERTAIN INHERENT LIMITATIONS. UNLIKE AN ACTUAL PERFORMANCE RECORD, SIMULATED TRADES DO NOT REPRESENT ACTUAL TRADING. ALSO, SINCE THE TRADES HAVE NOT ACTUALLY BEEN EXECUTED, THE RESULTS MAY HAVE OVER OR UNDER COMPENSATED FOR THE IMPACT, IF ANY, OF CERTAIN MARKET FACTORS SUCH AS LACK OF LIQUIDITY. YOU MAY HAVE DONE BETTER OR WORSE THAN THE RESULTS PORTRAYED. NO REPRESENTATION IS BEING MADE THAT ANY ACCOUNT WILL OR IS LIKELY TO ACHIEVE PROFITS OR LOSSES SIMILAR TO THOSE SHOWN. NO INDEPENDENT PARTY HAS AUDITED THE HYPOTHETICAL PERFORMANCE CONTAINED AT THIS WEBSITE, NOR HAS ANY INDEPENDENT PARTY UNDERTAKEN TO CONFIRM THAT THEY REFLECT THE TRADING METHOD UNDER THE ASSUMPTIONS OR CONDITIONS SPECIFIED HEREAFTER. WHILE THE RESULTS PRESENTED AT THIS WEBSITE ARE BASED UPON CERTAIN ASSUMPTIONS BELIEVED TO REFLECT ACTUAL TRADING CONDITIONS, THESE ASSUMPTIONS MAY NOT INCLUDE ALL VARIABLES THAT WILL AFFECT, OR HAVE IN THE PAST AFFECTED, THE EXECUTION OF TRADES INDICATED BY CAPTAINEWAVE.COM. THE HYPOTHETICAL RESULTS ON THIS WEBSITE ARE BASED ON THE ASSUMPTION THAT THE CLIENT BUY AND SELLS THE POSITIONS AT THE OPEN PRICE OF THE STOCK. THE SIMULATION ASSUMES PURCHASE AND SALE PRICES BELIEVED TO BE ATTAINABLE. IN ACTUAL TRADING, PRICES RECEIVED MAY OR MAY NOT BE THE SAME AS THE ASSUMED ORDER PRICES.


