Market Comments
After this week, it's safe to say that the dead-cat bounce in the 2007-11 bear market is over. It ran from the March 2009's -53% bottom, until April 2011, when it climbed back to its BEV -10% line. In June and July, the bulls tried to get back above the April 2011 highs; both times they fell short of doing so by a mere 1%. Then in late July Mr Bear took this market down hard.
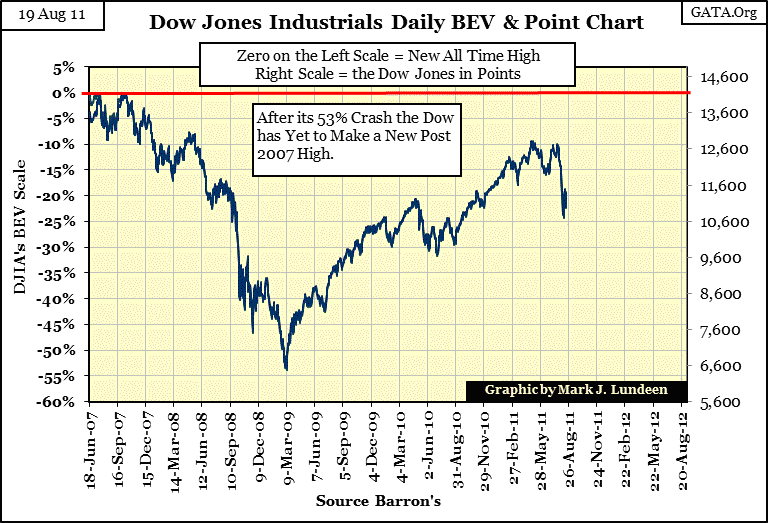
But in truth, the above chart doesn't really look all that bad. Bull markets are known for sharp corrections, and since July 26th, that's exactly what we see above. So the real question becomes, is this a buying opportunity for the bulls, or is Mr Bear finally making his BIG PUSH to take the market down below its March 2009 lows? I believe it's the latter for the following reasons.
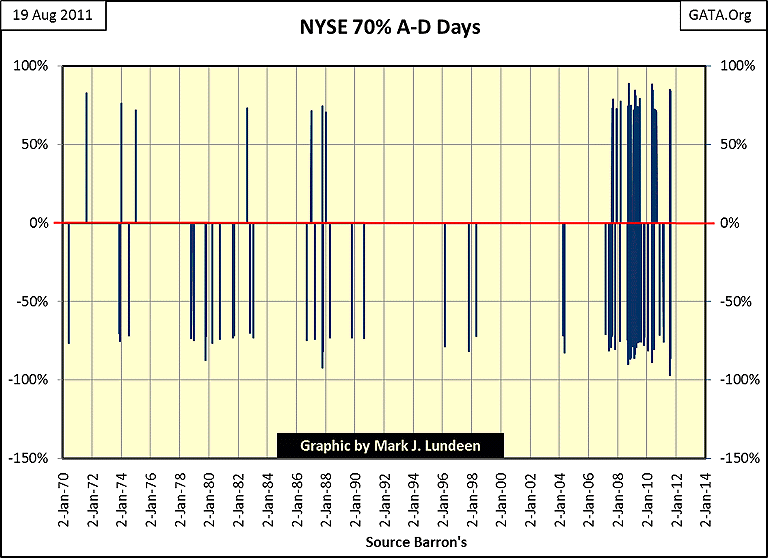
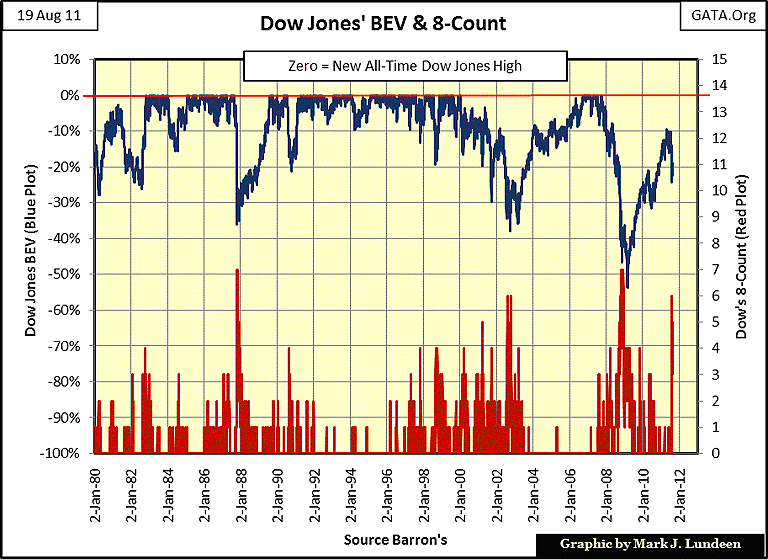
The Dow's 8-count is no source of comfort for the bulls either. On August 11th, it registered a 6. Since 1900, the Dow Jones has never once seen the volatility necessary to move the closing price 2% from the previous day six times in eight trading sessions during a bull market. (Up or down day are all the same to Mr Bear) But in bear markets, this happens all the time. Currently, the Dow's 8-count is at 3. It might go back down to zero, but if Mr Bear has reallyreturned to Wall Street, the Dow's 8-count will see 6 or better again, and then again before this is over.
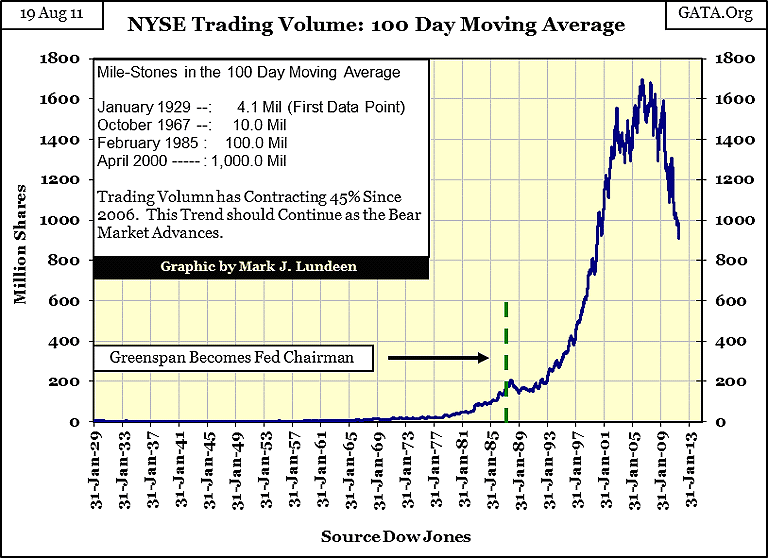
NYSE trading volume doesn't just stink, it's been in the Twilight Zone ever since the January 2000 market top; eleven years of weird volume.
Since 1900, bull markets have always seen trading volume at the NYSE increase significantly as the top approaches. This is logical, as everyone and their grandmothers are always piling into the stock market near the tops. But during bear markets, trading volume contracts with stock valuations. This also is logical as investors, one by one, close out their positions and go home to lick their wounds. But beginning in 2000, this well established pattern reversed itself, with volume contracting as the top in valuation approached, and expanding as the bottom neared.
This Bear's Eye View (BEV plot below) of NYSE trading volume doesn't do justice to the data, but we can still see how from the 1929 top, to 1942, volume contracted during the 20th century's worst period of market history. But from 1942, to 2000, there was only one -40% Dow Jones bear market (1973-74), so all in all, this 58 year period was a bullish period of market history. So it's not surprising to see volume trending up from 1942 to 2000. But in 2002 the Dow saw a 38% bear market bottom, and 2009 had the second worst bear market bottom since 1885. These were significant bear markets. Why didn't NYSE trading volume contract as it has historically during the 1973-74 -40% bear market and the Great Depression? In fact, during these two market bottoms, trading volume was robust!
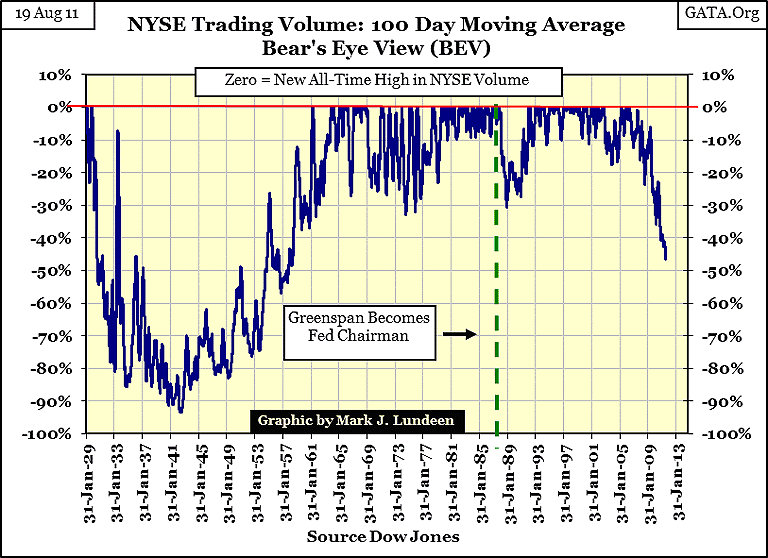
And what is really crazy about the chart above is the big waterfall decline we see at the end of the plot. It looks like the biggest decline in NYSE trading volume since the Great Depression bear market, because it is! But this huge 46% * decline * in volume took the Dow * up * over 6200 points, from 6547 up to 12,810. These trends in NYSE volume for the past 11 years go against human nature, the apparent need of 99% of all investors to lose their money by buying at the top and selling at the bottom!
It's like our fairy-godmother is entering the stock market to protect us from ourselves, by providing the market with "liquidity" when we need her the most, and leaving when things turn for the better. Who else could it be? She isn't motivated by making profits, or concerned with taking massive losses. She is also someone who thinks that a few trillions of dollars is no big thing. Who other than our fairy-godmother would be motivated only to moderate the market's up and down swings. Now mind you, I'm not saying our fairy-godmother is mucking around in the financial markets. I'm just saying that if she was, it would explain the stock market's trading volume & valuation patterns of the last eleven years.
The chart below shows the original data as published, used in the BEV chart above; same data, different view. One can't miss it: during the 2002 & 2009 bear market bottoms, volume didn't collapse as expected. The big collapse in trading volume actually occurred at the beginning of the March 2009's dead-cat bounce. Everything is backward, but still, trading volume is currently down 47% from its peak (see BEV chart above), and is showing no signs of turning around.
Well, collapsing trading volume didn't seem to matter when the stock market was going up (March 2009 to April 2011), but now the stock market is going down * with * trading volume. Are the "policy makers" going to pump a few trillions-of-dollars into the stock market, and support market valuation with rising volume as they did in 2000-02 & from 2007-09. Or are they exhausted, and unable to prevent the market from finding its own level in the months and years to come? Or is it possible that the "policy makers" have only temporarily quit supporting market valuations in order to lay the groundwork for QE3? Nothing like a financial panic on Wall Street to shut-down the nation's reasoning abilities, and make most people, in and out of congress, take whatever medicine Doctor Bernanke prescribes for the economy.
We are just going to have to wait to find out if volume for the third time since 2000, begins to stabilize, or even rise as the Dow declines.
The NYSE 52Wk H-L Ratio is horrible! When more stocks at the NYSE see new 52Wk lows than 52 Wk highs, it's a sure sign of "liquidity" draining from the market. It takes time for a stock to move from one 52Wk extreme to the other. When one thinks of it, 52Wk Highs and Lows are truly significant events for both individual shares, and for the overall market.
Look at the table below: since July 26, more shares at the NYSE have seen their 52Wk Lows than highs. It's no accident that July 26 marks the start of the steep decline in the Dow Jones.
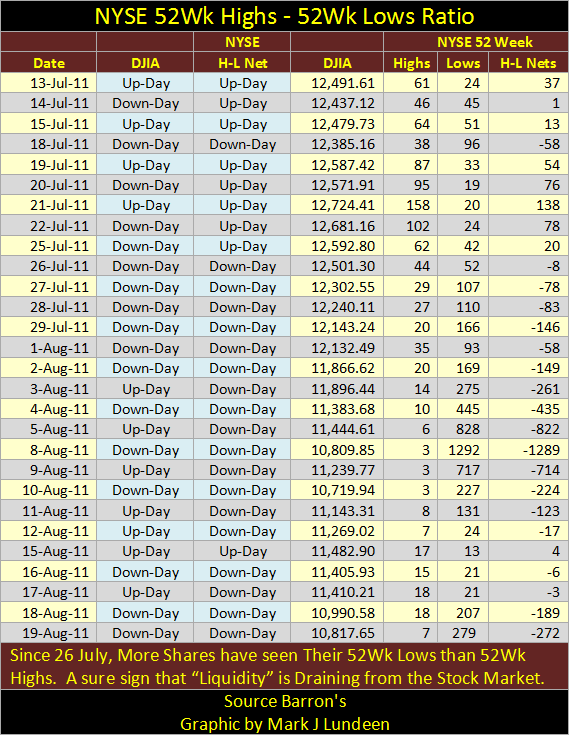
We see that on August 15, the ratio was positive for the first time in almost a month, but note how few 52Wk Highs there were. During the strongest of bull markets, there are always stocks at the NYSE that somehow see their 52Wk lows, just as during bear markets, like ours, some stocks are going to see their 52Wk highs. After studying the actual 52Wk highs and lows in the table, it's evident that the number of 52Wk lows really sets the tone for the NYSE 52Wk H-L Ratio during a bear market.
We see that the worst day in this cycle was on August 08, with 3, 52Wk highs and 1292, 52 Wk Lows. Since then, the ratio has backed off a bit. But all that means is that most of the 1292 shares that hit their 52Wk lows on August 8th just haven't made any more new lows since then. But we can be sure that most of them are within 1% or 2% of doing so again, and again, should the Dow take the plunge; which I think it will. And as the Dow Jones continues down, we will see even more shares trading at the NYSE reaching their 52Wk lows.
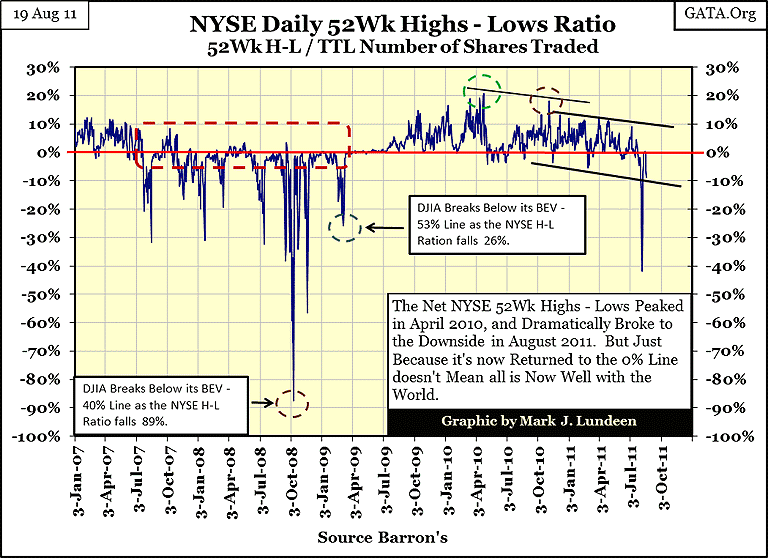
Let's take a look at the NYSE 52Wk H-L Ratio on a chart. I placed a red dashed square over the credit crisis's first phase. During this time, most of the shares trading at the NYSE were drifting down to their 52Wk lows. We see that on three occasions, the ratio fell below -30%, and then backed off, with the ratio actually becoming positive. During the first phase, the ratio spiked down three times before it finally plunged in October 2008, to -89%!
If a similar pattern is now forming, one with first big down spikes at -40%; oh boy, this is a very bad sign. No predictions here on my part, I'm only telling you what I'm going to be watching for in the months ahead: a recurring pattern of 40% down spikes in this ratio.
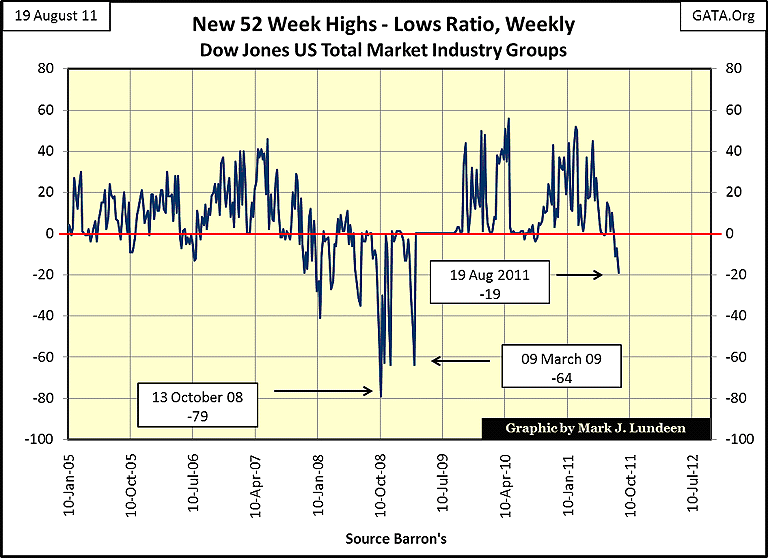
Next we look at the 52Wk H-L Ratio for the Dow Jones Total Market Group. The data shown is the weekly closing prices, and I calculate my own 52Wk highs and lows. We are not looking at individual stocks in this chart, but stock indexes. We should know that once the majority of stocks trading in the market finally drift toward one 52Wk extreme, or the other, they tend to stay near that extreme for many months or even years. These charts (above and below) are really bearish stuff, because when these 52Wk H-L Ratios see a big spike that's a reversal from the former trend, it marks the beginning of a new trend that isn't going away in a few weeks or months. What we see in these two charts is a clear trend reversal, the American stock market has flipped over, entering a prolonged period of declining values.
The chart below is the 52Wk H-L Ratio for the 34 foreign indexes I follow. This chart goes back to 1995, and whenthis ratio reverses itself, it too stays there for a few years.
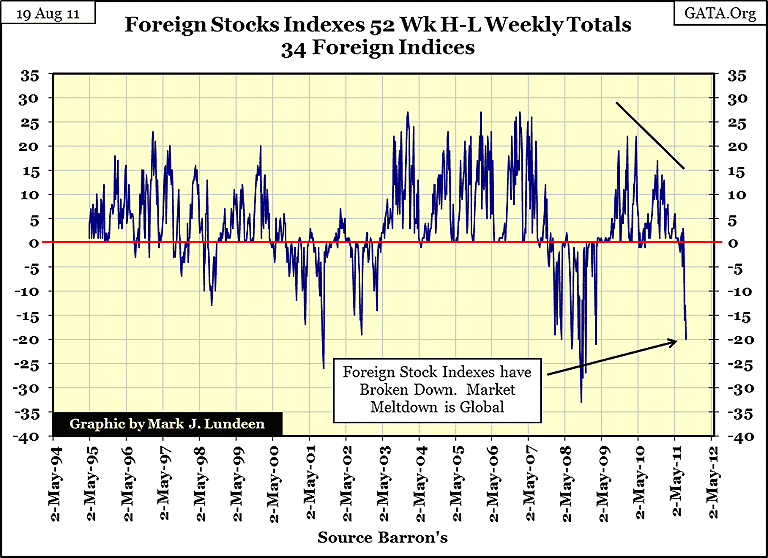
What you're looking at is my personal market research. And what I'm seeing scares me! Look how soon after a nice bullish period, the foreign stocks fell down to -20. Foreign stocks are doing no better than foreign bonds. Except for the mining shares, there isn't much I like in the stock market. For most retail investors, do yourself a favor and move out of any exposure to the financial markets, and get some silver coins while they are still cheap.
Most people are puzzled by Doctor Bernanke's persistent concern about "deflation", during a time when consumer prices are climbing at high single-digit rates. This can be explained when we understand that while we are looking at consumer prices, he is looking at his banking system's vulnerable collateral underpinning many trillions-of-dollars of debt he and Doctor Greenspan created. Washington now allows the banks to use years of housing inventory from foreclosures to remain as marked-to-fantasy assets on their books. If Washington insisted that banks mark-to-market these houses with deep discounts to the mortgages used to finance them, the banking system would fall into a gravitational black hole.
This is also true in the stock and especially, the bond market. Doctor Bernanke can't raise interest rates because Treasury bonds are major assets for his banks. As recently as 1997, US Treasury long bonds were yielding 7%. With today's consumer prices rising at least that much in 2011, these bonds should actually be yielding 10%. But a 10% current yield in the T-bond market would cripple the American banking system, as Bernanke's banks' bond portfolios would be cut in half by the adjustment. It's a mess; but it's a mess that the Federal Reserve and the American political class created all by themselves.
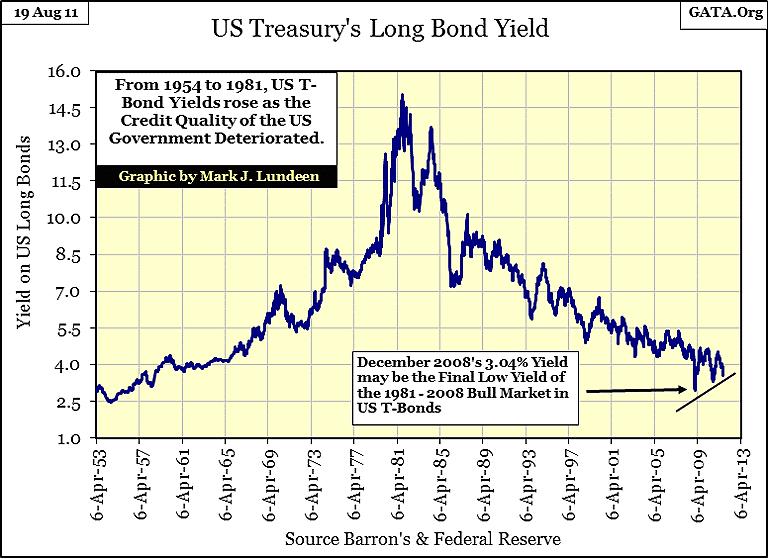
Nothing today is as it's explained to us on TV. Doctor Bernanke's quantitative easing had nothing to do with stimulating the economy, but everything to do with maintaining the banks' collateral at fictional valuations. Today's mortgage rates are below 4%, the lowest since 1964, but today few people qualify for a mortgage.
Heck, after Standard and Poors finally did their job, and downgraded the US Government's credit, president Obama is having the Justice Department investigate them. Investigate exactly what? How Obama in his "community organizing" days did legal work for ACORN in Chicago to muscle banks into making home loans to the inner-city's chronically behind-in-their-payment class. Or how President Clinton began a big federal program that ultimately blossomed into the Sub-Prime credit crisis. Or how Treasury Secretary Robert Rubin, and Doctor Greenspan, on live TV, gave testimony before Congress that OTC-derivatives needed * NOT * to be regulated by the CFTC. These derivatives were ground-zero during the credit crisis! Or how key members of Congress received sweetheart mortgage deals from the big sub-prime issuers. Or how President Obama received a home (I think it was a gift) in Chicago from a slum-lord. But these people are all safe, because they are still on the team! S&P went off the reservation, and so now they are to be punished, and made an example, because if you're corrupt individual in Washington, you had best stay corrupt in Washington.
Let me tell you a little secret, when the FBI comes knocking at your door, it's only because someone in Washington wants you to go to prison for a few years. I note that the other rating agencies who still rate the US as AAA, seems to have done a fine job when they, too, gave AAA ratings to Fannie and Freddie's sub-prime mortgage paper years ago, and rated Lehman's corporate debt AAA right up until the day they declared bankruptcy. But their malfeasants will go uninvestigated because they still maintain an AAA rating on the US Treasury. Hey, why isn't the Justice Department investigating Franklin Raines who ran Fannie Mae during the housing bubble?
Hey Bubba! When it takes the FBI to maintain an AAA bond rating for the US Treasury, there is something very wrong on Wall Street. Prudent investors had best accept the fact that a total collapse of the US banking system is looming and that the gold price is going up for a reason. Where gold goes, we can be sure that silver, and mining shares will follow.
[email protected]


