Market Comments for Early December 2022


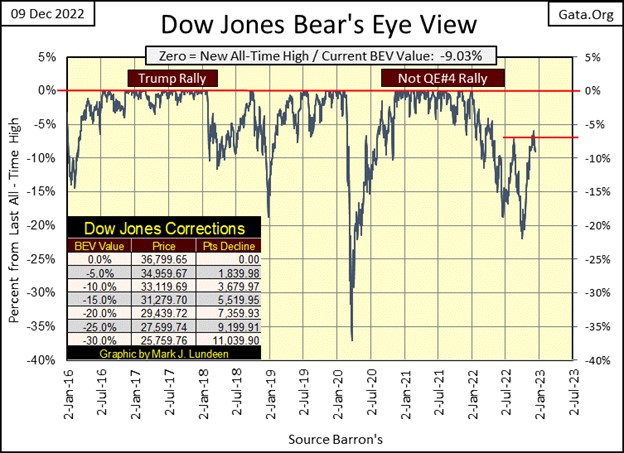
Last week closed with me feeling fairly optimistic on the future prospects for the Dow Jones; what with the Dow Jones closing above its highs of last August, above the red line in the BEV chart below. But a week can be a long time in the market, especially when the first thing the Dow Jones did this week was to deflate below its highs of last August at the close of Monday, and then seeing it close at the lows of the week on Friday.
Let’s be rational, and realize the Dow Jones has seen a nice 15 BEV points advance off its lows of Late September; a little correction from that advance is in order. However, I would have felt better had the Dow Jones first close above its BEV -5% line, in scoring position before it decided to retreat back below its highs of August. The Dow Jones needed to advance only 1.67% from last week’s close to make that happen; to close in scoring position in the chart below. But a week later that didn’t happen, and that leaves me wondering when, or even if it will.
NYSE margin debt isn’t bullish as we come ever closer to 2023. For the fourth time in the 21st century, margin debt is declining in a significant way. The other three times margin debt peaked, and then retreated were prior to the;
- 2000-02 NASDAQ Tech Wreck,
- 2007-09 Subprime Mortgage Bust,
- March 2020 Flash Crash
As you can see below, margin debt peaked in October 2021. Now in October 2022 (latest data), it has contracted by 30.59% from that peak, as seen in the table. Will the stock market see a significant market decline following this big 31% reduction in margin debt?
Looking at the BEV values for the major market indexes I follow in the table below, the stock market already has seen some significant market declines. The NASDAQ Composite (#18) and NASDAQ 100 (#17 below) have deflated by 30%. “Market experts” on CNBC claim when the market is down by 20%, it’s in bear market territory, but what is “the market?” The Dow Jones or maybe some other market index? As seen below, indexes #13-19 are all in bear markets.
But the Dow Jones remains at #2, closing the week with a BEV of -9.03%. So, thanks to the thirty large, dividend paying, blue-chip stocks that comprise the Dow Jones, apparently “the market” still isn’t in a bear market.
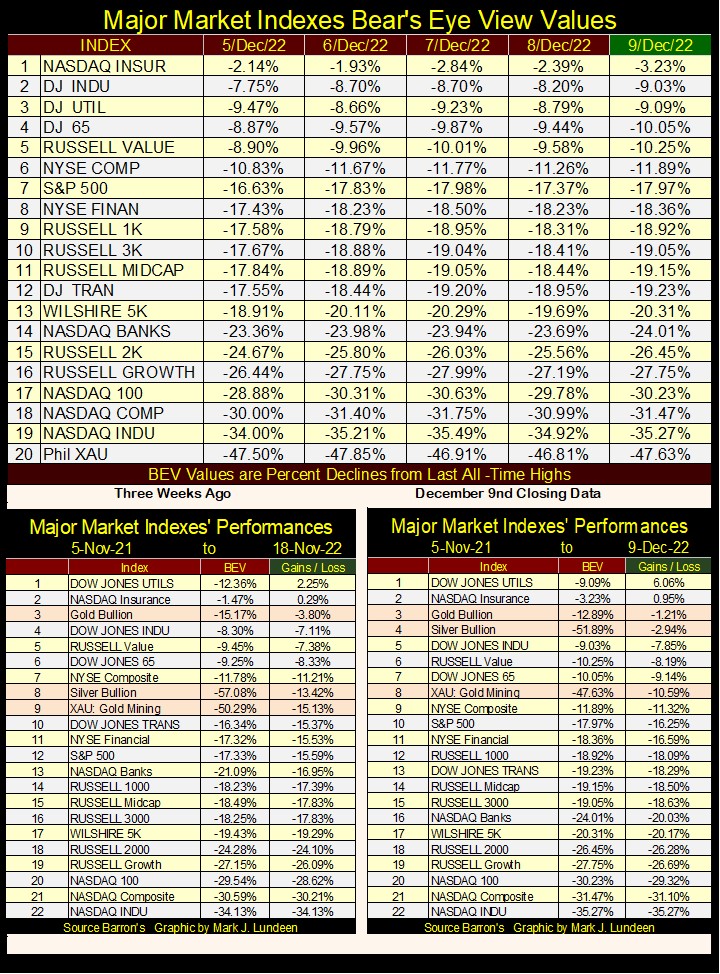
Looking at precious metal assets in the tables above (#3,2&8), once again this week they’ve advanced when almost everything else declined. The precious metals market action isn’t exciting, but it’s good, and I pray it will continue to be as 2022 fades, and 2023 becomes our daily reality.
One more thing on these major market indexes. Below is the table for the first week of November of last year, and the reason I use Nov 5th of 2021 as basis for the tables above; because on Nov 5th, 15 of the 20 indexes below closed at all-time highs, while four others were in scoring position, with the XAU not even trying to compete.
During this week in November 2021, out of a possible 100 daily closings, 66 closed at new all-time highs. This isn’t what a bull market looks like; this is what a bull-market top looks like. Yes, these major market indexes were to make additional new all-time highs (BEV Zeros = 0.00%) in the next two months, but not in the frequency or volume seen below.
By February 2022, new all-time highs became market events from the past. And this is what a bear market looks like; market valuation deflating from their last all-time highs (BEV Zeros) as seen in the table above for this week. What a bear-market bottom looks like in this table we’ll eventually see. Could be years from now, and much deeper percentage declines from this week’s close (table above).
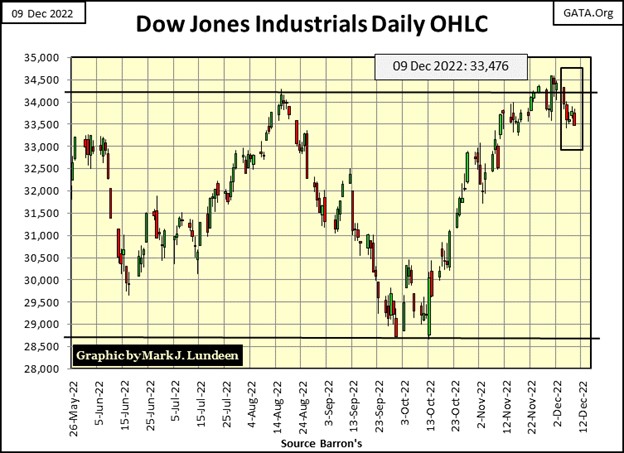
This week the Dow Jones, in daily bars below, retreated from the gains of last week. The Dow Jones in daily bars is looking more bearish than the Dow Jones does in its BEV chart above, because last week wasn’t exactly a bullish festival either. It had one big up-day, a Dow Jones 2% day, a day of extreme volatility on Wednesday, or last week too would have been a down week.
So, what is to come from here? I don’t know. With so many of the big market indexes now in bear-market territory, how much longer can the Dow Jones continue advancing? Unless the other major indexes also begin advancing from their current lows, I expect the Dow Jones will soon find itself in trouble.
This is one weird “bull market”, with the bull’s only claim to fame being the Dow Jones, as the other big market indexes are down over 20%, and some by over 30%.
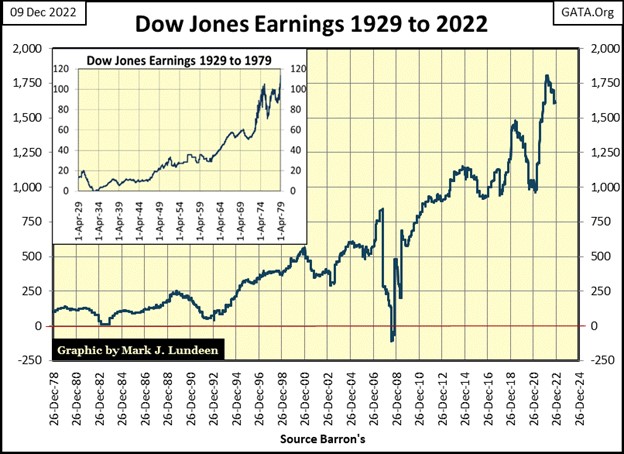
Earnings for the Dow Jones are near all-time highs, but like many of the market’s other parameters, so far the 21st century was a break from what they were in the 20th century. Take a look at earnings before 2000; they went up and down, but not with the wild swings seen since 2000.
There is much bad news about the retail sector this Christmas season. As I write, in my area there are gas stations that are without diesel fuel, and have no idea when the next shipment of diesel fuel will arrive. Then again, I topped off my car today at a gas station that did have diesel.
What about the big mega stations that service the truck fleet on the huge interstate freeway system? It’s hard imagining they don’t have diesel. Without trucks hauling freight from producers to consumers, the economy will crash, and so will earnings for the Dow Jones.
Will earnings for the Dow Jones soon crash? I’m just a market enthusiast, so what do I know? Well, I know America’s markets, and just about everything else, including much of what is happening in Ukraine, are regulated / managed by the Federal Government. So, what can go wrong when the Biden mis-administration is taking care of business?
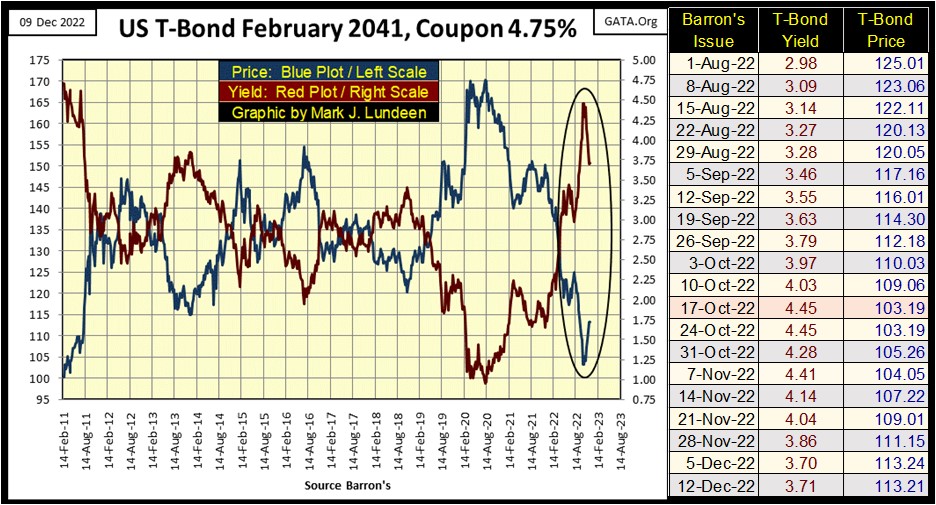
Here is a 30Yr T-bond issued in February 2011. It’s off its lows of October, but it is only a matter of time before Mr Bear comes back to resume his program of deflation in debt-market valuations.
Here is a prediction that’s easy to make; too much debt, with marginal means available to service it, eventually come to a point-of-crisis in the debt markets. Be that the Federal and local governments, corporations or private consumers now struggling with rising consumer prices. A significant recession from this point on will result in massive debt defaults. That is something we can count on.
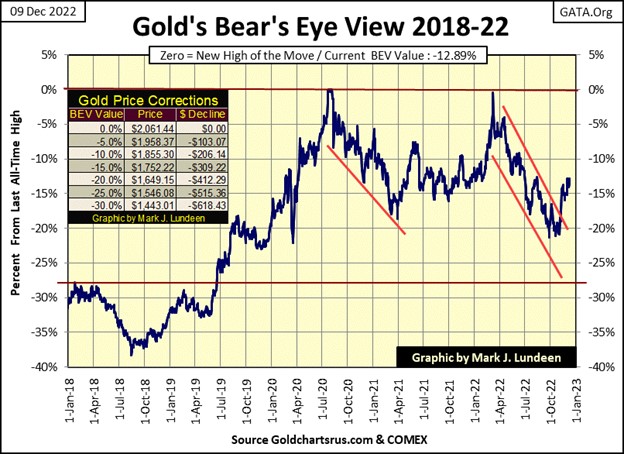
Here is gold’s BEV chart. Gold is holding on to the gains from its lows of October. It would really be nice seeing gold close above its BEV -10% line before it begins any correction in this move. And then again, with the crazy market we’re now having, it’s possible gold could spike up to its BEV -5% line in a week or two.
But to someone suffering from battered-bull syndrome (BBS), like me, that sounds like crazy talk. I’m keeping my eyes on gold’s BEV -20% line below, but have my fingers crossed that won’t happen.
I’m going to skip the step sum charts this week, as there is little new about them. And that is how it will stay until gold and the Dow Jones finally decide to do something big. As 2022 comes to its end, both markets are avoiding any excitement, and just keep plodding along.
Let’s take a quick look at their step sum tables below. Gold is up 6.85% from its close on November 4th. That is good, as is its rising step sum, which tells us gold is seeing more advancing than declining days. For bulls, that is always a good sign.
If you look at the Dow Jones side of the table, the same is true for the Dow Jones, which saw even more daily advances since November 4th than did gold, but managed to advance only 3.31% on those additional daily advances.
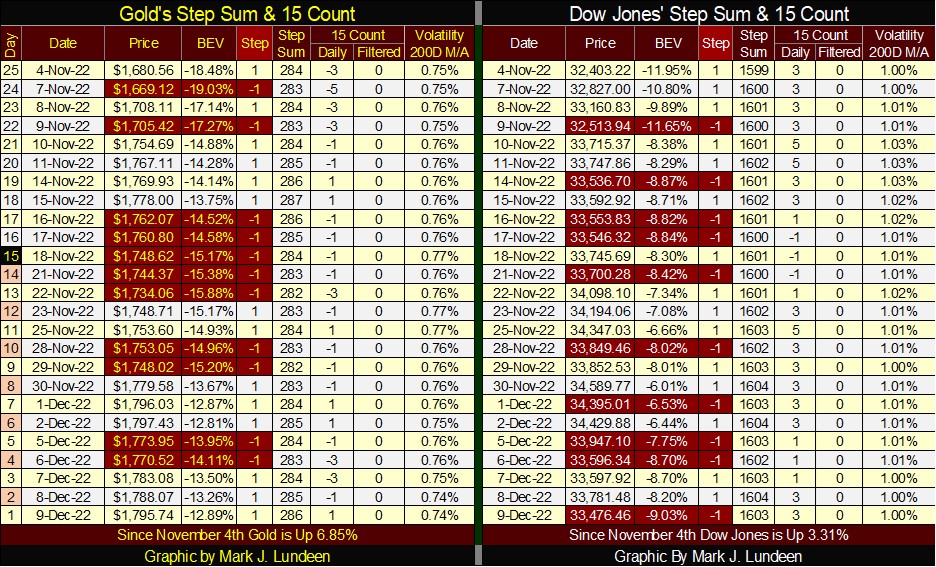
Gold’s daily volatility’s 200D M/A is going the wrong way – down. Personally, I don’t expect much from gold until it once again begins seeing an increase in its days of extreme volatility (3% days). The increase in daily volatility in the gold market could happen quite suddenly, should the debt markets begin to suffer from rising defaults for one reason or another.
Daily volatility for the Dow Jones remains high at 1.00%. Bull markets are low volatility markets. Maybe that is the wrong way of looking at daily volatility in the stock market.
Here is the Dow Jones daily volatility’s 200D M/A going back to 1900. With this chart, and a time machine that could take you back to 1900, someone could become the most successful investor of all time.
Volatility characteristics over the past 123 years have changed from decade to decade. The low volatility of the Roaring 1920s bull market is easily seen, as is the wild volatility of the depressing 1930s. But one thing remains the same from decade to decade, that big-bear markets begin during times of low daily volatility, and then see their volatility spike as they develop. The bull markets that follow these big-bear markets all begin as daily volatility is extreme, and then see daily volatility collapse as they come to their tops.
There are exceptions to this rule of thumb, for instance the 1987 volatility spike, which came about as the result of a one-day melt-down on Wall Street. But in the main, it’s possible to identify bull and bear market using these spikes in Dow Jones daily volatility’s 200D M/A.
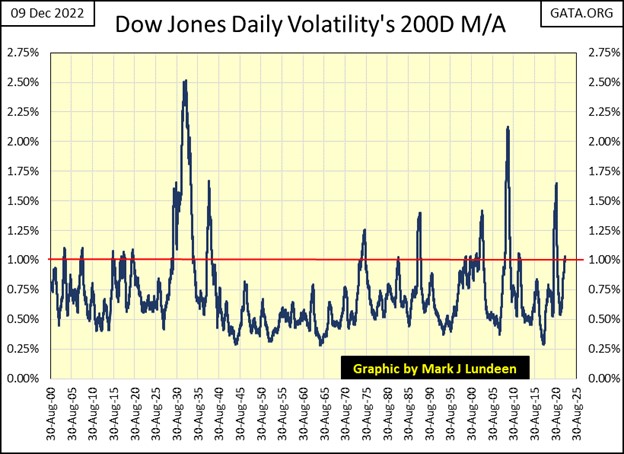
Simply put; in the plot above, bull / bear market cycles can be identified by identifying a volatility spike:
- Bear markets occur on the upsides of these volatility spikes,
- Bull markets occur on the downsides of these volatility spikes.
As far as a workable, and profitable theory on the market goes; I can’t make it any simpler than that.
Looking at the Dow Jones current daily volatility’s 200D M/A of 1.00%, one has to wonder whether or not we are already in a big bear market. If we are, then this current rise in daily volatility will ultimately become another volatility spike in the plot above. That is how I see this market, that until the Dow Jones’ daily volatility in the chart above peaks, and then begins to collapse, as it has done so many times before in the past 123 years, this is a dangerous market to be a bull in.
As I’m sure you are now suspect, this is my shortest article for 2022. With the Christmas holiday approaching, I have other priorities ahead of my market commentaries. Sad but true. Expect the same next week, followed by a few weeks of my vacation for the holidays, unless something unexpected happens somewhere in the market.
Mark J. Lundeen
*******


