Market Timing Points
 share
share
 share
share
 share
share
 share
share
 share
share
Precision timing for all time frames through a multi-dimensional approach to technical
analysis: Cycles - Breadth - P&F and Fibonacci price projections
and occasional Elliott Wave analysis
Current position of the market
SPX: Very Long-term trend – The very-long-term cycles are in their down phases, and if they make their lows when expected (after this bull market is over), there will be another steep decline into late 2014. However, the Fed policy of keeping interest rates low has severely curtailed the full downward pressure potential of the 40-yr and 120-yr cycles.
Intermediate trend – New uptrend still in doubt
Analysis of the short-term trend is done on a daily basis with the help of hourly charts. It is an important adjunct to the analysis of daily and weekly charts which discusses the course of longer market trends.
INDICATORS INCREASE THEIR WARNING OF A REVERSAL
Market Overview
There are probably nearly as many investment strategies as there are investors, but in thirty+ years of analyzing the stock market, I have learned a few things:
The stock market (as a whole) moves in a cyclical manner. There are specific cycles which affect price movement, but this is not what I am referring to, here. What I mean is that it tends to go from overbought to oversold and back to overbought, etc… perpetually. On the Point & Figure chart, this is best expressed as continuous patterns of “accumulation-uptrend, distribution-downtrend”. The accumulation process is when buyers slowly gain control over sellers, which eventually results in an uptrend, and distribution is the opposite.
This is the basic market rhythm! Of course, these “cycles” entail all sorts of variations (or degrees) which are produced by the underlying forces of supply and demand; and they move the market, FOR WHATEVER REASON!
If this is the case (and it is!) the whole purpose of technical analysis is to identify the overbought and oversold conditions through reliable indicators, to become thoroughly familiar with them, learn to trust them, and develop the patience to wait for them to tell you when the supply/demand conditions are changing. This trio of understanding, trust, and patience, are virtues that few individual investors (or traders) develop. Only those who are serious about investing, persist!
I am not suggesting that this is the only valid approach to investing, but it is the only one which goes to the very essence of market trends. Many investors have developed investment theories, and some of them have merit but, although they all recognize some basic aspect of price movement and strive to act on it, they fall short of understanding the basic cause of trend changes.
This little “tutorial” is more to explain my approach to trading than to claim that it is the only valid one. It is essentially the approach to stock market trading that was initially formulated by Richard Wyckoff (one of the most successful market traders of all times) in the Wyckoff Course which was first published in 1931 and continues to be taught today. Here is a quote from him that says it all:
“There are those who think that they are studying the market when all they are doing
is studying what someone has said about the market instead of what the market
has said about itself.”
That said, “my” indicatorsJ, have been telling me to be careful of an impending reversal for a couple of weeks. For one thing, a long-standing projection to 1863/1873 for the SPX has now been reached; and that, on its own, should be a warning since the accumulation phase that was created at the 1360 level has now spent all of its energy. At the same time, the weekly indicators reveal some developing weakness through a combination of an overbought condition and negative divergence (which is the worst since April 2011).
But this, in itself, does not suggest an imminent reversal. Such a condition can persist for several weeks. What makes the warning imminent is the fact that the daily indicators also show the market to be vulnerable to a correction. The hourly indicators have already given a sell signal which, so far, has only resulted in a consolidation of a few hours, but which could evolve into a full-fledged correction if the SPX closes decisively below 1870 on an hourly basis.
That is the market condition as I see it, as of Friday’s close! Furthermore, the trigger might have already been pulled on Saturday by China reporting that its exports fell sharply in February. News of this nature normally has a negative effect on the market, and Friday (which had the potential for being a positive market day) turned out to be very tentative -- as if traders were waiting for some news which could affect Monday’s trading. On the other hand, that concern could also have been the result of a potential deterioration of the Ukraine situation over the weekend. Whichever! The probability of an imminent retracement is real and one should be prepared for it. This does not mean that I am calling for the top of the bull market. Although this condition could develop into a long-term decline, it is too soon to make such a forecast.
Chart Analysis
Instead of starting with the weekly chart, let’s start with the daily SPX chart (courtesy of QCharts.com).
The SPX has been trading at the very top of a channel which defines the price movement starting on October 2011. Although I call it a long-term channel, it is actually the second phase of the bull market which began in March 2009. The index continues to exhibit strength: after moving away from the top channel line with a decent pull-back, it moved right back up to it… almost!
On the chart I have drawn some red lines which may represent the beginning of deceleration if we do start a correction from here. Because of this continued strength, any top which is made here is probably only a temporary one which will be surpassed after the correction is over.
Last week I pointed to some deceleration beginning in the short-term channel. While it has not yet led to a reversal, neither has it been erased. A conclusive sell signal would take the price out of its channel entirely, and this is what the oscillators are suggesting! The lower (A/D) oscillator always leads. It has declined steadily for three weeks while prices were rising, found temporary support on the middle line, but Friday resumed its decline and started to punch through it. The divergence with price is undeniable.
At the same time, the SRSI -- a very sensitive momentum indicator which is very good at signaling overbought and oversold conditions -- has now been overbought for three weeks, which infrequently happens. What is lacking is negative divergence, which could be indicative of the occurrence of only a short-term correction followed by some additional distribution. This is reinforced by the MACD which is barely exhibiting divergence with former tops, remains well above the zero line, and has not yet turned down.
In any case, the indicators are issuing a warning which should be heeded. Occasionally, weakness can feed on itself and what starts as a mild correction develops into something more serious.
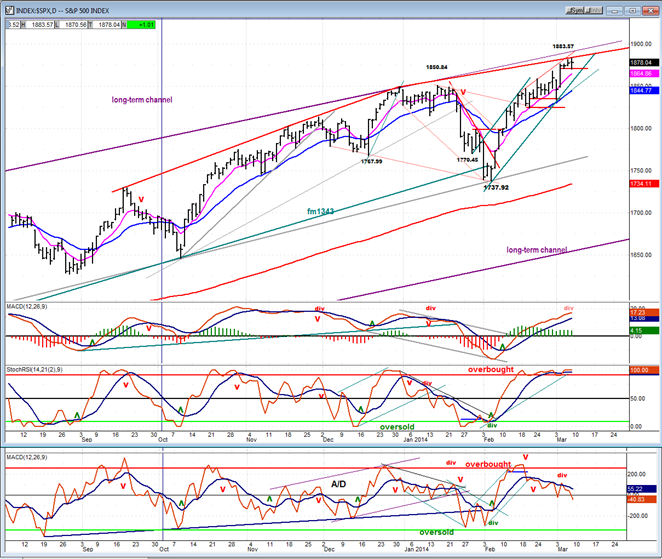
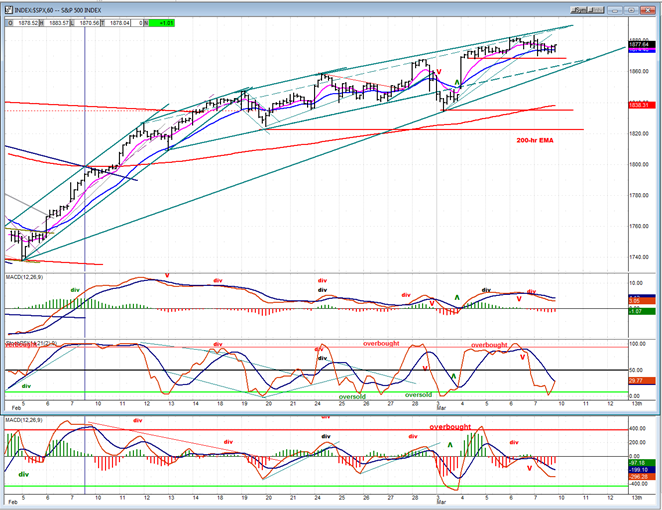
This could be the case with the hourly indicators. Let’s glance at the entire short-term trend, first. After a poor showing in January, the SPX began to stabilize in early February, and quickly overcame three successive trend lines of different angles in one fell swoop, to invalidate the start of a potential downtrend. However, since its near-term peak of 2/18, although SPX has continued to progress steadily, it has done so at a low angle of ascent which suggests that buying power is barely superior to the selling taking place.
The last week of trading has been particularly instructive. After trying to start a correction which could not follow through on Monday, the index rallied sharply and then went into a sideways pattern which now looks very much like a small phase of distribution in which the sellers are equal to the buyers. And here is where the advantage of the P&F chart really shows; because that little 4-day phase of sideways trading on the P&F chart is equal to 60 SPX points across. Meaning that if we start a decline from here, we could be seeing the beginning of a 60-point decline potentially targeting about 1820 which is, incidentally, an important support level!
Earlier I mentioned the indicators! The SRSI started to weaken and was already in a downtrend before the jobs report came out. The initial rally on Friday morning pulled back almost immediately accelerating the decline of the SRSI and rolling over the price and A/D MACDs. SPX quickly dropped to the (blue) 21-hr MA and pretty much used it as support for the rest of the day. A weak attempt was made at bouncing into the close which, with two of the three oscillators still declining, left the index susceptible to any sort of negative news over the weekend. This is why the news from
China could easily trigger a sell signal on Monday. A decisive break below 1870 is all that is required to bring sellers to the fore.
Cycles
According to Clif Droke, some Kress cycles should be pressuring the market between now and the first week in April. It sounds like the conditions needed to initiate and keep a decline going for a potential 60-point SPX retracement.
Breadth
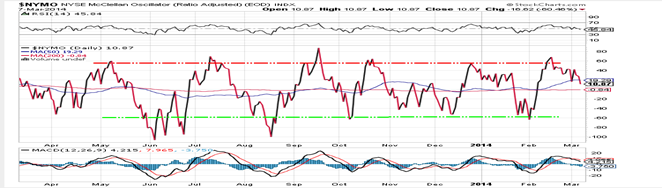
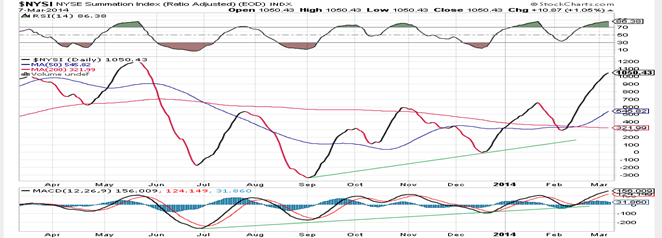
Charts of the McClellan Oscillator and Summation Index appear below (courtesy of StockCharts.com).
The former has now been correcting for about three weeks and closed on its low on Friday. During the same time -- and because the Oscillator remained positive -- the Summation index continued to rise. This has sent its RSI to an even more overbought condition and should be followed by an adjustment downward. In the breadth statistics, you have the same cyclical pattern that was discussed earlier regarding the price action. Although the time periods vary somewhat, the Oscillator and the Summation Index RSI rotate regularly from overbought to oversold. It looks as if the down move has already started in the Oscillator.
Sentiment Indicators
The SentimenTrader (courtesy of same) long-term and short-term indicators remained at the same values as last Friday’s for the third consecutive week. That does not necessarily indicate that we will not have a correction, but only that 1883 is not likely to be the top of the bear market.

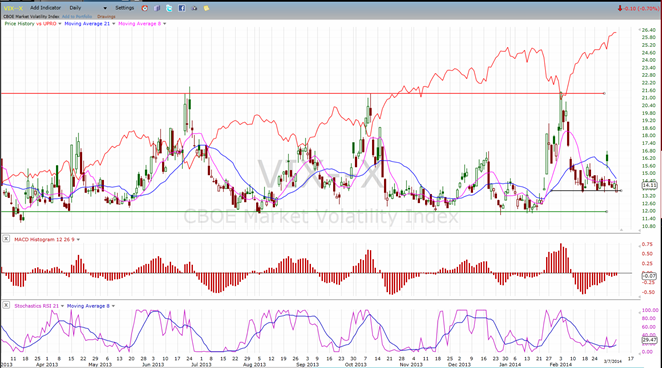
VIX (Velocity Index)
By holding at about 14.00, VIX has refused to acknowledge the SPX’s last attempt at extending its gain. This is a form of negative divergence which is also manifest in the A/D during the same time period.
VIX looks ready, once again, to challenge the 21.50 price level which has repeatedly stopped it from developing a sustained uptrend in the past. It can only do so if SPX begins to decline.
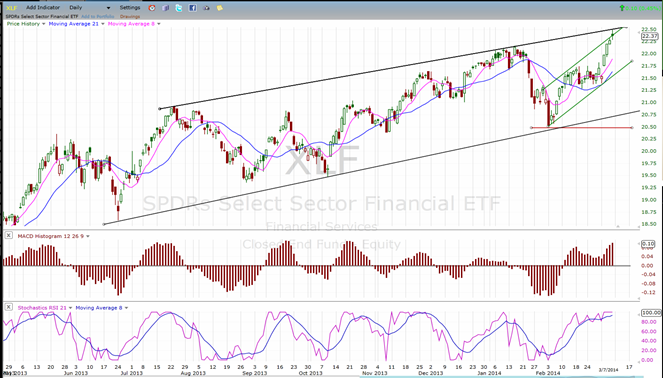
XLF (Financial Index)
After lagging significantly (along with other leading indexes), XLF has surged to a new high. Whether this is a last gasp move or the beginning of a new uptrend is something that will be decided later. The pattern is not impulsive, so best case scenario is that the move will not be sustained. It also encounters resistance at the top of two channels, and the SRSI is overbought. The histogram and the price pattern have an inverse resemblance to what took place in May and June of last year.
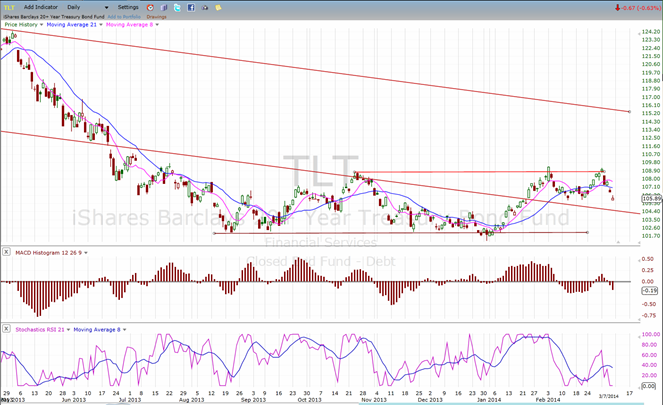
TLT (Barclays 20+ year Treasury Bond Fund)
TLT could not overcome the 109.00 resistance and has pulled back to the former short-term low. If it stabilizes at this level, it should be ready for another attack on the recent highs.
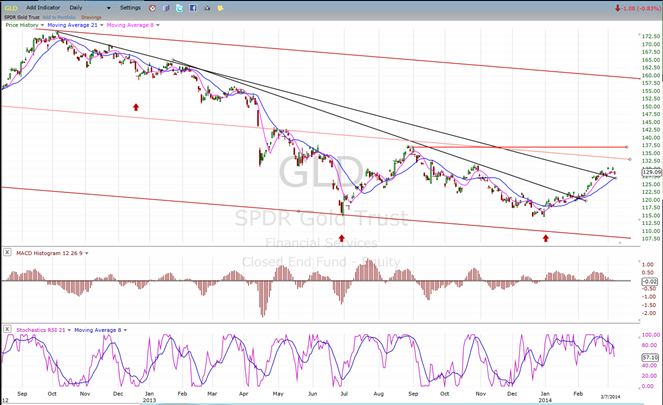
GLD (ETF for gold)
So far, GLD’s bottoming of the 25-wk cycle has produced a 15-point rally which has brought the index just outside of an important downtrend line. It is pausing at a former short-term high, but there should be enough upside pressure left in the cycle to take it to its minimum P&F objective of 134.
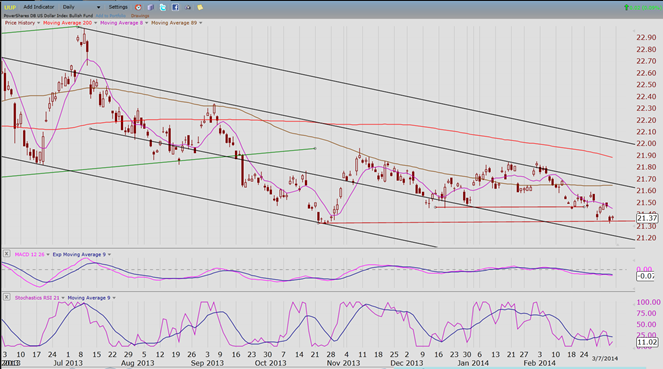
UUP (dollar ETF)
UUP continues its short-term decline and has now reached support at the October low. There is a good possibility that it will hold at this level after completing an A-B-C consolidation pattern. If so, this could turn out to be a base which could produce a significant uptrend when it is ready to turn around.
First, let’s see if the (ca.) 21.35 level holds.
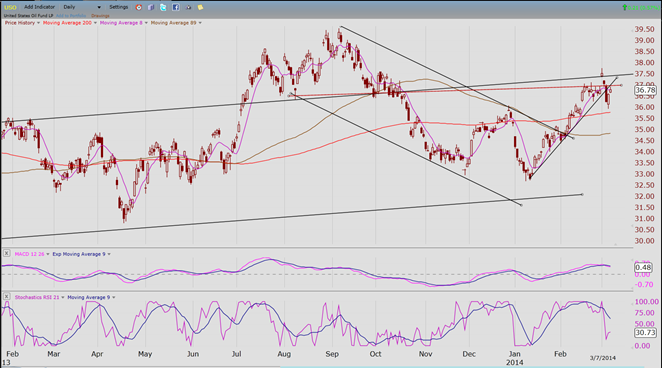
USO (United States Oil Fund)
As expected, USO has met with resistance at the top of the green channel which coincides with the lower portion of an important overhead resistance area. USO’s inability to push higher into that overhead formation is a sign of weakness. If it does not quickly try to move higher, we can expect the beginning of another short-term downtrend.
Summary
Over the past two or three weeks, indicators have displayed more and more urgent warnings that a short-term reversal was coming, with Friday’s market action adding perceptively to that possibility.
Saturday’s news from China that exports had fallen sharply in February could be the catalyst which triggers the reversal. If so, stocks should open lower on Monday.
********
FREE TRIAL SUBSCRIPTON
Market Turning Points is an uncommonly dependable, reasonably priced service providing intra-day market updates, a daily Market Summary, and detailed weekend reports. It is ideally suited to traders, but it can also be valuable to investors since highly accurate longer-term price projections are provided using Point & Figure analysis. Best-time reversal estimates are obtained from cycle analysis.
For a FREE 4-week trial, send an email to: [email protected]
For further subscription options, payment plans, weekly newsletters, and for general information, I encourage you to visit my website at www.marketurningpoints.com. By clicking on “Free Newsletter” you can get a preview of the latest newsletter which is normally posted on Sunday afternoon (unless it happens to be a 3-day weekend in which case it could be posted on Monday).
The above comments and those made in the daily updates and the Market Summary about the financial markets are based purely on what I consider to be sound technical analysis principles. They represent my own opinion and are not meant to be construed as trading or investment advice, but are offered as an analytical point of view which might be of interest to those who follow stock market cycles and technical analysis.
share
share
share
share
share

When Andre Gratian was a stock broker years ago, a friend introduced him to technical analysis of the market. Consequently, it is not an exaggeration to say that Andre fell in love with this approach! Ever since then, it has become an increasingly important part of his professional life. Gratian has studied the works of Wyckoff, Edwards & Magee, Edward J. Dewey (cycles) and many others. However, one of my most profitable undertaking has probably been to study Point & Figure charting, which he finds invaluable in analyzing stocks and indices. If he were restricted to one methodology, this is the one that he would choose. This well-rounded background has given him what he feels to be a special insight into the stock market, facilitating the recognition of meaningful patterns and the ‘turning points’ in all trends, whether they be short or long term. Andre feels very comfortable discussing the stock market and passing on meaningful information to others. His subscribers include individuals and money managers throughout the world. Moreover, his Newsletters are currently published on several financial sites, here and abroad.


