Market Turning Points


Precision timing for all time frames through a multi-dimensional approach to technical analysis: Cycles - Breadth - P&F and Fibonacci price projections and occasional Elliott Wave analysis
“By the Law of Periodical Repetition, everything which has happened once must happen again, and again, and again -- and not capriciously, but at regular periods, and each thing in its own period, not another’s, and each obeying its own law … The same Nature which delights in periodical repetition in the sky is the Nature which orders the affairs of the earth. Let us not underrate the value of that hint." -- Mark Twain
Current position of the market
SPX: Very Long-term trend – The very-long-term cycles are in their down phases, and if they make their lows when expected (after this bull market is over), there will be another steep decline into late 2014. However, the Fed policy of keeping interest rates low has severely curtailed the full downward pressure potential of the 40-yr and 120-yr cycles.
Intermediate trend – New uptrend still in doubt
Analysis of the short-term trend is done on a daily basis with the help of hourly charts. It is an important adjunct to the analysis of daily and weekly charts which discusses the course of longer market trends.
NEW UPTREND STILL IN DOUBT
Market Overview
After a sharp correction, the SPX mounted a powerful rally of a little over 100 points, but some questions have arisen about the nature of the rally. Is it a new uptrend that will take the index to new highs, or just a powerful B wave of an ongoing correction? There is enough evidence to satisfy both camps, and only future price action will give us the answer.
By the time it reached 1842 on Friday, the S&P looked as if it was ready for a minor correction of a few days. An extremely overbought condition, price deceleration, and hourly oscillators’ divergences are warning that a short-term reversal is imminent. If the top was not made on Friday, Tuesday is also a candidate. The move seems to have been pushed to its limit – actually beyond its limit since it overshot the most optimistic P&F projection derived from its base. But the minor loss of momentum only applies to the hourly prices. The daily indicators are still too strong to suggest an end to the rally.
Nevertheless, the same conditions which made the rally questionable last week have not gone away. A number of indexes which normally lead are trailing the SPX, instead. And the QQQ, which has already soared to new highs, may be very close to reaching an important price target which could prove difficult to surpass. Furthermore, some of the stocks which have contributed to its sustained rise appear to be nearing the end of their uptrends.
As a result of the diverse degree of participation by individual indexes, we have a stock market that is disjointed! This is, more often than not, the sign of a market that is topping. And, of course, this is what we should be looking for! With the bull market now 5 years old and very long-term cycles expected to make their lows at the end of the year, we should be on the alert for an important market top. I am going to be a little cynical and suggest that the relentless rally of the past few days could have been engineered by big trading entities in order to establish short positions at more favorable prices for the severe decline that lies ahead. While we are no longer in the age of Jesse Livermore when “campaigns” were conducted brazenly, it would be naïve to suggest that price tampering has disappeared completely.
Chart Analysis
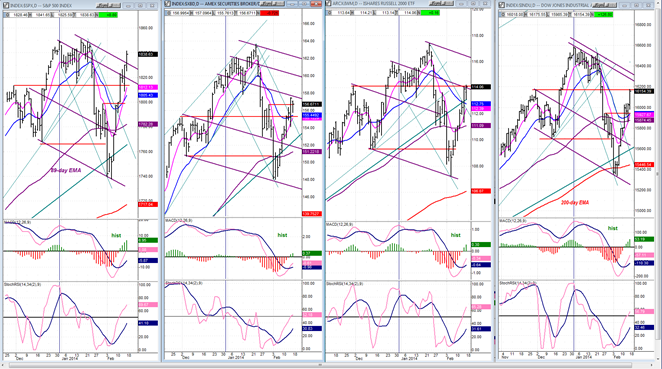
Below, I have re-posted the four charts shown last week (courtesy of QCharts.com) in order to show their progress over the past week. I have kept them in the same order although the second chart (XBD) could have been moved to the fourth position as it is now the weakest. This is interesting because XBD is one of the prime leading indexes and, if it continues to weaken relative to the rest of the market, it will strengthen the supposition that we are getting very close to a market top.
Generally speaking, SPX (far left) has continued to surge as the other three indexes have continued to lag behind. This is not normal behavior for the market and, if it is only a temporary phenomenon and the others catch up over the next couple of weeks, it will turn out to be an aberration. But if it persists, it will become a red flag.
Here is something else! Note that even in SPX, the MACD has yet to turn positive while in the other three, it is still negative. This is not the way that strong uptrends that have lasting power normally begin. Usually, the MACD shows some obvious deceleration, often with positive divergence. Here, all three MACDs are clearly in downtrends and do not suggest the start of a sustainable rally.
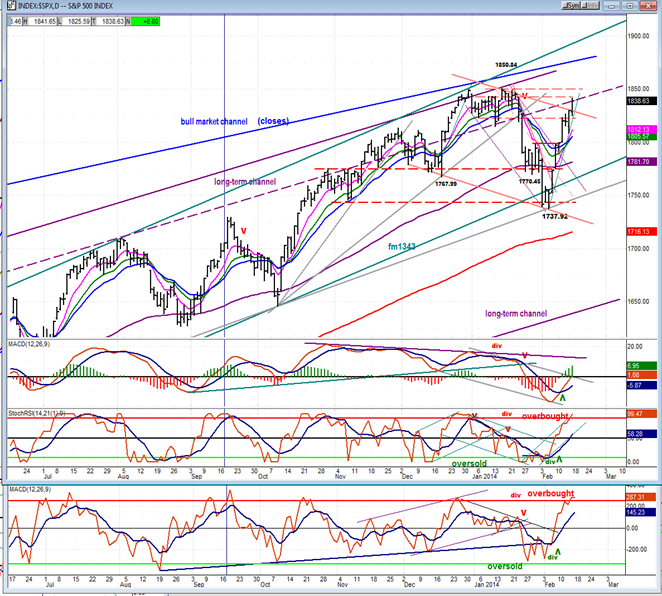
The above is a collective view of what the market is doing. Let’s now turn our attention the daily SPX chart (courtesy of QCharts.com) for more specific scrutiny.
During its uptrend, SPX briefly paused at the lower level of the overhead resistance area, and then pushed higher. As we will see on the hourly chart, that last 10-point move was accompanied by significant negative divergence in the hourly indicators. But for now, let’s concentrate on the daily oscillators. I have already mentioned the relative weakness of the price MACD during this uptrend. It is very obvious on this chart. At the same time, the two lower indicators have reached their extreme overbought levels and are vulnerable to corrections which should be limited in scope. Support is apparent at or slightly above 1800. What happens afterwards will clarify the market’s position. A resumption of the short-term uptrend, perhaps even to a new high, is likely. If this causes negative divergence to appear in the oscillators, another caution sign will have been created.
A quick glance at the weekly chart warns us that the minor negative divergence which occurred at the 1850 top is likely to increase significantly on any new high, unless the current short-term uptrend intensifies in momentum and reaches much higher prices. I still have an unfilled projection to 1863, slightly above the existing 1850 top. Even if that is reached over the next couple of weeks, it may not be enough to erase the negative divergence from the weekly chart. A combined divergence in both weekly and daily oscillators would be a serious red flag. Granted, all this is speculative at this time, but in my mind it would be a logical sequel to relative weakness which is beginning to appear in the leading indexes. I will let the market prove me wrong!
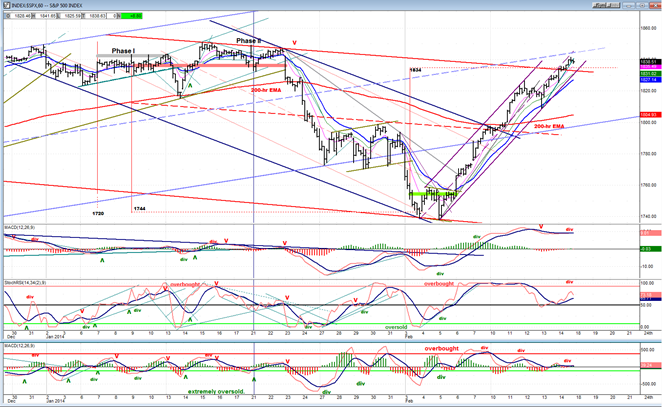
We should also look at what the hourly SPX chart (courtesy of QCharts.com) has been doing, especially in the last couple of days. 
After falling short of its ideal downside projection of 1720, SPX created a base on the P&F chart which gave us a potential (extreme) count to 1834. Note that positive divergences were created in the hourly oscillators at the low of the move, which warned of a reversal. Now we have the same condition, but in reverse, warning us of an imminent top coming to an extremely overbought index which has just shot up over 100 points without any worthwhile consolidation. The rally overcame all down-trend and channel lines, including the very top one, which might be a confirmation that the correction is over, although the penetration was not decisive enough and prices could easily fall back into the channel on any pull-back.
A minor correction should find support near the 200-hr EMA at 1805. This would also approximate a .382 retracement of the entire rally – assuming that the high occurred on Friday.
Cycles
The intermediate Kress cycle due around the 21st has not been effective in containing prices, but it could still exert some downward pressure over the next few days.
Beyond that, since it’s only a matter of time before the very long cycles bottoming around October begin to influence prices, our attention should be on finding clues that this is taking place. Perhaps the relative weakness of the leading indicators pointed out above is an early sign.
Breadth
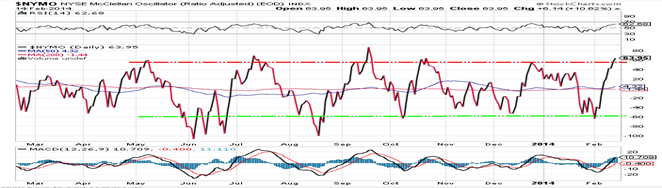
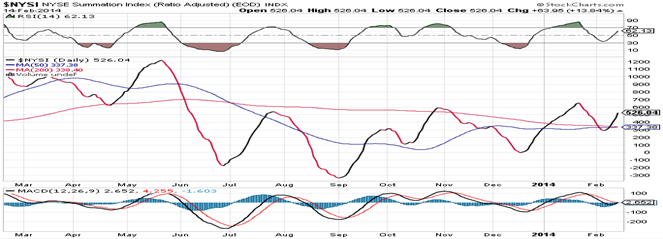
Charts of the McClellan Oscillator and Summation Index appear below (courtesy of StockCharts.com)
Similarly to my own charts, the McClellan Oscillator has reached an overbought condition and should be ready to retrace. This will affect the Summation Index which has been in a basic uptrend since September. A new high in the SPX without the participation of the McClellan Oscillator and Summation Index would be another negative for the market.
Sentiment Indicators
The SentimenTrader (courtesy of same) long-term indicator has now returned to a reading of 60 but may have to move back up to 70 before signaling the next important top.
VIX (Velocity Index)
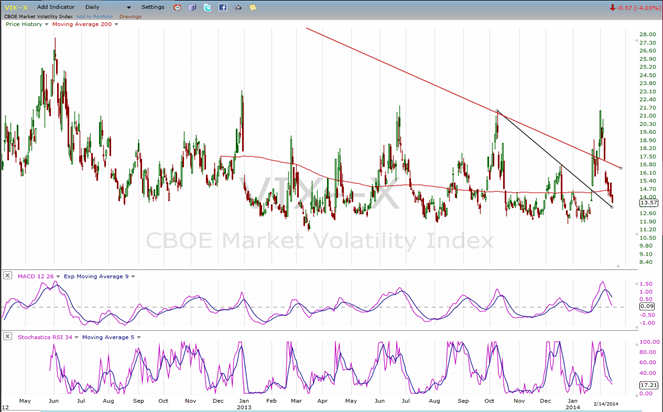
The rally has caused VIX to retrace all the way down to the top of its base. If it can hold here and start back up it will have made a higher low, possibly another sign that the market is ready for a top.
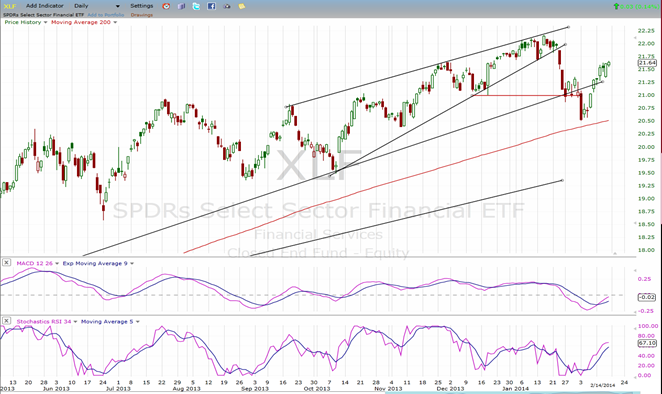
XLF (Financial Index)
Like the leading indexes shown above, XLF has begun to show some relative weakness to SPX. Unless it catches up before long, it will not bode well for the market. XLF has a habit of topping before the market does.
TLT (Barclays 20+ year Treasury bond fund)
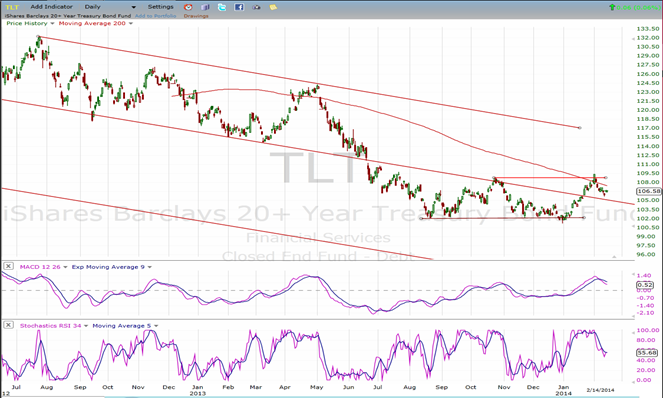
TLT has found some resistance at a former short-term high (and at its 200-DMA) and has pulled back. However, it is holding well and should find support above the mid-channel line which previously acted as a support level. If it starts to rise again, this may put pressure on equity prices to correct.
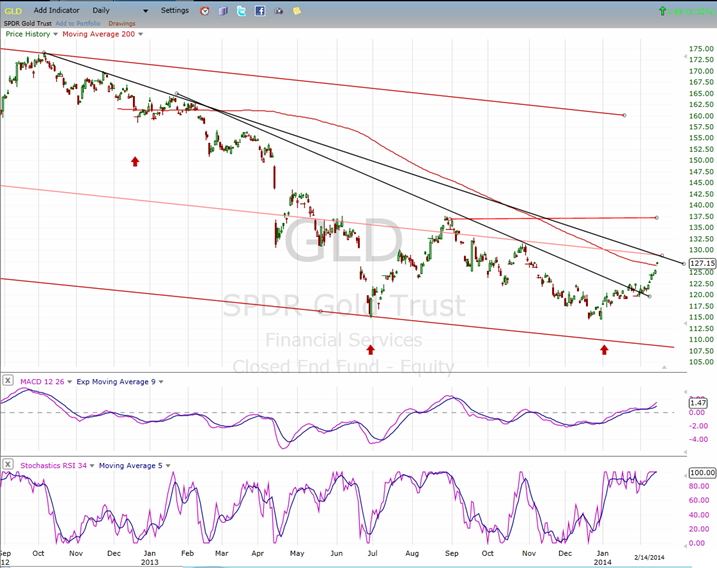
GLD (ETF for gold)
After a dubious start, the 25-wk cycle is finally performing its magic on the price of GLD. It was probably only a matter of getting over an intermediate trend line. Another one looms ahead reinforced by the 200-DMA and a mid-channel line. This could prove to be some tough resistance for GLD. But it may have built enough of a base to overcome it and move near the level of its former top where it will run into additional resistance.
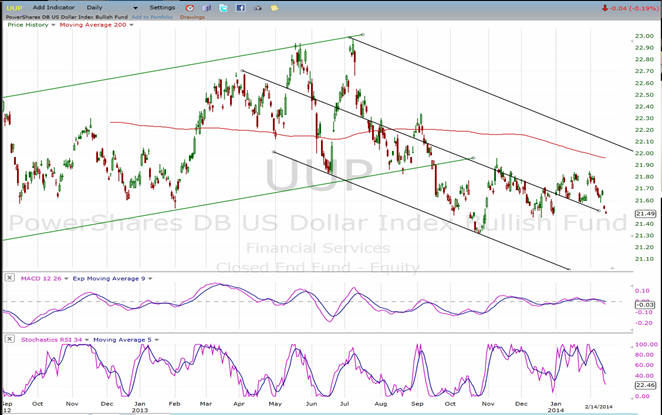
UUP (dollar ETF)
In the last newsletter, I suggested that UUP might have to pull back if it could not extend its price gain beyond the former short-term high. After making a small triple top at about 21.85, this is what it has done.
If it were not for the fact that its oscillators have turned down with the SRSI still a ways from being oversold, I would think that the mid-channel trend line would act as support. Now I am not so sure. If it does continue lower and breaks below the 21.40 level, it could go and re-test its former intermediate trend low of 21.32.
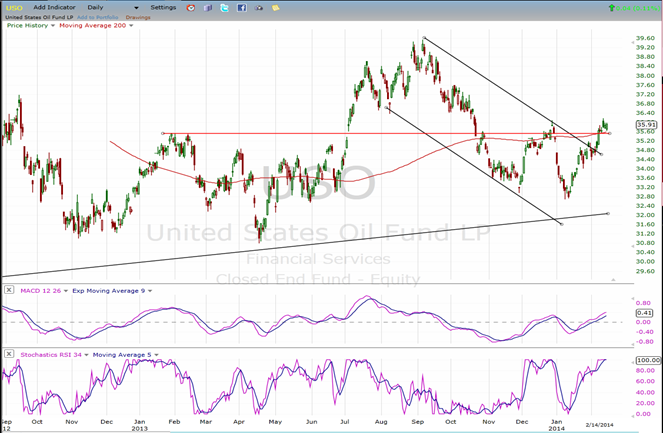
USO (United States Oil Fund)
It looks as if USO is finding resistance at its previous short-term peak. With its SRSI overbought it could be ready for a pull-back below the resistance created by the former short-term tops and the 200-DMA. If it can overcome this resistance, it could push up to about 38.
Summary
SPX continued to rally strongly for the second week, rising to less than 10 points from its former high -- and, for the second week, leading indexes continued to lag! This should wave a yellow flag about the longer term trend, with the market action in the days ahead telling us whether it turns to red or back to green once again.
Short term, hourly oscillators are warning us that the overbought condition is due for a short-term correction.
********
FREE TRIAL SUBSCRIPTON
Market Turning Points is an uncommonly dependable, reasonably priced service providing intra-day market updates, a daily Market Summary, and detailed weekend reports. It is ideally suited to traders, but it can also be valuable to investors since highly accurate longer-term price projections are provided using Point & Figure analysis. Best-time reversal estimates are obtained from cycle analysis.
For a FREE 4-week trial, send an email to: [email protected]
For further subscription options, payment plans, weekly newsletters, and for general information, I encourage you to visit my website at www.marketurningpoints.com. By clicking on “Free Newsletter” you can get a preview of the latest newsletter which is normally posted on Sunday afternoon (unless it happens to be a 3-day weekend in which case it could be posted on Monday).
The above comments and those made in the daily updates and the Market Summary about the financial markets are based purely on what I consider to be sound technical analysis principles. They represent my own opinion and are not meant to be construed as trading or investment advice, but are offered as an analytical point of view which might be of interest to those who follow stock market cycles and technical analysis.

When Andre Gratian was a stock broker years ago, a friend introduced him to technical analysis of the market. Consequently, it is not an exaggeration to say that Andre fell in love with this approach! Ever since then, it has become an increasingly important part of his professional life. Gratian has studied the works of Wyckoff, Edwards & Magee, Edward J. Dewey (cycles) and many others. However, one of my most profitable undertaking has probably been to study Point & Figure charting, which he finds invaluable in analyzing stocks and indices. If he were restricted to one methodology, this is the one that he would choose. This well-rounded background has given him what he feels to be a special insight into the stock market, facilitating the recognition of meaningful patterns and the ‘turning points’ in all trends, whether they be short or long term. Andre feels very comfortable discussing the stock market and passing on meaningful information to others. His subscribers include individuals and money managers throughout the world. Moreover, his Newsletters are currently published on several financial sites, here and abroad.


