Market Turning Points


Precision timing for all time frames through a multi-dimensional approach to technical analysis: Cycles - Breadth - P&F and Fibonacci price projections and occasional Elliott Wave analysis
“By the Law of Periodical Repetition, everything which has happened once must happen again, and again, and again -- and not capriciously, but at regular periods, and each thing in its own period, not another’s, and each obeying its own law … The same Nature which delights in periodical repetition in the sky is the Nature which orders the affairs of the earth. Let us not underrate the value of that hint." -- Mark Twain
Current position of the market
SPX: Very Long-term trend – The very-long-term cycles are in their down phases, and if they make their lows when expected (after this bull market is over), there will be another steep decline into late 2014. However, the Fed policy of keeping interest rates low has severely curtailed the full downward pressure potential of the 40-yr and 120-yr cycles.
Intermediate trend – New uptrend still in doubt
Analysis of the short-term trend is done on a daily basis with the help of hourly charts. It is an important adjunct to the analysis of daily and weekly charts which discusses the course of longer market trends.
MORE CONSOLIDATION/CORRECTION NEEDED
Market Overview
After a 110-point rally to 1848, SPX started to correct but only declined 23 points before the bulls sent it right back to 1845 by Friday. However, it became obvious that the index was struggling to get and stay above 1841 and by the end of the day, it had retraced to 1837.
There are several ways to construe the current SPX action:
- This was a successful test of the high, and the index is ready to resume the decline which started at 1850. (10% chance at this time).
- 1738 was the bottom of the A wave of a large correction; 1845 was the top of the B wave, and we are now embarking on a wave C. (20%)
- After the rally to 1848, the decline to 1825 was a minor wave “a” followed by “b” to 1845, and we may have just started wave “c”. After completion of this pattern, the index will be ready to make new highs. (30% probability).
Note that these probabilities will have to be adjusted with the market action of the next few days. A little later we will again look over the leading indexes which are currently lagging. Only (1) and to some extent (2) would explain their behavior. That’s why near-term market action is a little murky, and we’ll just have to wait for it to clarify its intentions.
It does not come as a surprise that more consolidation is needed. I believe that I mentioned last week that the weekly indicators did not look ready to accommodate a new high right away. Also, by the time that we reached 1738, the daily indicators were in a good position to start and support a rally, but as of now, they look more ready to correct than to send the market higher and just a minor pull-back may not be enough to reset them for another uptrend. Hopefully, the murk will clear up over the next few days.
Chart Analysis
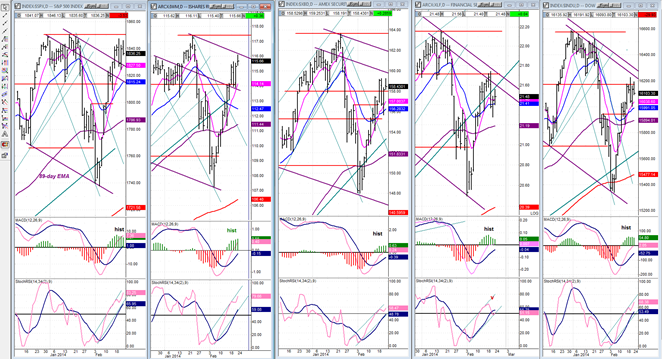
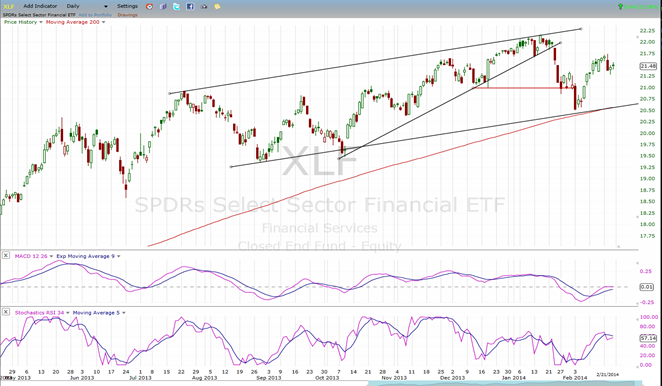
I think that the behavior of the leading indicators which are trailing SPX instead of leading it is significant. Therefore, I intend to continue posting those charts until whatever they are telling us is resolved. To the three selected earlier, I have added XLF which also has an excellent reputation for calling market tops and which has also shown some notable relative weakness to SPX lately. It has fooled us before, so we’ll see if this divergence is here to stay, or if it’s just a temporary phenomenon. We should also remember that in 2007, it started to show divergence to the SPX by approximately 5 months. So it may not necessarily be predicting that the market decline will start on Monday – or is it?
The action of XLF last week was intriguing. The other three indexes (IWM, XBD, and DJIA) rallied along with SPX until Friday, but not XLF! It had a rather sharp drop on Wednesday, and by Friday, it ended the day well below Wednesday’s high. I am not going to build a whole bearish scenario just on that, but it’s something worthy of notice.
Of the other three, IWM had the best performance, while XBD and DJIA competed for silver and bronze. Overall, the divergence with SPX continues to be significant.
(You probably know that if you want a closer look at any of the charts in this letter, you can click on the + sign above the page and enlarge it to meet your need.)
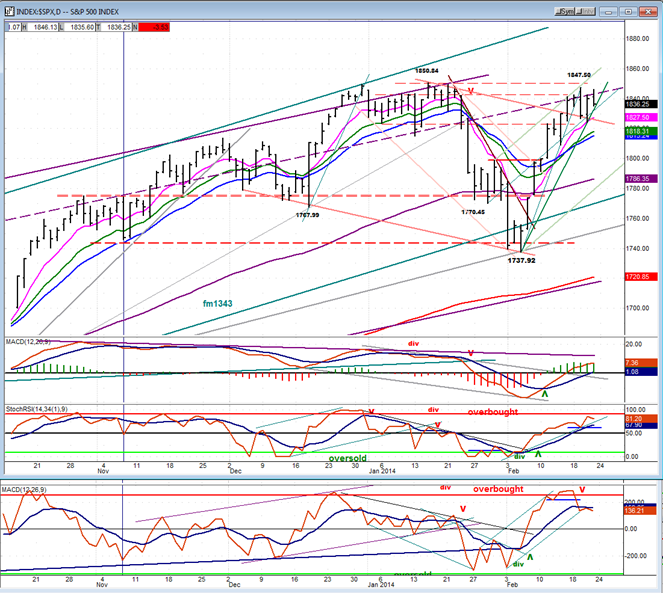
Let’s now look at the SPX daily chart in a little more detail. The rally from 1738 took it to within 3 points of the all-time high before correcting, but the correction was not really proportionate to the rally. A minor a-b-c correction is the least we should expect… and we would have every right to expect more! Perhaps this is what is brewing. When we first started to correct, I thought that a pull-back to about 1800 would be reasonable since it would be down to a good support level and retracing a little less than 50% of the previous rally. Why don’t we make this possibility 4) in Market Overview above, and give it a rating of 70% for now! Considering the state of the daily indicators which have already turned down with the A/D lines making a bearish cross, it’s not an outlandish expectation. The price MACD has not yet turned down, but the histogram has and the entire rally of the MACD looks weak relative to the price rally, so we have negative divergence there also.
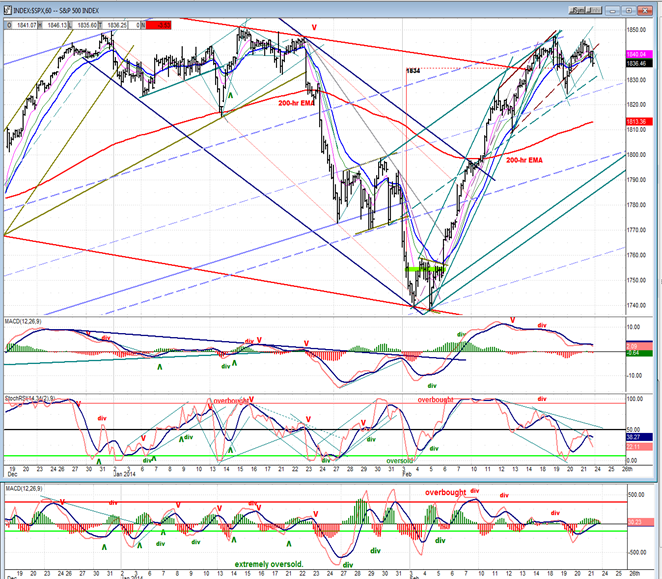
For good measure, let’s take a look at the SPX hourly chart and see if it sheds some light on the current market action.
By the time that the rally reached 1834 -- which was the most I could legitimately get out of the P&F base -- the SPX was already decelerating (angling away from its top channel line and crowding the bottom one) and was overbought with negative divergence showing in the indicators. Nevertheless it kept on going, slicing through overhead resistance with little difficulty. Perhaps it was influenced by the NDX which was making new highs. In any case, it is becoming clear that the shortened correction was not enough because, when the SPX tried to extend its uptrend, only the most sanguine bulls chased prices.
This is obvious when we look at the indicators. All the MACD could do was to go flat while prices were rising, and it could not even achieve a bullish cross. The SRSI could only go to neutral and refused to become positive, turning down again at the first opportunity. Pretty much the same overall behavior took place in the A/D indicator which continued crawling along the zero line.
The index looks in need of more correction/consolidation before attempting to go higher. But any more corrective behavior from here will complete the reversal of the daily indicators and send them in a downtrend. As I will explain next, there is also good reason to correct from a cyclical standpoint. So, all in all, a “normal” correction of about 50% retracement would be, well, “normal”!
 Cycles
The best interpreter of the Kress cycles is Clif Droke. He was a close friend of Bud Kress. He writes about them often, but does not give too much detail. I had mentioned several times earlier that a Kress cycle was expected to make its low around the 21st. As Clif explained (but only recently), it was actually a nest of cycles, some topping and some bottoming at the same time, and it seems that the topping ones won out. Perhaps they will continue to dominate the market by now exerting pressure during their descending phase. It would make sense in view of the way the market is currently behaving.
And, of course, the time is getting shorter and shorter to the anticipated lows of the long-term cycles, so the market should gradually follow the line of least resistance.
Breadth
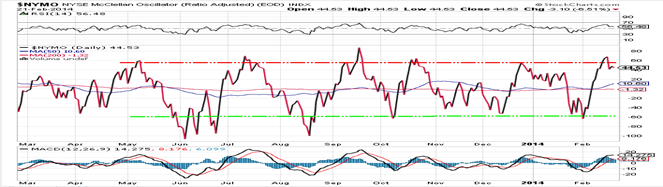
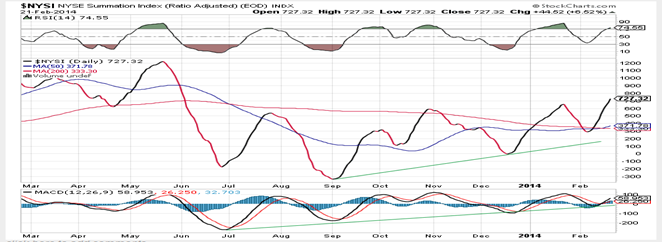
Charts of the McClellan Oscillator and Summation Index appear below (courtesy of StockCharts.com)
The McClellan oscillator has found resistance at the level of the red overbought line. If it follows its “normal” behavior, it should retrace down to the green oversold line or close to it. Should it do this, a correction of about 50% of the rally would be feasible.
The NYSI has profited from the NYMO’s positive readings to continue its uptrend. Nevertheless, it is a long way from its May high and we would have to say that this spells long-term negative divergence. As a result of its continual rise, its RSI has reached the overbought level once again while pronounced negative divergence is evident in its MACD. That should help the potential scenario outlined earlier for the SPX.
Sentiment Indicators
The SentimenTrader (courtesy of same) long-term indicator remained at a moderately negative reading of 60 for the second Friday in a row. This has no particular forecasting value.
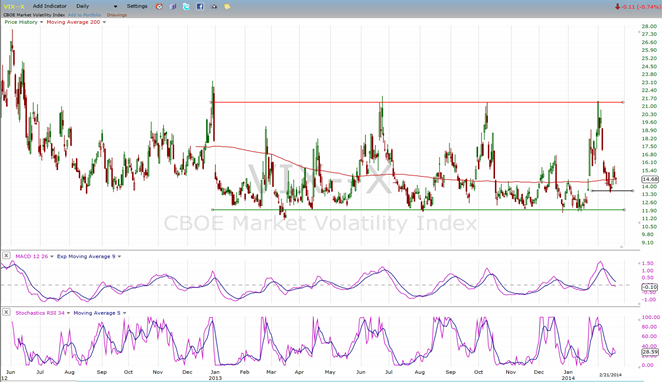
VIX (Velocity Index)
VIX has been bouncing back and forth in a well-defined range for all of 2013. The tops have been indicative of market bottoms coming quickly (the result of brief downward corrections) while the bottoms have taken more time to form -- indicative of more protracted uptrends.
The recent pull-back by VIX has remained well above its last low. Note that during that time SPX rallied to within 3 points of its former high. That’s significant divergence which is breaking the regularity of last year’s pattern. Is it a warning that a change in the market pattern is in process? We’ll soon find out, but it is worth noting – along with the lagging leading indexes!
XLF (Financial Index)
I briefly touched on XLF earlier. Here we can see clearly the deceleration that is taking place. On the last rally, XLF stayed well away from its former top like VIX (above) telling us that something may be changing in the market behavior.
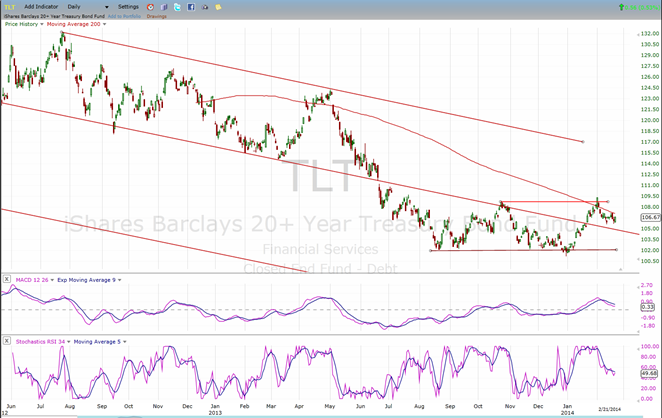
TLT (Barclays 20+ year Treasury Bond Fund)
After making a double bottom, TLT found resistance where it had before and pulled back slightly. This time, the rally also stopped at the 200-DMA. The lack of downward pressure could soon lead to a breakout on the upside with the index heading for a new recovery high. The next resistance level starts at about 115.
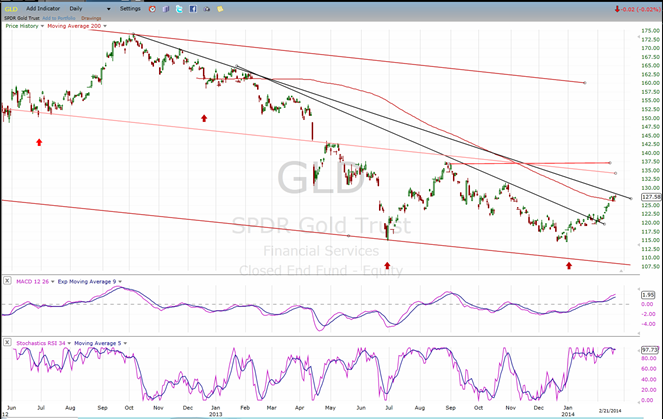
GLD (ETF for gold)
GLD’s upward progress was stopped by another downtrend line as well as the 200-DMA. So far, this has not pushed prices back and the upward pressure of the 25-week cycle (which should last for a while longer) may push the index through the resistance zone and on its way to its base count of 134.
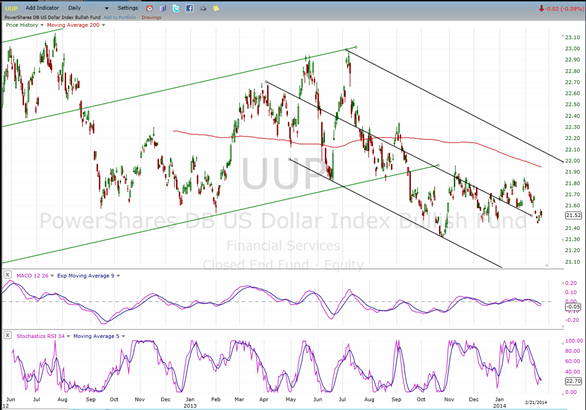
UUP (dollar ETF)
As expected, UUP is finding support – at least temporarily – at the level of former lows which coincide with a return to the mid-channel line. Not much is expected of this index in the near future. Perhaps it is building a base for more bullish prospects in the days and weeks to come.
USO (United States Oil Fund)
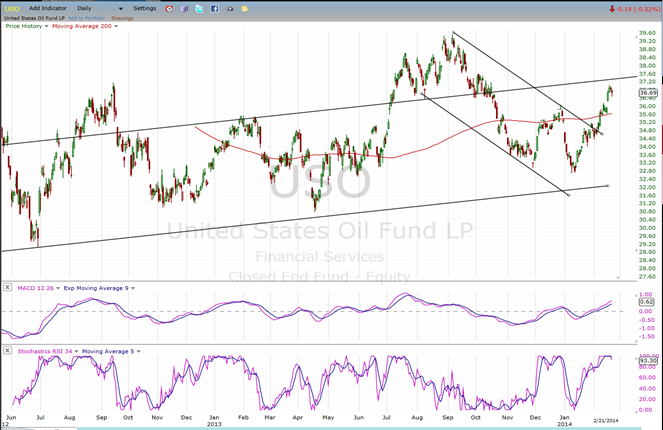
USO followed through and clearly broke out of its short-term down channel, but its prospects for more upside progress may be limited. It has now arrived at a zone of resistance with various overbought indicators which could put an end to its upward move. Let’s see how much of a retracement it makes during the forthcoming, near-term correction.
Summary
A change of mood appears to be shaping up in the stock market. I have alluded to the behavior of some of the leading indicators, of the VIX, etc… SPX also looks as if it may be making a short-term double top.
So far, this may be only an indication that the market needs more time to catch its breath before attempting to make a new high, but if this unfamiliar behavior is prolonged, we may be dealing with more than a short-term correction.
********
FREE TRIAL SUBSCRIPTON
Market Turning Points is an uncommonly dependable, reasonably priced service providing intra-day market updates, a daily Market Summary, and detailed weekend reports. It is ideally suited to traders, but it can also be valuable to investors since highly accurate longer-term price projections are provided using Point & Figure analysis. Best-time reversal estimates are obtained from cycle analysis.
For a FREE 4-week trial, send an email to: [email protected]
For further subscription options, payment plans, weekly newsletters, and for general information, I encourage you to visit my website at www.marketurningpoints.com. By clicking on “Free Newsletter” you can get a preview of the latest newsletter which is normally posted on Sunday afternoon (unless it happens to be a 3-day weekend in which case it could be posted on Monday).
The above comments and those made in the daily updates and the Market Summary about the financial markets are based purely on what I consider to be sound technical analysis principles. They represent my own opinion and are not meant to be construed as trading or investment advice, but are offered as an analytical point of view which might be of interest to those who follow stock market cycles and technical analysis.

When Andre Gratian was a stock broker years ago, a friend introduced him to technical analysis of the market. Consequently, it is not an exaggeration to say that Andre fell in love with this approach! Ever since then, it has become an increasingly important part of his professional life. Gratian has studied the works of Wyckoff, Edwards & Magee, Edward J. Dewey (cycles) and many others. However, one of my most profitable undertaking has probably been to study Point & Figure charting, which he finds invaluable in analyzing stocks and indices. If he were restricted to one methodology, this is the one that he would choose. This well-rounded background has given him what he feels to be a special insight into the stock market, facilitating the recognition of meaningful patterns and the ‘turning points’ in all trends, whether they be short or long term. Andre feels very comfortable discussing the stock market and passing on meaningful information to others. His subscribers include individuals and money managers throughout the world. Moreover, his Newsletters are currently published on several financial sites, here and abroad.


