Market Update For Late August


August 2019 is a tough market to comment on. All this week it appeared the stock market was successful in smoothing out the extreme volatility it’s seen in the past month. Then Friday (today) after just one tweet from President Trump on the growing trade tensions between the Communist Chinese Party (CCP) and the USA, the Dow Jones dropped over 600 points, a -2.37% decline from yesterday’s close.
What else is happening in the world today that a tweet from President Trump could cause a similar, or greater market decline? I’m thinking about the pending unsealing of court documents in the Jeffrey Epstein’s pedophile court case from years ago that is going to name BIG NAMES. Hillary’s e-mail scandal, as well as the pending investigations of the Clinton Foundation are going to produce wide spread shock waves in the political landscape of Washington DC when they too are made public. And you know they will be made public, because that is why the establishment and its MSM hate President Trump so much.
Then too Joe Biden, now running for president for the 2020 election has had some very corrupt dealings while serving as vice-president under Obama, as reported by Dick Morris below.
This sorry list our main-stream (FAKE NEWS) media apparently has no knowledge of goes on and on. There’s no shortage of pending tweets from President Trump that could take the Dow Jones Index down a 1000 points or more in a single trading day.
But as this is primarily a financial report I have to say what the real problem the current market has; it’s overvalued to the point where a tweet from President Trump can result in a big daily, greater than 2% decline in the stock market. It’s no more complicated than that, and for that reason I can’t bring myself to become bullish on this market.
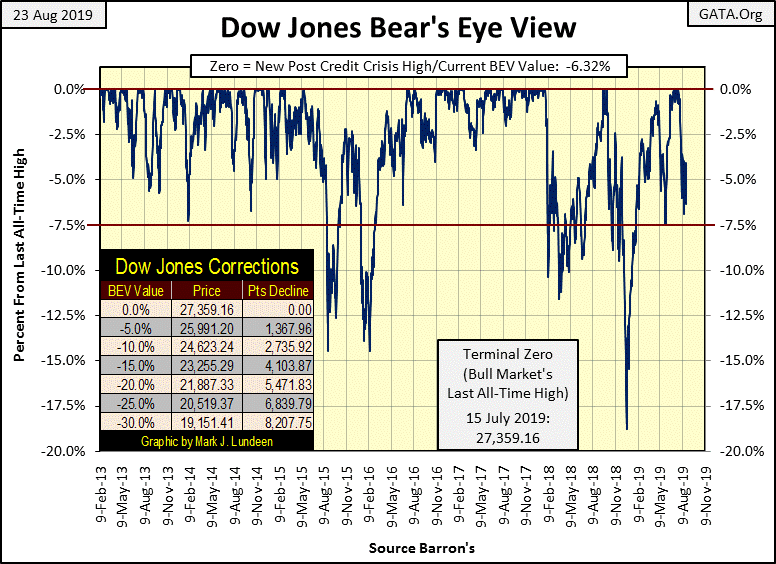
Looking at the Dow Jones BEV chart below; what’s next? Will the Dow Jones break above its BEV -5% or break below its -7.5% line. I don’t care to risk a prediction on either possibility. I’m remaining a spectator and just watch what ever does happen.
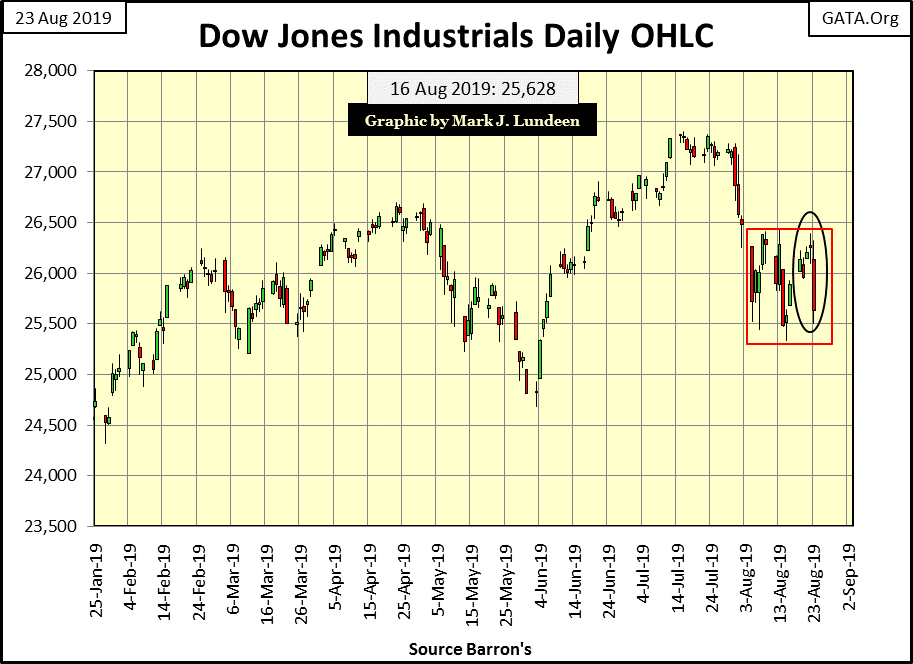
This is a tough market to attempt a market prediction. Look at the Dow Jones in daily bars below. Last night I was ready to call a temporary suspension on my bearish market commentary, then today’s day of extreme volatility (a 2% move) for the Dow Jones happens and I’m glad I didn’t.
One thing to note on the chart below is the Dow Jones really hasn’t done much for either the bulls or the bears these past three weeks; fifteen NYSE trading sessions with some big daily moves that didn’t take it outside of its current trading range.
This won’t last forever. Next week or next month the Dow Jones should make a decisive (big) break out of the red box below containing the past three weeks of market action. Whether that breakout is to the up or downside most likely will be how the market goes for the rest of 2019.
Bear that I am, I’m thinking the Dow Jones will deflate below 24,000 on its next significant move. But the bulls could be right, in which case we’ll see a few more all-time highs for the Dow Jones below. So who is right? The choice is yours, but the safe position would be in remaining neutral in a market like this; an aging advance that began over ten years ago. After all there are plenty of times when staying out of the market is the smart thing to do, and I would say this is one of those markets.
Then there are the bearish techniques that are available; shorting the market or buying put options. I’ve never had any luck with those. As I’m not an investment advisor by any legal definition, I’m not going to suggest these bear market strategies to my readers, though they might prove to be the correct thing to do here in the last week of August.
What I do feel safe is recommending the reduction of one’s exposure to the stock market to the point my readers feel comfortable with, and begin placing their capital in precious metal assets. Way back in the 1970s and 80s an investment rule of thumb was an allocation of 5% to 10% of investment funds should be committed to gold and silver. That seems a prudent thing to do today, and I wouldn’t attempt to talk anyone out of committing an even larger allocation of capital to precious metals and their miners in our uncertain world.
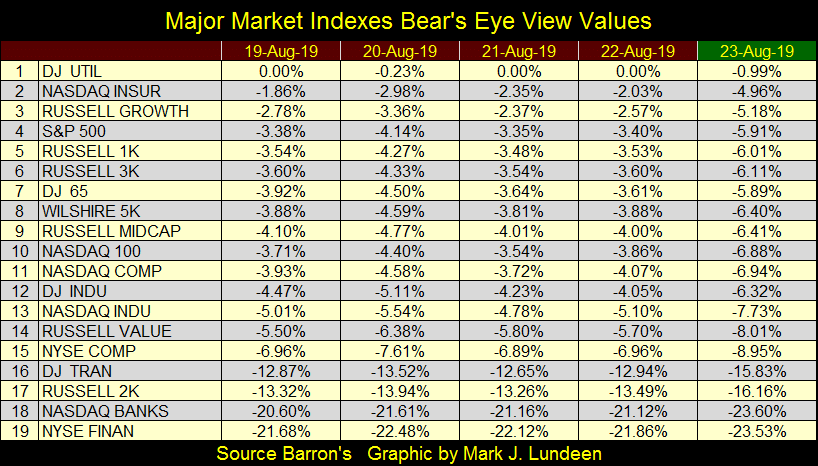
Like the Dow Jones, the other major market indexes I follow were doing fine, until Friday. And except for the Dow Jones Utilities (#1 below), the other indexes at the close of Friday also saw extreme moves from their Thursday’s close.
I have Dow Jones earnings data going back to April 1929, and it’s amazing how earnings for the Dow Jones and CinC have lined up for the past ninety years; with one dollar in Dow Jones earnings for about every one billion dollars of CinC. It’s not as if Dow Jones earnings and CinC are bolted together; they’re not. But when studying the two plots in the chart below, it’s hard not seeing an inflation component in the Dow Jones earnings.
Still, how monetary inflation (CinC / Red Plot) flowing from the Federal Reserve created earnings for the Dow Jones (Blue Plot) was different before 1979 than it was after 1979.
-
From 1929 to 1979 (chart insert), rising CinC acted like rising water levels, lifting Dow Jones earnings up as CinC increased to ever higher levels.
-
From 1979 to today, CinC functioned as a hard ceiling to Dow Jones earnings, as its earnings oscillated wildly.
One has to wonder why the change, and what made the Dow Jones’ post 1970s earnings different from previous decades? My opinion is when the US Treasury decoupled the dollar from the Bretton Woods $35 gold peg, many instabilities were introduced into the financial system, of which one can be seen in the Dow Jones earnings below.
What other instabilities also came with the dismantling of the Bretton Wood’s $35 gold peg? In August 1971 futures traded in the market were mostly, almost exclusively for agricultural products to basically hedge whether it rained or not in the Mid-West.
Since 1971, hedging risks in the futures market has expanded to include risks in the financial markets, including risks in market volatility, interest rates and bonds, currencies and many of other items. In fact as far as the futures markets are concerned, their primary function today is to hedge the post-Bretton Wood’s financial system’s risks than their original, but still important agricultural markets.
I placed four stars on the chart, at those points in the post-Bretton Woods’ economic order where, for a short time, once again saw $1 of Dow Jones earnings for every $1Bil of CinC, as was frequently the case before 1979. However, after 1979 following each earnings advance up to the CinC plot, the Dow Jones then saw an earnings collapse.
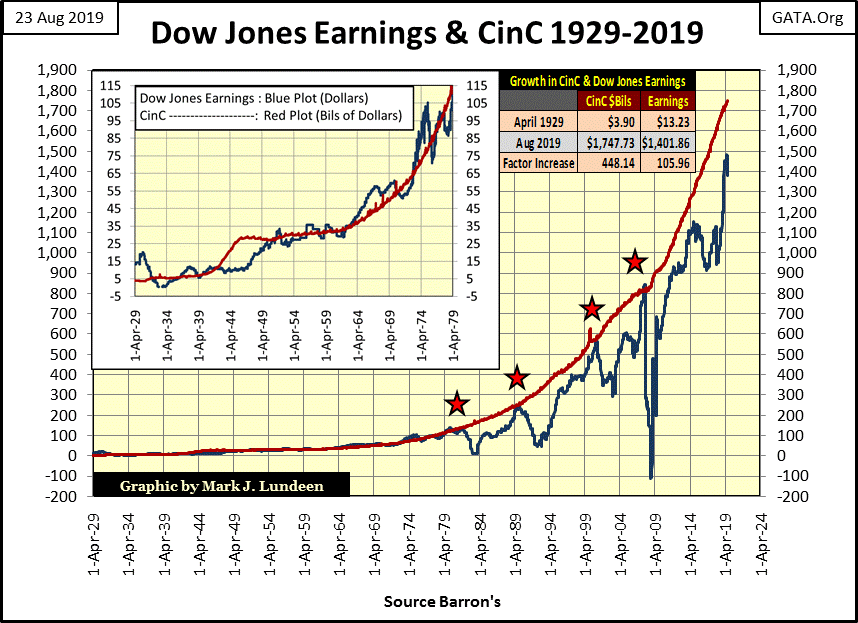
But you’ll note there are only four stars in the chart, while since 1979 earnings for the Dow Jones has attempted to break above the CinC plot six times; the last two in 2014 and now again in 2019 failed to touch the red CinC plot above. What’s the problem? Is “liquidity” flowing into the financial markets finding it increasingly difficult to flow into corporate earnings?
Looking at the earnings spike for 2019, the Dow Jones so far saw its maximum earnings just last month (July) with $1470. But now in August, earnings have declined to $1359, down 7.5% at the end of this week.
Are we going to see yet another boom / bust cycle in the Dow Jones earnings? It’s been doing so since 1979, and now since last month Dow Jones’ earnings have deflated by 7.5%. I’m not making a prediction here. But I will draw your attention to the chart above and let you come to your own conclusions.
Here’s another item that may impact the near-term outlook for corporate earnings; according to a former employee, Disney has been cooking their books for years. Read all about it in the link below.
After an investigation by the SEC, we may find Disney’s balance sheet as pure as the driven snow. But the SEC is a conflicted-market regulator; what action did they take after the 2007-09 sub-prime mortgage debacle? Nothing I’m aware of, so I’m not quick believing earnings for Disney are all they, their accountants or the SEC would have us believe.
If this is true with Disney, who else has been cooking their books? With October only a few weeks away, a month that frequently sees bad things happen in the financial markets, it will be interesting following Dow Jones earnings in the next few months.
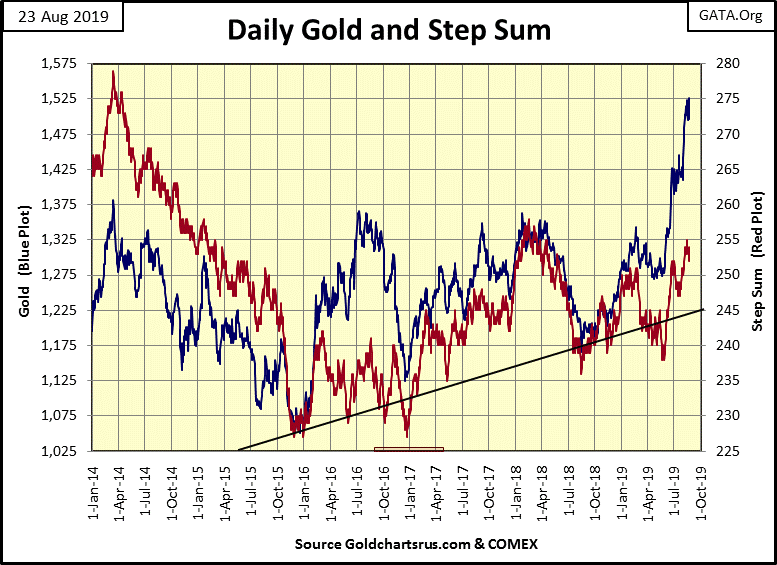
Today, the stock market’s loss was gold and silver’s gains, with both of the old monetary metals advancing nicely as everything else trading on Wall Street deflated. We still haven’t seen a day of extreme market volatility in the gold market (+/- 3%) or silver (+/- 5%) since late 2016. With gold advancing as seen below, maybe it’s best we don’t see a day of extreme volatility for a while.
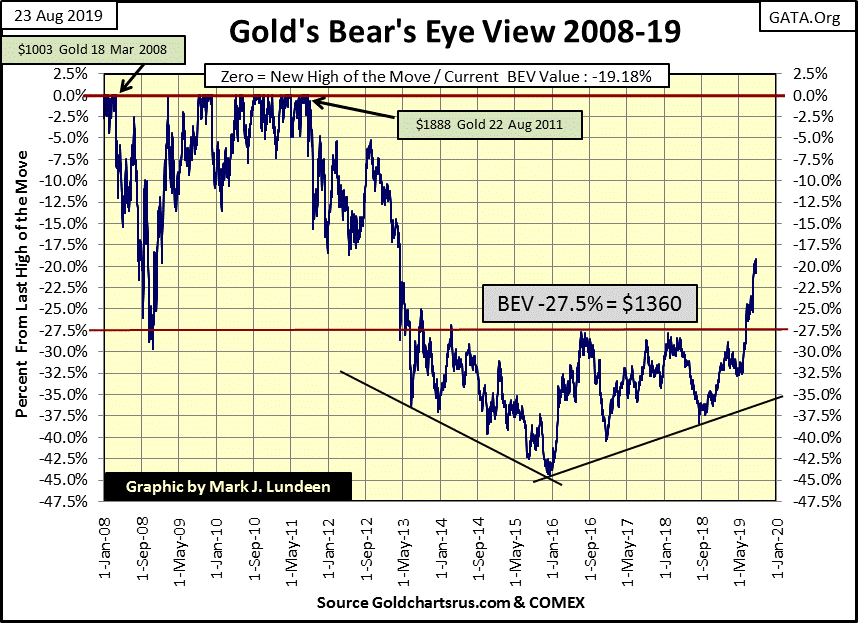
In gold’s step sum chart below, market reality (the price of gold / blue plot) continues an advance that began last summer (July 2018), with market sentiment (red plot) falling in line. That’s not how it was from February to June of this year, when a small decline in the price of gold resulted in a disproportionate number of down days.
But with June all that changed, with gold and its step sum advancing nicely since.
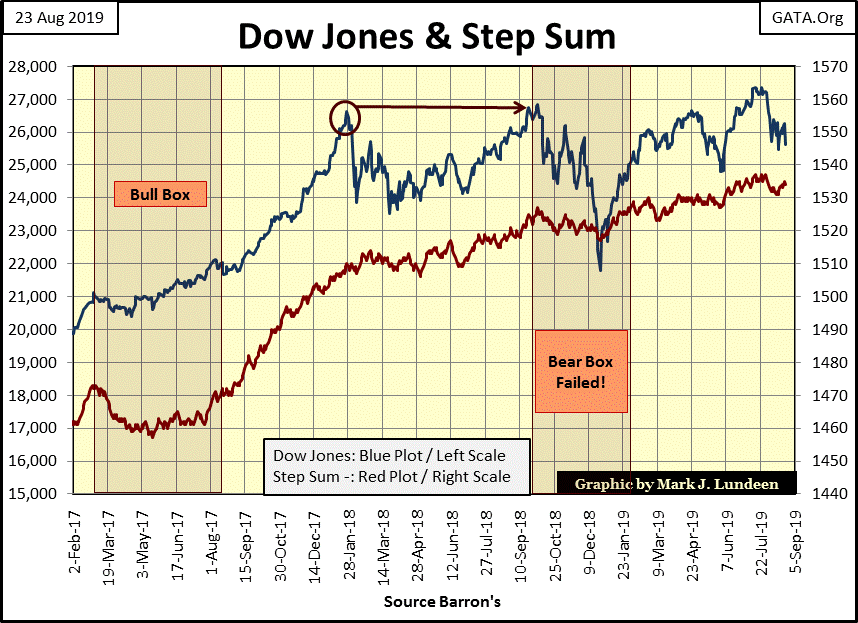
The Dow Jones (Blue Plot) in its step sum chart below won’t go up, and apparently can’t go down either as market sentiment (Red Plot) continues to rise. After the 18% correction from October to December of last year, I’d have thought the Dow Jones capable of doing much more to the upside, but it hasn’t. This struggle to climb above into the 30Ks has been going on since January 2018. Why is the Dow Jones still trading in the 25K range?
I don’t know, but such lackluster market action doesn’t inspire confidence the bulls are going to accomplish much in the months to come.
Gold closed at its highs of the past twenty-five trading days. Its step sum is advancing, and daily volatility has increased from 0.49% at the end of July to close the week at 0.54%; all positive indications of better things to come in the gold and silver markets.
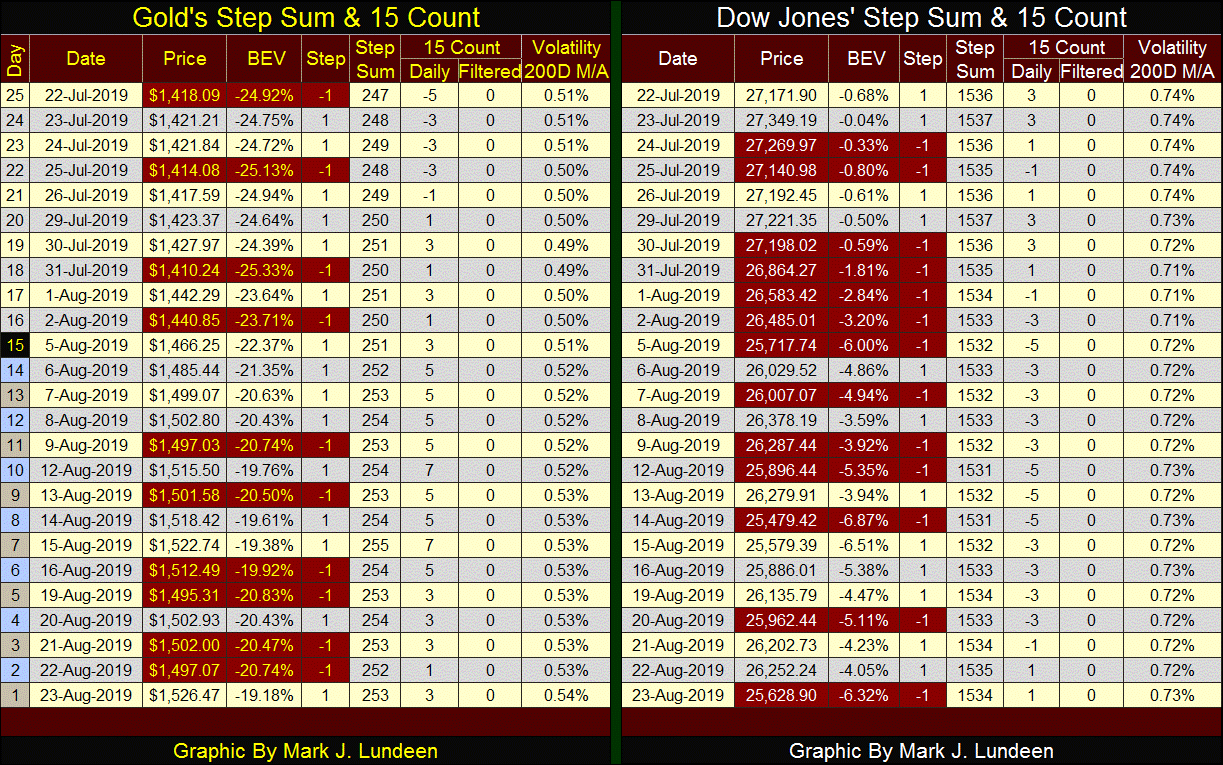
On the other hand the Dow Jones struggles. Since July 22nd it’s seen more down days than advances, which isn’t necessarily a bad thing. Markets can see big advances during periods of overwhelming daily declines; but that isn’t what the Dow Jones is doing. No it’s trending down and that isn’t good
Summing up this week’s market action; gold and silver investments are acting much better than is the Dow Jones, my proxy for the broad stock market. That said, in late August it’s hard coming to grips with the potential these markets have for investors, the potential for losses in the stock and bond markets and the potential for gains in precious metals.
But with the markets there is always the next day, week and month. Come September we’ll discover answers to questions we found so perplexing in August, while the markets create even more questions that demands answers from us. But if you’re a market buff, as I am, that’s what makes following the markets so much fun.
Mark J. Lundeen
********
More from Gold-Eagle


