Midas Touch Gold & Silver Update


Arguments for lower prices:
- 3-years downtrend: Overall Gold still is in a downtrend. US$1,525.00 remains the line in the sand. Gold will need much more time to break through this heavy resistance. Only a move above US$1,390.00 and especially US$1,430.00 will indicate that the mid- and longer-term trend indeed has changed.
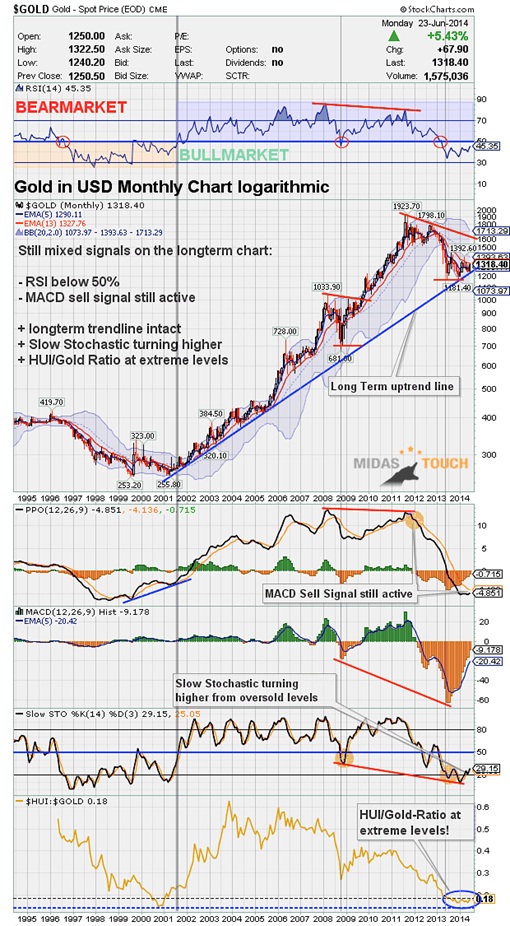
- Gold Monthly Chart: MACD sell signal active since November 2011 (this is extremely powerful and needs to change before one can really call the bottom). It looks like MACD could create a buy signal within the next 1-2 months. RSI still below 50 and in bear market territory.
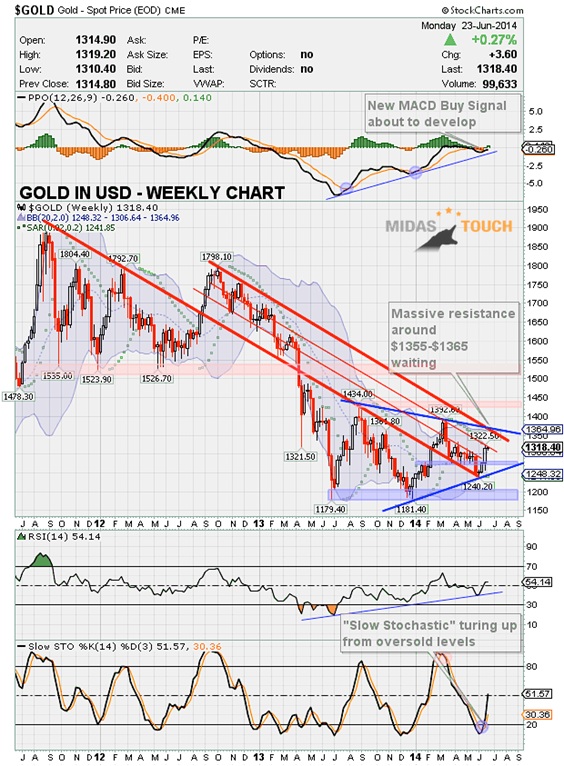
- Gold Weekly Chart: Gold moving sideways and into a triangle. No bullish indication yet. The chart remains basically neutral.
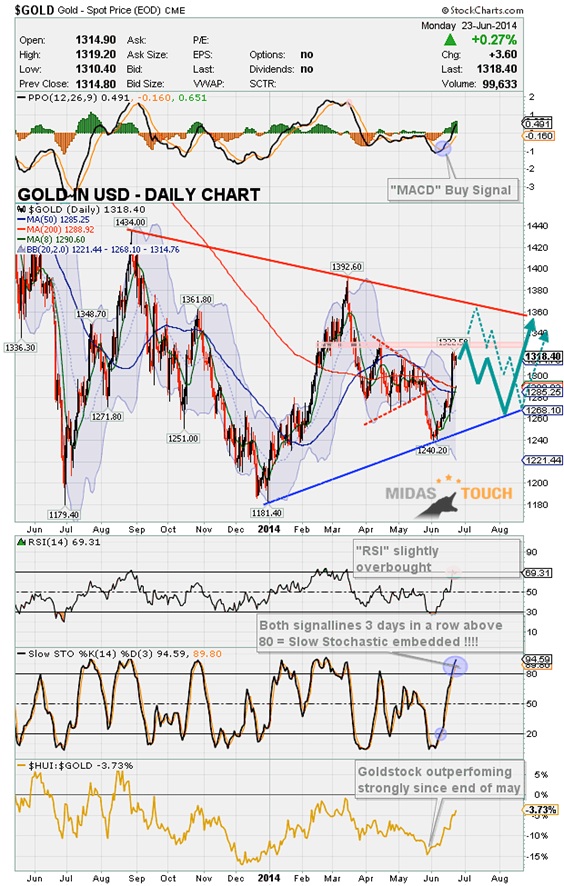
Gold Daily Chart: Gold for the 3rd day outside Bollinger Bands and RSI already overbought.
Arguments for higher prices:
- Short Squeeze: After a nasty shakeout and mini crash end of may, Gold found support at the long-term uptrend line around US$1,240.20. Since then Gold did not only recover towards the 50-MA (US$1.285,25) and the 200-MA (US$1,288.92) but posted an explosive US$45,00 gain on last Thursday due to heavy short covering.
- Higher Low: The uptrend since the beginning of the year is still valid. The correction since march did not reach a new low below last december´s US$1,180.00 instead Gold turned higher from US$1,240.20. This is extremely positive because we now have a series of higher lows. The market will soon want to figure out if the lower high at US$1,395.00 (from march) is still valid.
- Gold Monthly log-Chart: Longterm trend-line has hold recent test at US$1,240.20. Any move below US$1,240.00 - US$1,250.00 is highly unlikely and would mean the end of this bull market!
- Gold Weekly Chart: Since May 2013 Gold is moving sideways between US$1,180.00 and US$1,434.00. The current triangle still offers more upside potential for the bulls. Maximum would be the upper Bollinger Band (US$1,264.96) where we can find the downtrend line of the triangle. Also parabolic SAR has issued first buy signal since mid of march. RSI neutral while Slow Stochastic oversold and with a new buy signal.
- Gold Daily Chart: Yesterday Gold has closed for the third day outside its Bollinger Band (US$1,314.76). Bulls are clearly in charge and could push prices higher. But five to six days in a row above the Bollinger Band is the absolute maximum and the move will become very unsustainable. So expect this wednesday (Gold option expiration) or latest friday the start of larger consolidation/correction targeting at least the 200-MA (US$1,288.92).
- Gold Daily Chart: Slow Stochastic with both signal lines above 80 = embedded Status and therefore locking in the uptrend.
- Gold/Silver Ratio: Down from 67.46 to 63.01. Silver clearly outperforming Gold since end of april. Double top around 67.40 confirmed but uptrend not yet broken. Short-term the ratio is clearly oversold and could snap back soon.
- Gold-Stocks: Clearly leading the sector now. HUI Goldbugs Index is up around 18.3% in the last 3 weeks! Slow Stochastic is embedded, strengthening the uptrend.
- Sentiment: Kitco´s weekly Gold survey shows over 69% bulls for next week. There is still some more room to the upside until extreme sentiment but already current readings a sign to become careful and defensive soon.
- Inflation: As I have argued a couple of times since January I continue to expect higher inflation rates due to rising commodity prices in the second half of the year. Oil prices for example neared a nine-month highs late last week. The oil price risks due to the rapid advance of militants in Iraq will put inflation back in focus. Iraq is the second-largest OPEC producer and could destabilize oil markets.
Seasonality: Best time of the year starts in July and should typically last until next spring. After 3 years with heavy corrections in autumn I think this year we could see a sustainable rally into December.
Conclusion:
- Last time my assumption was wrong. Shortly after publishing my analysis, Gold broke down from a triangle and fell 6 days in a row down to US$1,240.20 (Lesson learned: No matter what, every year before the june low we will see a sell off first!!).
- After 2 days of bottom building Gold has strongly pushed higher since then.
- But in my eyes the recent big up day on last Thursday is a bull trap. There is still potential for the bulls to push prices higher either towards US$1,335.00 or even up to US$1,355.00-US$1,365.00 until end of this week.
- First week in July, I think Gold will start correction down to 200-MA (US$1,289.16) and later maybe even lower to test the longterm trend-line on the logarithmic monthly chart one more time.
- This should give us the final opportunity to buy Gold below US$1,300.00 (probably around US$1,270.00) in the first week of august. From there I expect a volatile but sustainable rally towards US$1,525.00 until November.
- Swing traders could start sell Gold short between US$1,355.00 and US$1,365.00 with a first target at US$1,295.00.
Investors with a long-term perspective need to be patient now and should continue to accumulate physical Gold below US$1,300.00 and physical Silver below US$20,50.
Longterm:
- Nothing has changed
- Precious Metals bull market continues and is moving step by step closer to the final parabolic phase (could start in summer 2014 & last for 2-3 years or even longer)
- Price target DowJones/Gold Ratio ca. 1:1
- Price target Gold/Silver Ratio ca. 10:1
Fundamentally, Gold should soon start the final 3rd phase of this long term bull market. 1st stage saw the miners closing their hedge books, the 2nd stage continuously presented us news about institutions and central banks buying or repatriating gold. The evolving 3rd and finally parabolic stage will end in the distribution to small inexperienced new investors who will be subject to blind greed and frenzied panic.
********
Germany
E-Mail: [email protected]
Website: www.goldnewsletter.de
 Florian Grummes (born 1975 in Munich) has been studying and trading the Gold market since 2003. In 2008 he started publishing a bi-weekly extensive gold analysis containing technical chart analysis as well as fundamental and sentiment analysis. Parallel to his trading business he is also a very creative & successful composer, songwriter and music producer. You can reach Florian at: [email protected].


