Miners: End of the Bear Market?


The analysis of the past twenty years of the Miners Index is showing that an important bottom has been printed in December 2013. The Miners Index’s symmetrical sequence and also the relation between the Miners and the 78.6 Fibonacci Number (both in Price and Time) are validating this major low.
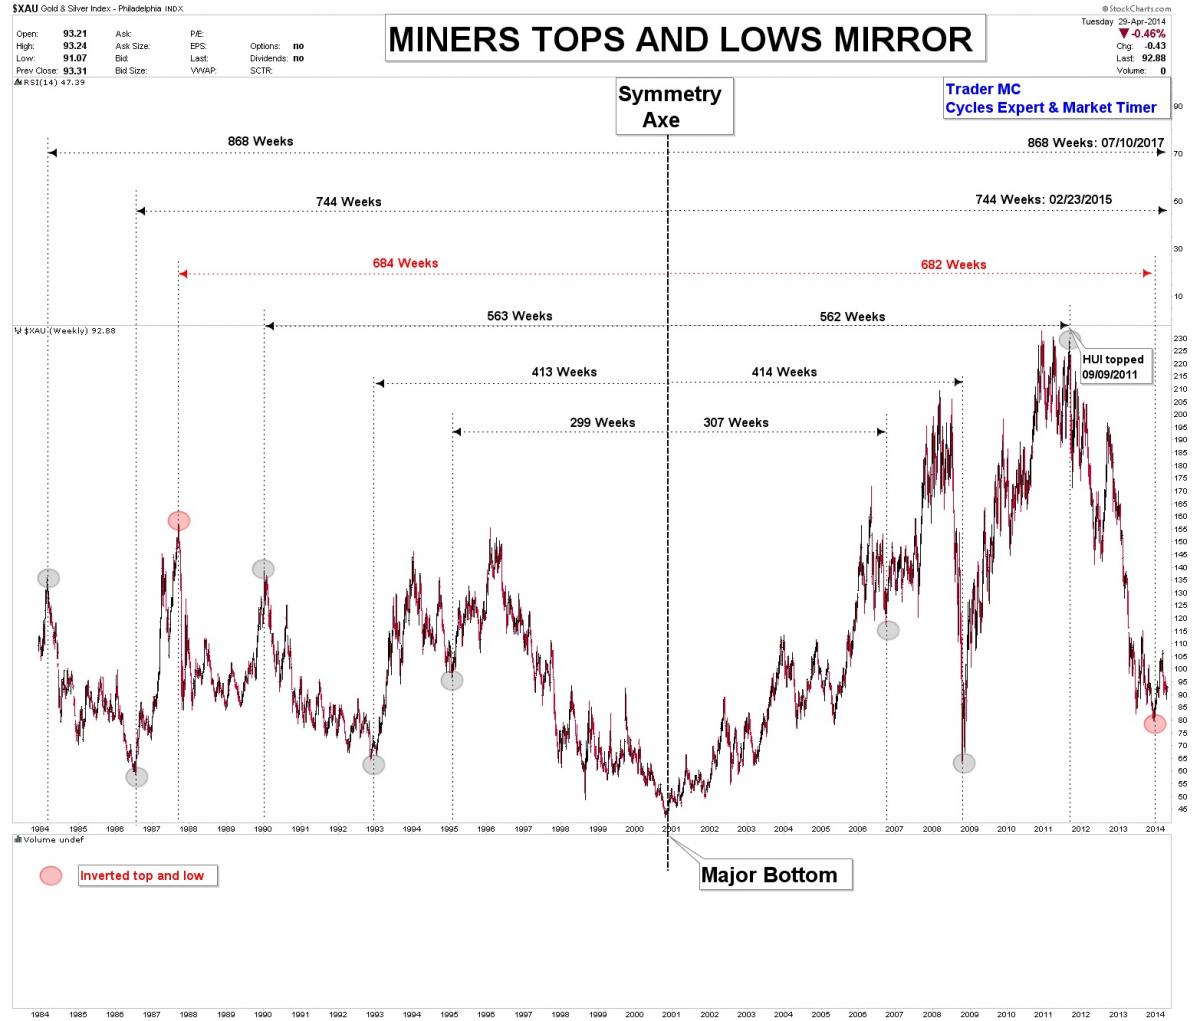
Markets like symmetry and the HUI Index is following an accurate symmetrical sequence. On the following chart you can see that major tops and lows are accurately symmetrical about their centerline (2000 major bottom). The only exception was 1987 top which matched with the low (or the inverted top) in 2014. The next symmetry turn dates are February 23, 2015 and July 10, 2017 which correspond to the periods of 744 and 868 weeks.
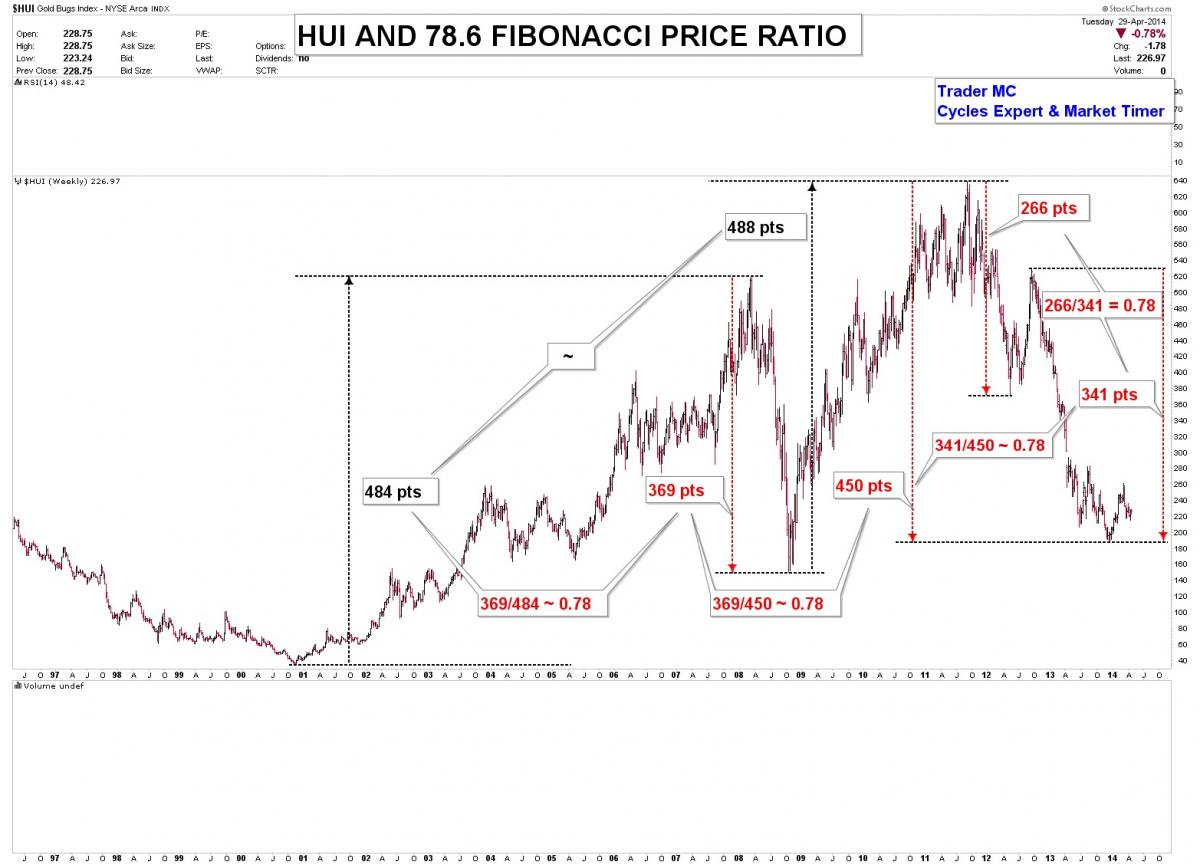
Another important criteria to take into consideration is the connection between the Miners Index and the 78.6 Fibonacci Number. The Miners Index is related to the 78.6 Fibonacci Number both in Price and Time.
On the following chart you can see the HUI Index and the 78.6 Fibonacci Price Ratio. Firstly, you can notice that the two up legs of the secular bull market (from 2000 low to 2011 high) have quite the same amplitude (about 488 points) and the two down legs of the bear markets are connected to the 78.6 Fibonacci Number. Secondly, you can also notice that the first down leg (from September 2011 high to May 2012 low) and the second down leg (from September 2012 high to December 2013 low) of the last bear market are connected to the 78.6 Fibonacci Number. Thirdly, the last down leg (from September 2012 high to December 2013 low) and the entire bear market (from 2011 high to 2013 low) are also connected to the 78.6 Fibonacci Ratio.
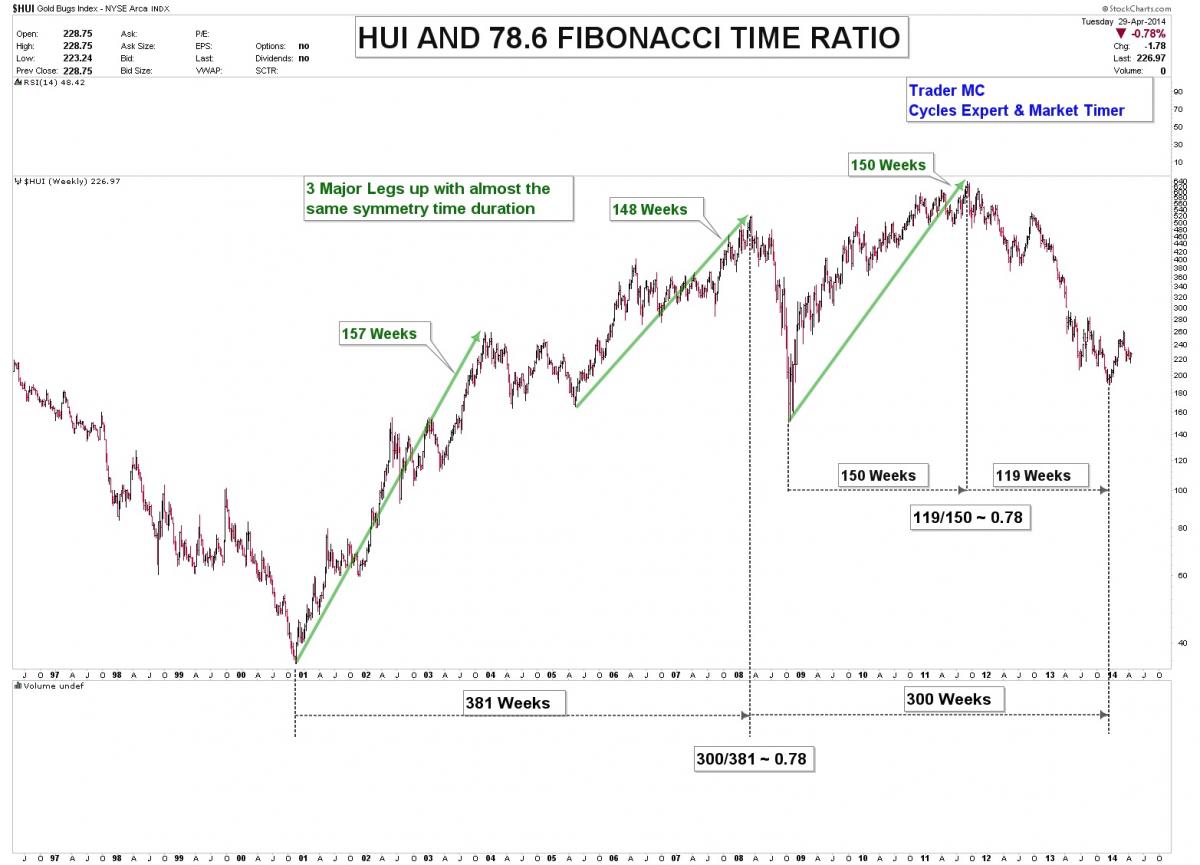
The Time Duration of the major lows and tops is also connected to the 78.6 Fibonacci number. Firstly, you can notice that the major low in 2001, the top in 2008 and the recent low in 2013 are exactly connected to the 78.6 Fibonacci Ratio. Secondly, the bull market from 2008 low to 2011 high (150 weeks) and the bear market from 2011 high to 2013 low (119 weeks) are also connected to the 78.6 Fibonacci Ratio.
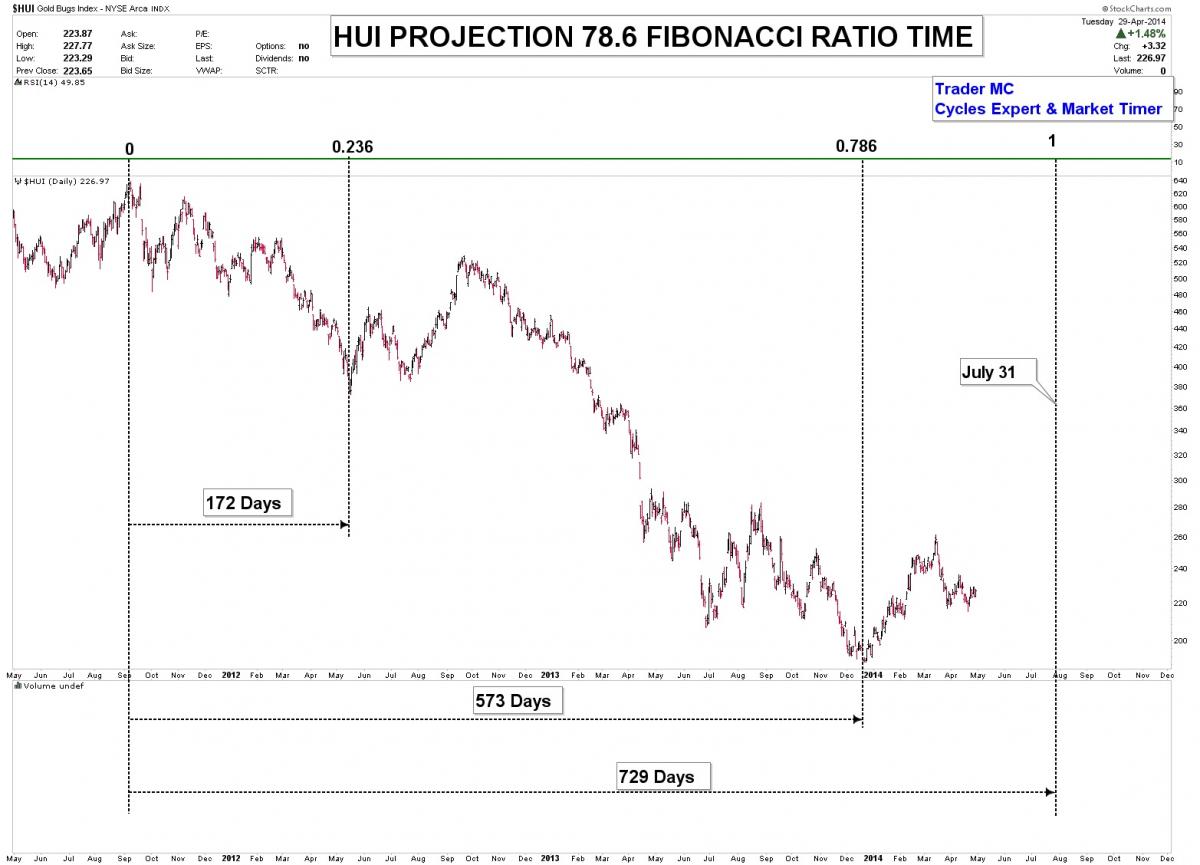
The 78.6 Fibonacci Projection of the bear market from 2011 top indicates July 31, 2014 as an important turning date. It also matches with the Golden Ratio projection in one of my previous articles “Gold Projection by the Golden Ratio” that indicates the first week of August as an important turning point.
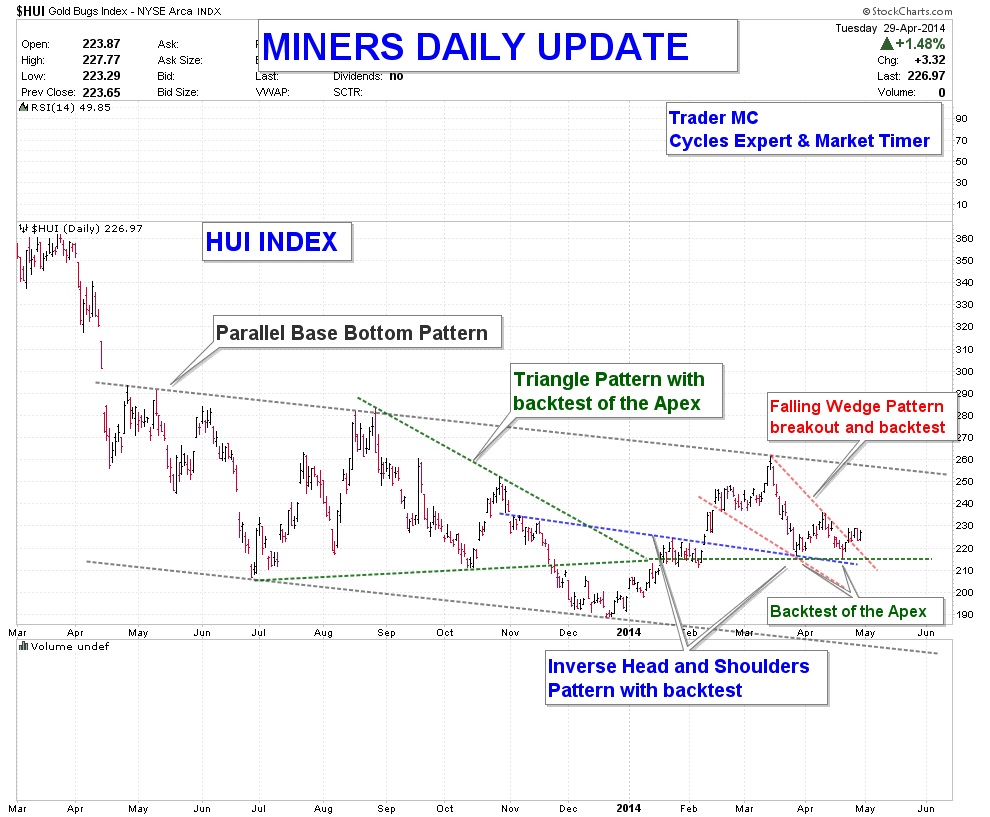
A closer view of the Miners Index is showing a One Year Parallel Base Pattern. You can see that HUI prices backtested both the apex of a Triangle Pattern and the neckline of an Inverse Head and Shoulders Pattern. Prices have recently broken out of a Falling Wedge Pattern and I expect higher prices in the coming weeks.
The One Year Parallel Base Pattern has the potential to end these 2 years of bear market. The longer the Base Pattern takes to build, the greater can be the reversal move. The MC Community is still bullish on Miners as all the factors mentioned above are indicating that a decent bottom could be in place for Miners but in this fast moving market it is important to keep an open mind and to adjust to the market conditions. Only a breakout of the Base Pattern will confirm that the bear market has ended.
Courtesy of http://tradermc.com
More from Gold-Eagle


