Mining Stocks: Breakdowns, Verifications, and Opportunities


Subtle, yet important. That’s what the changes in the precious metals were like on Friday.
The breakdowns in gold and mining stocks were verified, just like they were supposed to, and we made money on this rebound through the quick long position (10th profitable - unleveraged - trade in a row).
GDXJ's Bearish Implications
What’s next?
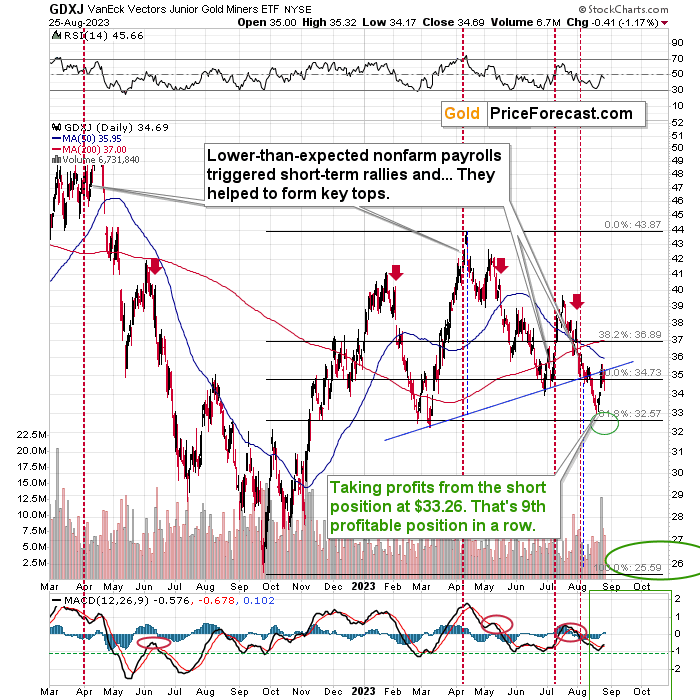
As the breakdown below the head-and-shoulders was just verified, the next move is likely to be to the downside. The previous 2023 lows might provide some support, but since we already saw a rebound from – approximately – those levels, I don’t think reaching them would be able to generate a sizable rebound.
And once junior miners break below their yearly lows, there’s very little technical support for many dollars. This means that miners are likely to decline quite fast.
In the last couple of months, the GDXJ has been declining overall, but it moved lower in a back-and-forth manner. It was trading, however, at the levels where it had been trading – approximately – since November 2022, so for quite a long time. Consequently, there were quite many trades placed there originally, which likely triggered buying orders when the price moved lower.
Why? Because people tend to view their previous opening or closing prices as something critical when determining whether to add to a position or close it. They might buy more when the price goes back to the levels at which people previously had bought or sold, for example.
However, when the price moves to the areas where there was little trading in the past, and the price just sort of “pierced through” them, then this effect is not present. Consequently, just as the price moves through the area in one direction, it can move in the same way in the opposite direction.
The area below $32 in the GDXJ perfectly fits this description. While I can’t promise any specific rate of return, it looks like the profits that we have already made in our new short positions are going to increase substantially soon.
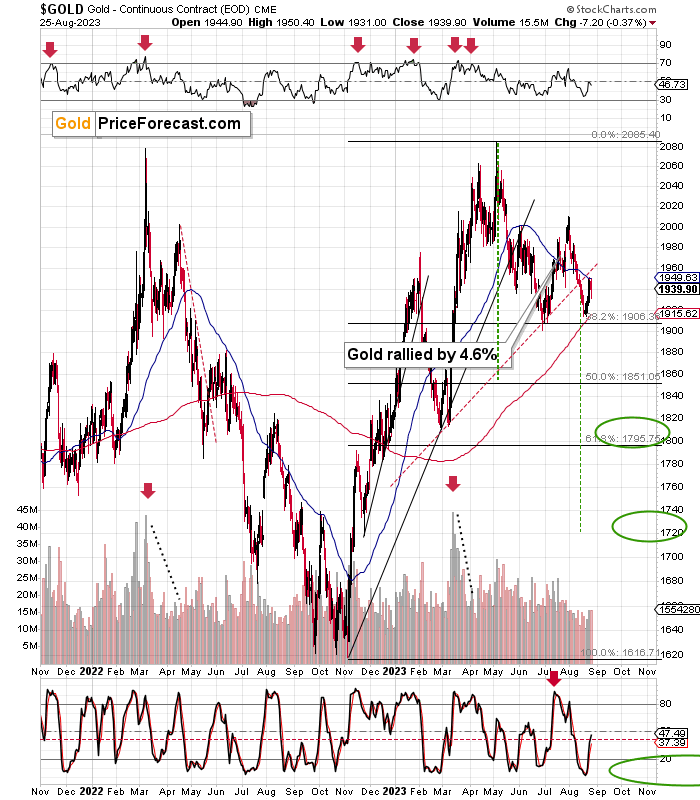
Gold price’s verification of the breakdown below its head-and-shoulders pattern and its 50-day moving average has bearish implications, and it simply confirms the analogous bearish indication from the GDXJ.
RSI Indicator Flashes Warning
Actually, the fact that the GDXJ declined so visibly on Friday is particularly bearish given the fact that on that particular day, the general stock market didn’t decline.
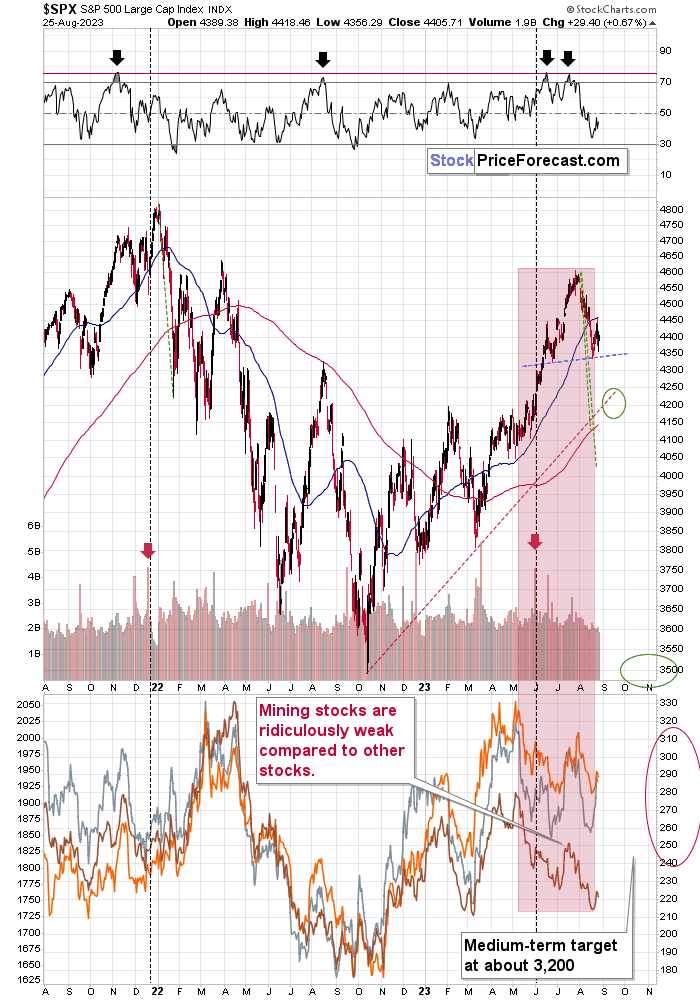
Instead, the S&P 500 moved a bit higher, correcting the most recent short-term move lower. That’s normal, but miners’ reaction wasn’t – it was bearish.
The fact that miners had a good reason not to decline, and they did it anyway, makes the verification of the breakdown even more reliable and bearish.
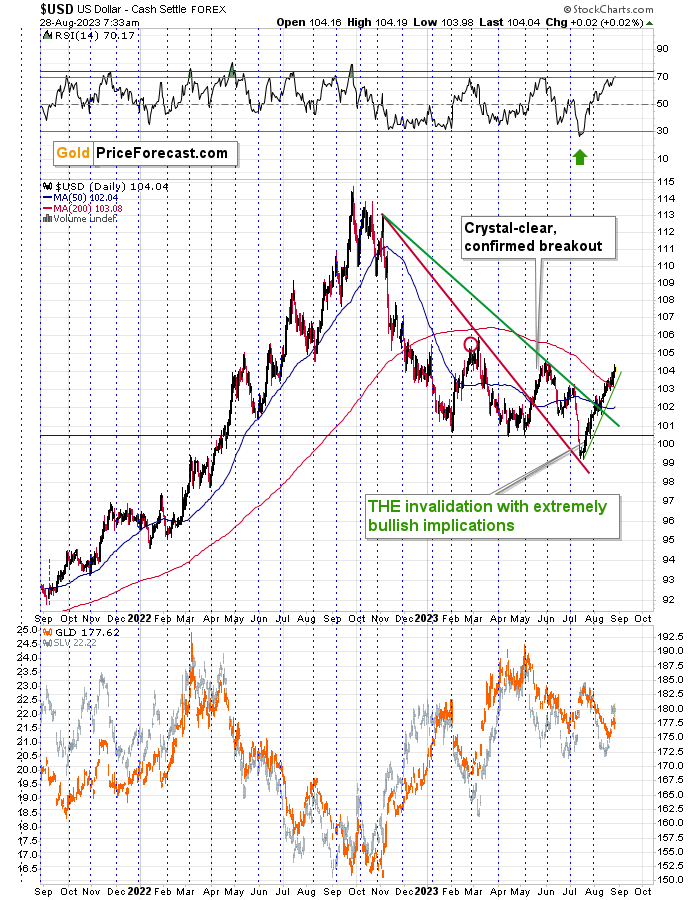
The RSI indicator based on the USD Index (upper part of the chart) moved above 70 but not yet to the red line that triggered the most profound rallies. And since the USDX was just extremely oversold, with RSI lower than it’s been for years, it’s quite normal to see an extra-large rally.
So, yes, as the USD Index and precious metals are negatively correlated, we can see even higher USDX values and lower precious metals values in the following days / weeks. And yes, this means further boosting our profits.
*********
 Przemyslaw Radomski, CFA, is the founder, owner and the main editor of SunshineProfits.com. You can reach Przemyslaw at: http://www.sunshineprofits.com/help/contact-us/.
More from Gold-Eagle


