Mr Bear is Draining the Swamp on Wall Street
I want to correct a mistake I made on my table for the foreign central bank holdings of US Treasury debt in my last article. Peggy, a reader of mine, pointed out that my numbers were correct, but I had the polarities reversed because I used July 2010 as the latest data, instead of July 2011. Here is the corrected table.
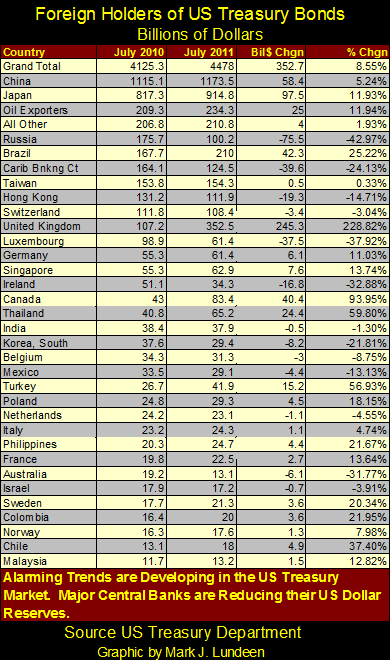
Sorry, but these things do happen. I'm a one man operation, and so little slips are going to happen every now and then. Peggy, thanks for letting me know I needed to make some changes on my spreadsheet.
With this item of old business completed, let's look at some of the bear tracks currently seen on Wall Street. But why should investors in precious metals care about the stock and bond markets? Oh that is a simple question to answer: because the financial markets currently have 99% of the investment funds people hope to increase their net-worth. However, somewhere below 10,000 for the Dow Jones, there is an unknown threshold; a price where people are going to recalibrate their expectations of what the financial markets are going to do for them, ditto for the US Treasury market. As a matter of survival, trillions of dollars are going to exit paper assets for fear of counter-party risk. In other words, we are heading into a financial panic. It's a reasonable assumption that gold, silver and mining shares are going to benefit greatly in the coming asset reallocation to come. We should also expect the "policy makers" to counter this future trend with mendacity and the printing press; but they will fail.
Two common themes frequently heard on CNBC; one is that earning increases are expected in the year to come, and just recently, that strong dividend stocks are safe harbors in a storm. Both of these market variables are dependent on the underlying strength of the economy. So how strong is the economy that companies must function in to increase earnings and protect a current "strong dividend"?
I don't care for government statistics, such as GDP. The fact that GDP uses rapidly devaluing US dollars makes it worthless as a measurement of economic activity. On the other hand, electrical power consumption (EP) is measured in kilowatts, a unit defined by engineers, whose definition has remained unchanged from 1930 to 2011. This makes EP a real-world measurement of economic activity. After all, what doesn't run on electrical power? Oh, things like factory assembly lines that have been shut down for lack of business, or bankruptcy, and city blocks of unoccupied condos in Las Vegas or Florida.
I take EP's 52Wk M/A to smooth out the seasonal variations, and use a BEV plot to see if EP is making new BEV Zero's (new all-time highs) or how far below EP currently is below its last BEV Zero.
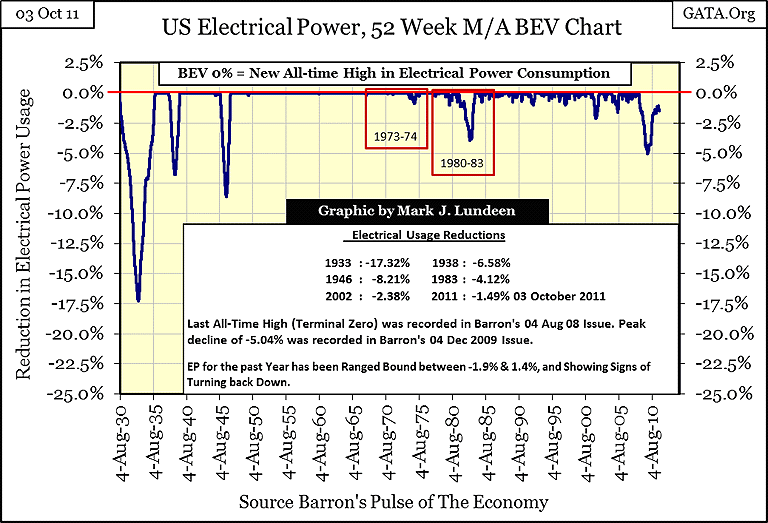
EP's last BEV Zero (last all-time high) was in August 2008, and bottomed in October 2009. After its bottom, EP saw a good twelve month rebound to October 2010, but has stagnated since then; for a full year. The "experts" on CNBC usually pin their hopes of increasing market earnings on some future action of the Fed, but I fear such hopes in 2011 are forlorn. I'm no market "expert", so naturally, I'm looking at EP for my clues for the future direction of the economy. Right now, EP is stalling and appears to be in danger of rolling over. If it does, and I think it will, a collapse in EP will result in a collapse in stock earnings, and that means cuts in dividend payouts for most companies. It has happened before.
Eight decades ago, the Dow Jones saw a 100% increase in its dividend payout; just before the Great-Depression Bear Market. But during the 1929-32 market crash, dividend payouts for the blue-chip Dow Jones collapsed by 78%. Both the early 1930's, and our bear market are the result of excessive credit creation by the financial system, under the management of the Federal Reserve. So, I expect the pathology of our bear market will play out very similar to what happened in the early 1930s. If so, the majority of blue-chip, dividend paying companies will be forced to make significant cuts in their dividend payouts before this bear market is over.
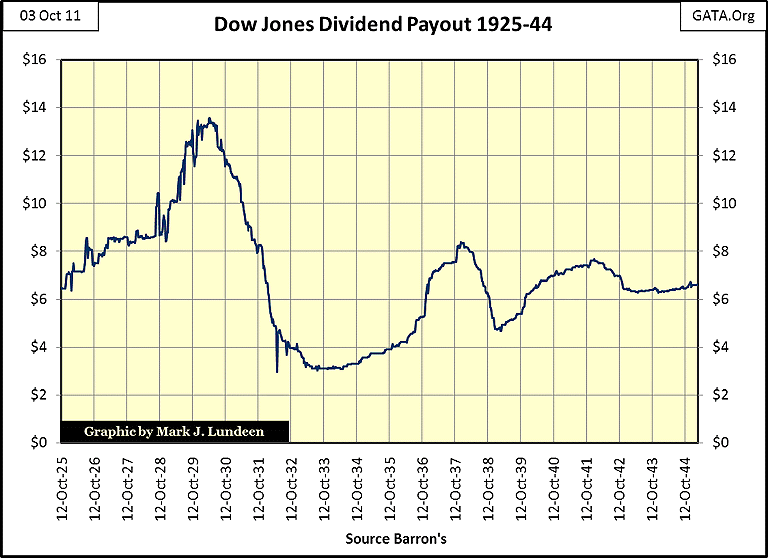
Gold and silver will benefit from this trend, and people who understand what is about to happen, also know that the one asset class that should have a secure dividend payout is the miners of precious metals. This was the case in the Great Depression and I expect it will be the case once again, assuming governments don't nationalize mining companies' properties.
So how likely is my supposed collapse in financial assets? VERY! I say that because from 1926-1990, price trends in the Dow Jones, led its earnings trends. Only after Doctor Bubbles (Alan Greenspan), began manipulating the financial markets in the 1990s, was this relationship reversed. I think Mr Bear is beginning to wrest control of the market valuation from the "policy makers", and I expect that for the first time in over two decades, the current decline in the Dow's valuation is going to lead the Dow's earnings trend. Of course, we will all have to wait to see what is to be.
One thing we no longer have to wait to see is if the Dow Jones is going to cross-the-gap between its 52Wk highs and its 52Wk lows, and decline to a new 52Wk low. On Monday, October 03, for the first time since 09 March 2009, the Dow on October 03 closed below its 52Wk low.
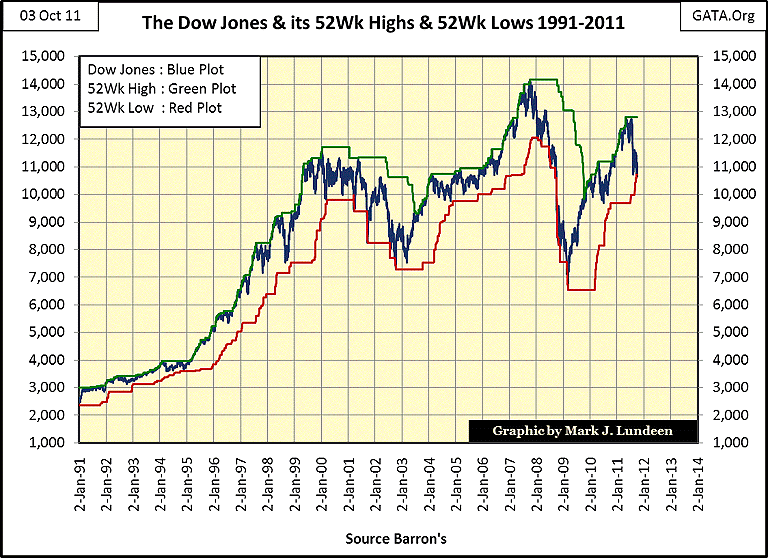
Here's a table giving the daily specifics. Note how the new 52Wk low is now the Dow Jones' closing price of October 03. The current 52Wk high for the Dow Jones occurred on April 29. This 52Wk high has about six months before it times-out, unless the Dow turns around and takes it out. But I think that is unlikely.
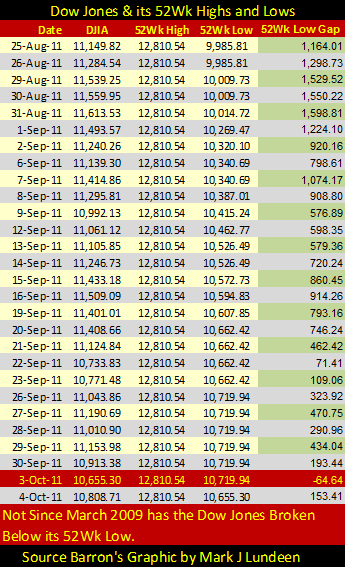
Seeing Dow break below a 52wk low is not a good sign. Historically, when the Dow's valuation breaks one of its 52 week extremes, it confirms the change in the stock market's primary trend. In October of 2011, that means lower prices in the Dow Jones should be expected for the foreseeable future. As always in the markets, there is no guarantee that the Dow will continue to make new 52Wk lows for the next year or two. But from this point on, risking money on a rising stock market is a sucker's bet.
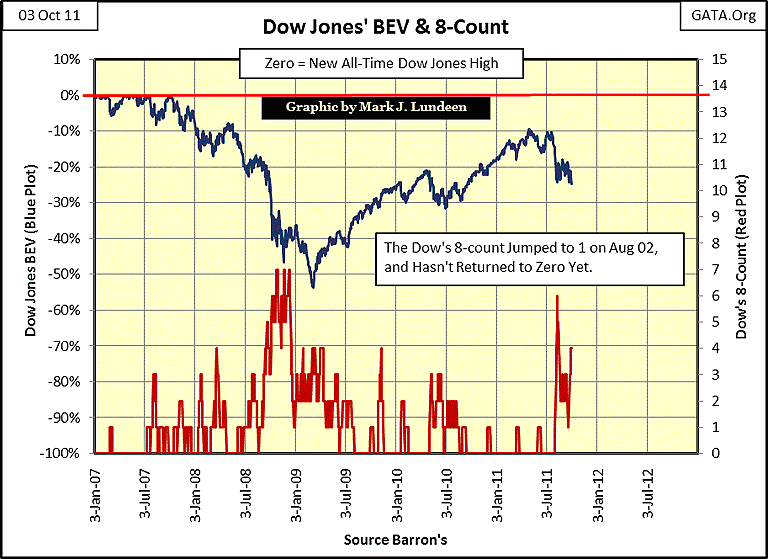
The Dow's 8-count is no source of comfort for the stock market bulls. Since the beginning of August, days of extreme volatility (+/- 2% or greater moves from a previous day's closing price) have become routine. Seeing the current cluster of 2% days in the Dow's 8-count is bear market stuff!
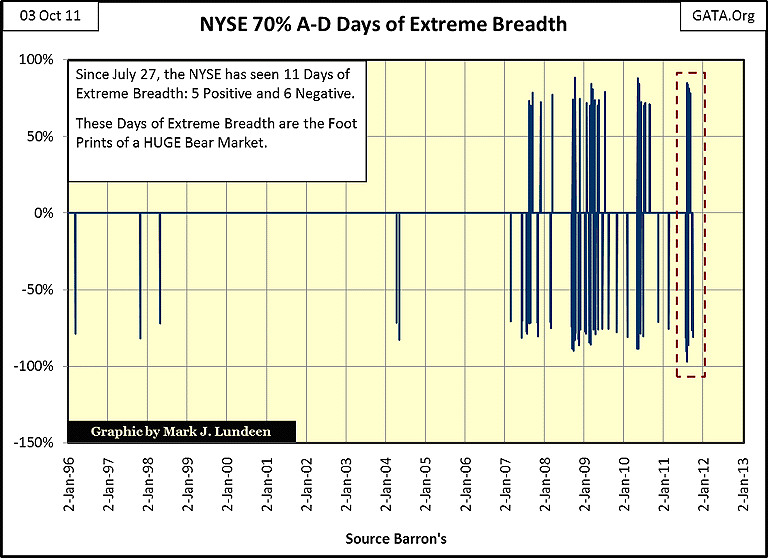
So too are the frequent days of extreme breadth. Days of extreme breadth are computed as follows:
Seeing this ratio produce a +/- 70% number is rare event, unless the economy is struggling with massive levels of unsecured, insolvent debt gumming up the financial system, as was the case in the 1930s and the current credit crisis.
Beginning in February 2007 (four and a half years ago), the NYSE began forming a cluster of 70% A-D days not seen since the 1930s! My NYSE A-D data begins in 1926. Since then, there have been 22,719 trading sessions on the floor of the NYSE, but only 340 of these sessions produced 70% A-D days. I told you that NYSE 70% A-D days are rare! From September 1929 to December 1939, the NYSE saw 142, 70% A-D days, and since February 2009 to today, the NYSE has seen 81. The chart below gives clear warning that something is very wrong with the stock market.
The next bearish item to examine is the NYSE 52Wk High-Low Ratio, seen below. On Monday, October 03, this ratio saw another spike below its -20% line, followed by another down spike below its -30% line on Tuesday, October 04. What this means is that smart money continues selling shares at these low prices. But what about the Dow's amazing 446.45 gain off its lows of the day (down 2.80%) to its final closing price (up 1.44%) in the last two hours of trading today? Don't be fooled by that. Listening to CNBC, I knew immediately that Mr Bear was again using Greek debt to bait his hook for the bulls. It's funny, but stinky bait is usually the best for big fish!
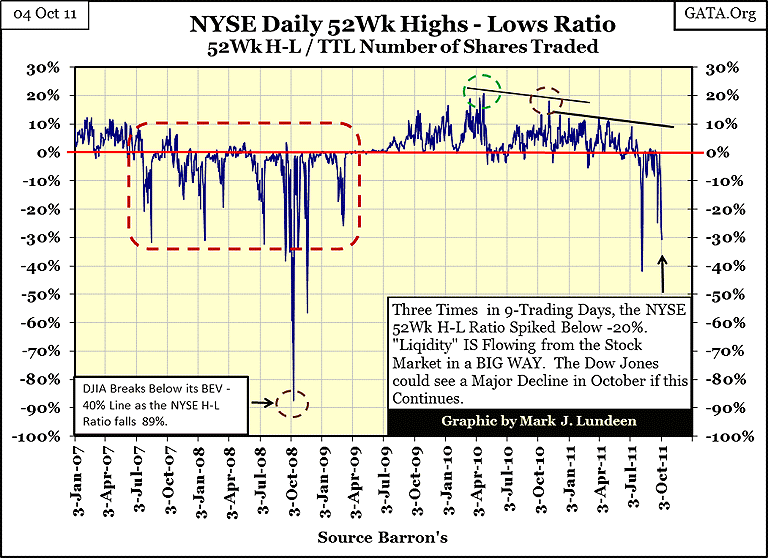
Since July 25, most shares have had a bad time. So, for the last 50 trading days at the NYSE, 40 days (80%) saw more 52Wk lows than 52Wk highs.
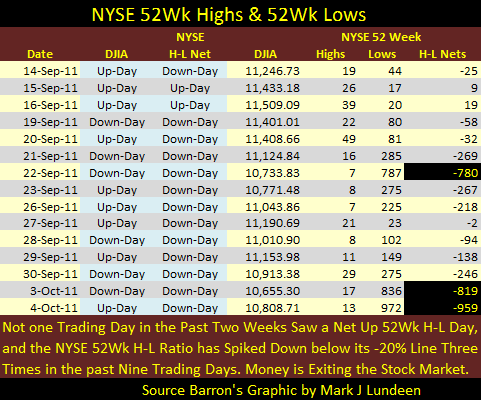
In the months to come, we will see periods with strings of days, maybe weeks with more 52Wk highs than lows, but the number of 52Wk highs will be less than 100, as during bear markets, most stocks are nearer to their 52Wk lows than their 52Wk highs. A quick look at the table above, specifically the up days for September 15&16, are typical of a positive NYSE 52Wk H-L day during a bear market. It's not that the stock exchange is seeing more 52Wk highs, as much as the NYSE's 52Wk lows backed off a bit.
Forget about what happens from one day to the next, or from hour to hour in the stock market. The NYSE 52Wk H-L Ratio is flashing a warning that current share valuations are vulnerable to significant declines in the months and possibly years to come.
Are we in a bear market? Yes we are! Look at the NYSE financial index. Since its post March 2009 high of 5414.71, (Feb 18), months before the NYSE Composite or the Dow saw any hint of our current difficulties, the NYSE Financial index began a collapsed of over 33%. Not that anyone would know that as "financial experts" seen on CNBC, and elsewhere, spend most of their time recommending bank stocks, and warn of "liquidation" in the gold and silver market.
The NYSE Financial Index just fell below its June 2009 support line (3724) on October 03, when it closed at 3637. Technically speaking, its next line of support is its lows of March 2009. I don't expect the lows of March 2009 will hold, or that CNBC will find it difficult finding "experts", like Warren Buffett, willing to recommend these toxic assets to the public all the way down to the ultimate bear market bottom.
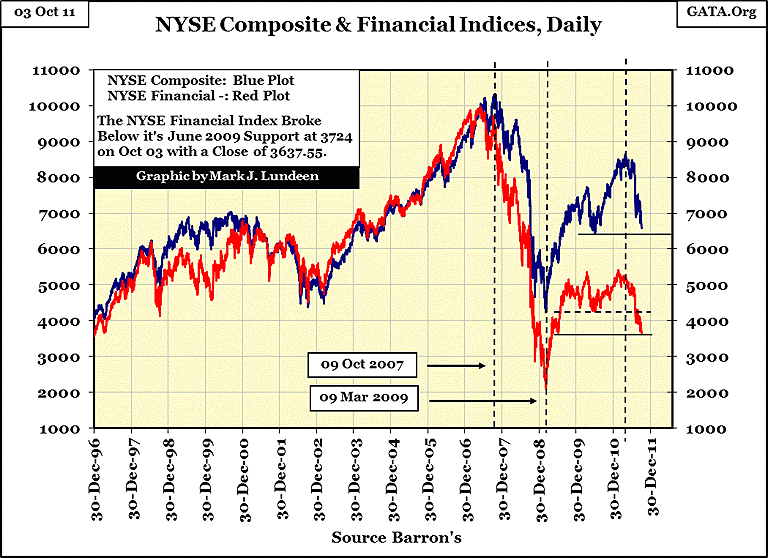
Liquidity and solvency issues in these same financial companies cause the Dow Jones to decline to its second deepest bear market bottom since 1885 in March 2009. Since then, nothing has changed for the better. In fact, things have become much worse in the past 2.5 years. Europe's academics managing "economic" and "monetary policy" have prescribed the standard Keynesian morphine drip line for both their banking system and the euro. It won't be long before Doctor Bernanke is forced to do the same on this side of the Atlantic.
But "injecting liquidity" into the economy is only a quick fix that someday will cause more problems for the "policy makers" than it solves. The real solution to the world's current financial crisis is to mark-to-market all financial assets, knowing most will become deeply discounted or even worthless. It's a bitter pill Mr Bear expects the world's pension, and sovereign wealth funds to swallow. And the two trillion dollars currently held by corporate America? It's all in short-term debt that will be either deeply discounted should Mr Bear gets his way, or inflated to worthlessness if Doctor Bernanke gets his. But the big-furry guy isn't going away until the world takes its medicine, and the swamp on Wall Street is drained.
[email protected]


