Muni-Bonds Problems And A Market Update


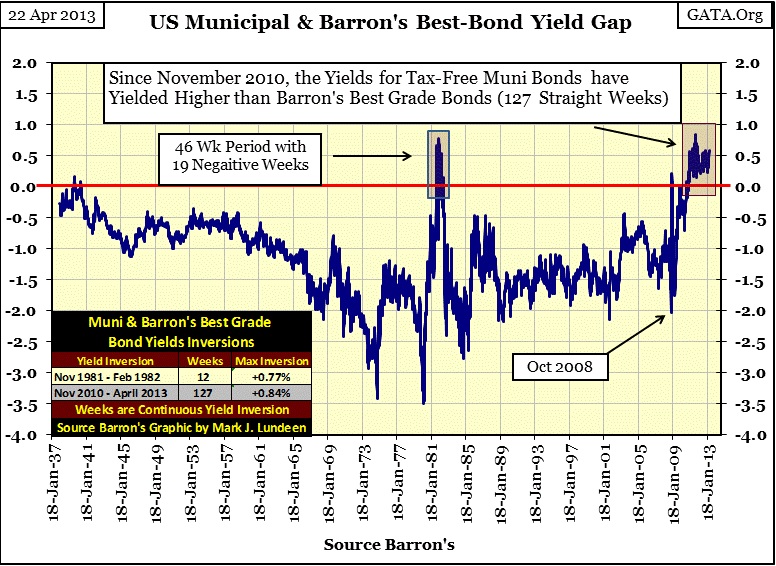
I covered municipal bond yields last year as they approached their second anniversary of an amazing and historic yield inversion. Geeze Louise, muni-bonds pay tax-free income, yet since November 2011 they have yielded more than Barron’s Best Grade Bonds. There is something very wrong with that, and now six months later, we see how this inversion has continued for the past 127 weeks. As seen below, since 1937 nothing like this has ever happened in the muni bond market.
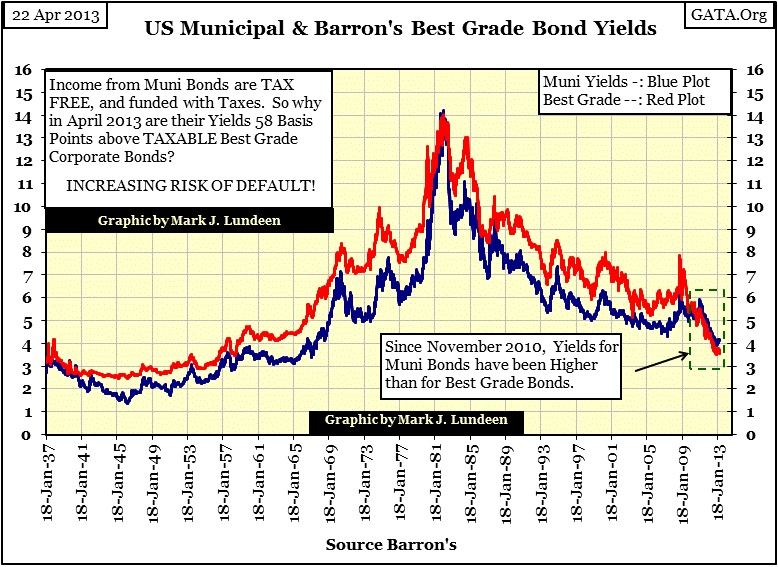
Here is the chart plotting the yields used in constructing the spread above.
And now after two and a half years, Reuters has picked up on the story:
(Reuters) - Investors in the $3.7 trillion U.S. municipal bond market could soon face an "Armageddon" if interest rates spike, a member of the Securities and Exchange Commission said on Tuesday.
http://www.reuters.com/article/2013/04/16/municipals-sec-idUSL2N0D328Y20130416
So what could make muni-bond yields spike? Simple: reality. First there is the reality that all US bond yields are mispriced for their true market risks because the Federal Reserve is interfering in the market’s pricing mechanism, and they have for decades. Former Federal Reserve Governor Kevin M. Warsh admits it.
"Now that I am out of government, I can tell you what I really believe. Central banks are now so heavily influencing asset prices that investors are unable to ascertain market values. This influence is especially evident, with the Fed's purchase of government bonds, which has made it impossible for investors to use bond prices to learn anything about markets.”
- Kevin M. Warsh: Former Federal Reserve Governor. Comments made to the Stanford University Institute for Economic Policy Research, 25 Jan 2012.
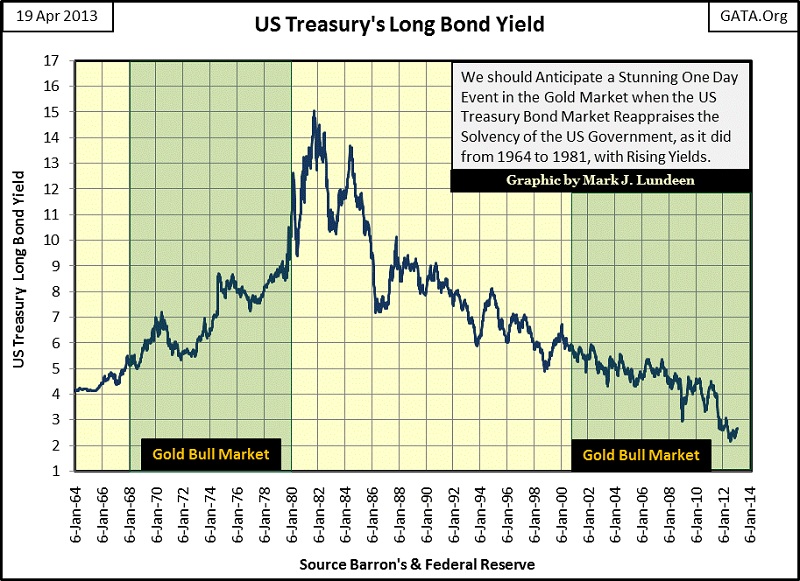
Since World War Two, monetary inflation has plagued the US dollar. The old crew at Barron’s spent lots of money on ink and paper informing their readers about it from the 1940s to the 1980s. It eventually caught up with the dollar in the late 1950s with rising bond yields. In the chart below we see how the yield in the US Treasury bond market increased with the price of gold from 1968 to 1980. T-bond yields peaked in late September 1981, with the long bond yielding over 15%. They soon came down with the price of gold.
Well this makes sense, as rising gold prices and bond yields tell us that confidence in the full faith and credit of the US Government isn’t what it used to be. The reverse is true when we see gold prices and bond yields decline; sure signs that the world at large approves of how Washington is managing the dollar and the economy. This was the case from 1981 to 2001, when both gold and bond yields declined. But in 2001 when gold began its current bull market US Treasury yields continued declining, and that should never happen, not for twelve continuous years.
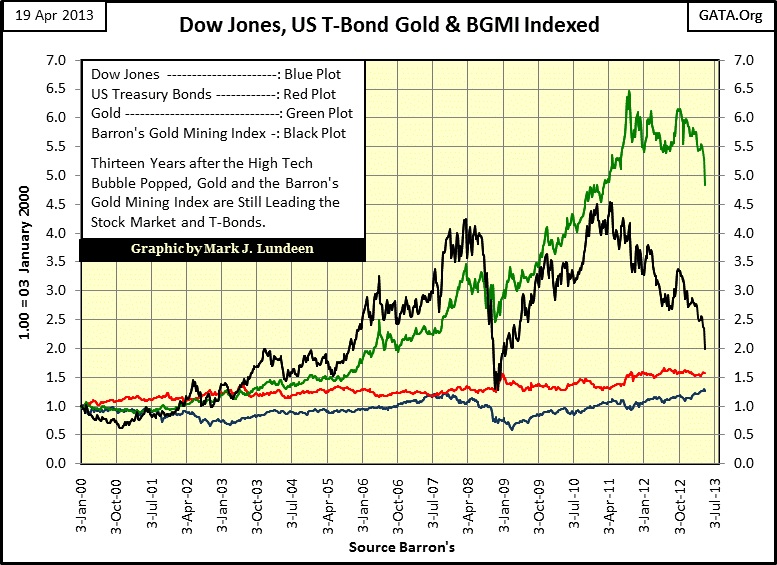
Next is a chart plotting the indexed values of the Dow Jones, Barron’s Gold Mining Index, the price of gold and the value of the US Long Bond since 2000. Each indexed series begins at 1.0 in January 2000. It’s interesting noting how the US Treasury long bond’s valuation has outperformed the Dow Jones since 2000, a fact most stock bulls seem unaware of. We can thank Alan Greenspan and Doctor Bernanke for that. But the point to make in this chart is how well gold has done since 2000 as the bond market continued its bull market that began in 1981. This is a major mixed message the market is telling the world. The bond market is saying that all is well with the world, while the rising gold price is saying that there are big problems in the financial markets coming towards us.
Someone has to be wrong, and I know it’s the bond market. Heck if Doctor Bernanke made a press statement that the Federal Reserve is going to discontinue its QE to infinity program, and everyone knew he really meant it, you could include the US Treasury bond market in the muni-bond Armageddon mentioned in the Reuters article above.
As far as the big decline in the BGMI (Black plot above) and the price of gold is concerned, the “policy makers” are whacking them to support the financial market that funds government spending and keeps the public’s retirement accounts at acceptable, if fabricated levels.
In an article by the Telegraph, a London paper, here is what John Mauldin said about last Friday’s dumping of 500 tons of paper gold into the futures market:
Five hundred tons of paper gold contracts were dumped into the market on Friday. That is a lot of gold. In short, some people sold gold like they had a gun to their heads, in such a quantity and with such ferocity that the likelihood of their being a for-profit seller is right up there with my chances of winning this week's Masters
Here is a King World News interview of Andrew Maguire, a London gold and silver trader who went public at a CFTC hearing in March 2010 on the illegal manipulation of the precious metals market. To date the CFTC has taken no action. Mr. Maguire said that there was a real concern for a delivery default in London that motivated the managed sell off by the shorts. After twelve years of artificially low gold prices and bond yields, we can count on many problems rising to the surface before this bear market is completed.
Returning to the muni-bond market, another market reality working against muni-bonds is how weak their issuers are financially. The lower than natural interest rates lured local and state governments to borrow money they could never pay back. That plus they and their tax-base (working people) have yet to recover from the mortgage crisis, a crisis that was caused by mortgage rates that were managed below where a free market would have had them. Let’s face it, they collect no taxes from abandoned homes, and all too many “home owners” are struggling with servicing their oversized mortgage from the housing bubble. Rising unemployment is very hard on local government too.
Maybe local and state government’s biggest problem is that since the 1960s the Federal government has burdened them with ill-considered cost sharing schemes. Washington offers partial payment for a program local and state government would never think of doing on their own, but once started becomes a financial burden on local government forever. Public “education” is a favorite issue for this. Obama’s healthcare program promises to compromise the financial health of local government even more. The fact is that at current yields, the muni-bond market has a lot of default risk that current yields are not pricing in. One thing for sure, when this muni-bond “Armageddon” arrives, Americans will notice it. Fire and police protection will be the first services to go.
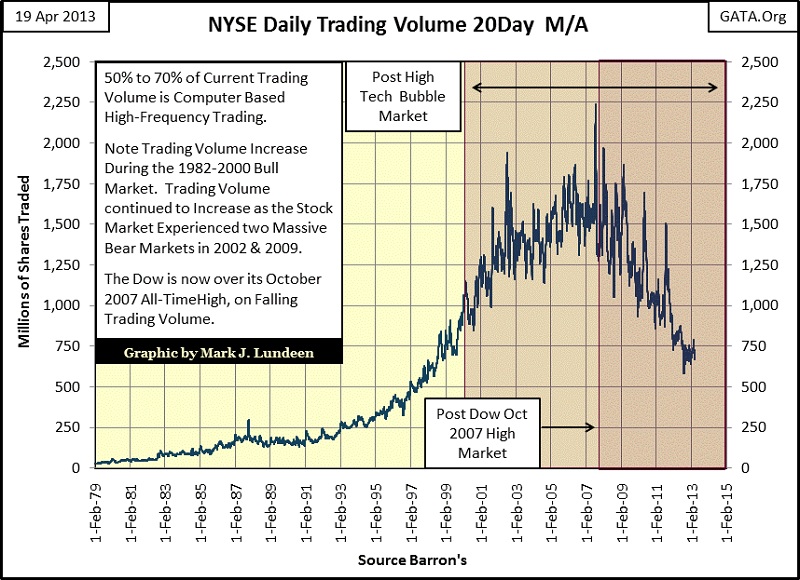
The Dow Jones broke above its all-time high of October 2008 on March 05. But I wouldn’t call it a “bull market”, not with the collapsing trading volume we see below. Currently most of the daily trading volume is by high-frequency traders from the big NY trading houses and hedge funds butting into the head of the line before retail investors fill their orders. This has been noted by the financial media long ago, yet the Federal government regulators do nothing. Attorney General Eric Holder told Congress that he couldn't prosecute Wall Street for crimes they committed, for fear of a market crash. What is he saying; that he’s waiting for a market crash before he goes after these crooks? What a load of bull.
And then there are the new-age earnings for the Dow Jones, and yes the S&P 500 too. In August 2007, earnings for the Dow Jones were over $830. Then in August 2008, twelve months later, they collapsed to -$109. We are talking about the bluest of the blue-chip stocks, and in a single year they did this (Red Box below)? It took three years during the Great Depression bear market before the Dow Jones’ earnings went negative.
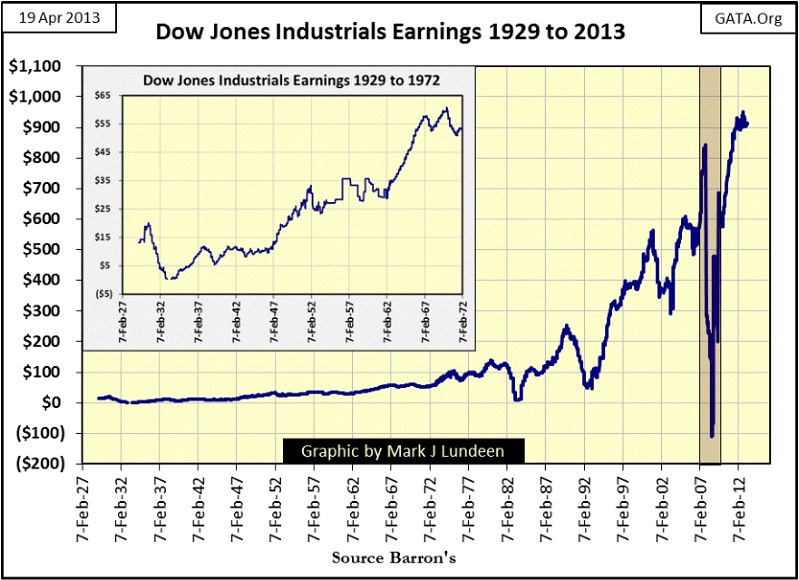
Well, in our new age of finance, derivatives are everywhere. They are in the muni-bond market and in the thirty Dow Jones Industrial companies. Look at the astounding rebound in the Dow Jones’ earnings since 2008. How was this accomplished in an economy overburdened with debt, and unemployment? These earnings have that “too good to be true” look to them, as do the cash dividend payout for the Dow Jones below.
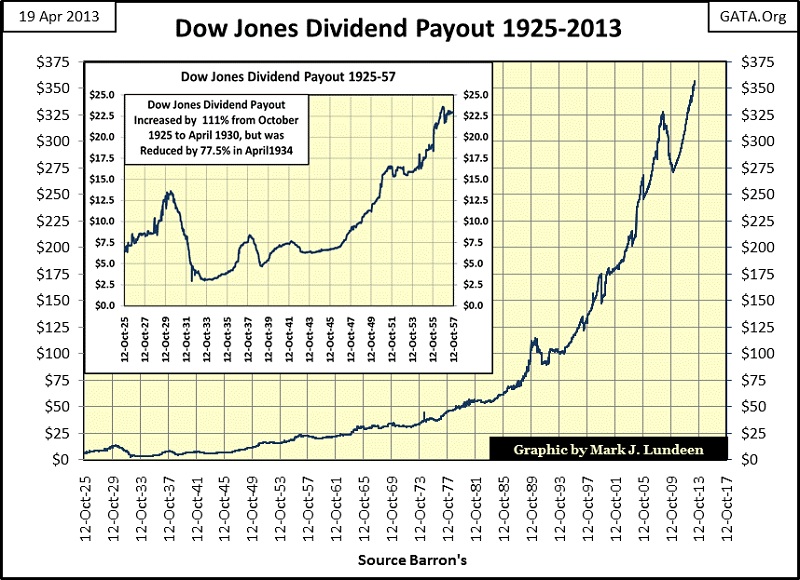
Where are these companies coming up with all this cash in our current economy? Dividends are Wall Street’s original profit sharing program for its owners, the people who buy a company’s shares. Mature companies who had cash left over after paying their operating expenses would declare a cash dividend for their owners, but the money sent to the owners were their share of the profits, with profits being the key word here. Are major American companies currently finding the global economy as profitable as we see in the earnings and dividend payouts we see in these charts? I don’t believe they are!
I expect the day is coming when we’ll learn that the earnings trends since before the credit crisis were mostly due to the success or failure of the Dow Jones companies derivative positions, not operations, and to fund dividend payouts they sold bonds to raise the needed cash, weakening their financial situation in the process. When interest rates once again begin to rise, I expect to see them take the stock market, with its earnings and dividend payouts, down with the bond market.
Here is an unpleasant fact we all need to deal with; the world around us is now managed by government to a degree never imagined possible a few decades ago, and Wall Street has much to say about what government will, and will not do in the foreseeable future. This means that the entire economy is now run as Washington has always conducted its business; corruptly, inefficiently, with all concerns of the future spanning only as far to the next election. So before this bear market that actually began in January 2000 is over, I expect to see it decline below the 89% collapse that terminated the Great Depression bear market in July 1932. But when will Congress and the Federal Reserve surrender to the inevitable, and allow what must happen, happen I haven’t a clue. However we can count on them to fight reality by “monetizing” crap assets until the dollar is no more. The rest of the world’s economic situation is no different, and that is why gold and silver are so hated by government worldwide, at least for now.
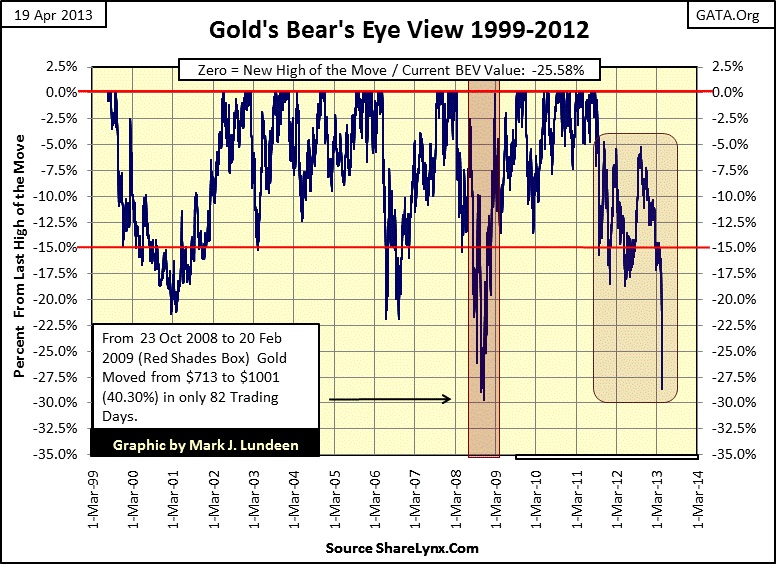
Let’s take a look at gold and silver’s BEV charts. Gold’s BEV plot looks bad, no doubt about that! But I have to note that after the “policy makers” in Washington and Wall Street flooded the gold futures markets with hundreds of tons of gold that doesn’t exist in the early morning hours (when most traders were sleeping), they failed to break gold below its percentage declines of 2008. This is no small thing in favor of us gold bulls. As I’ve mentioned before, our bull market in gold has been much tamer than the 1968-80 gold bull market when it comes to volatility, but last Friday and Monday may have broken volatility records.
But so what if the current low prices have resulted in an increase in demand for gold and silver, which in fact they have. The US Mint this week saw a record number of its Eagles bullion coins sold this week, same with the Royal Canadian Mint’s Maple Leafs. There are similar stories from the Persian Gulf to China that the price meltdown resulted in record demand for gold and silver. I’m not surprised. There are a lot of problems in the world when it comes to financial assets marketed by Wall Street. Buying gold and silver takes their owner’s wealth outside of the banking system, which is just a prudent thing to do today with at least some of your wealth. But as we saw last Friday and Monday, the banks and their governments are not going to make it easy to hold on to the old monetary metals when their financial systems have problems.
Here is silver’s BEV chart.
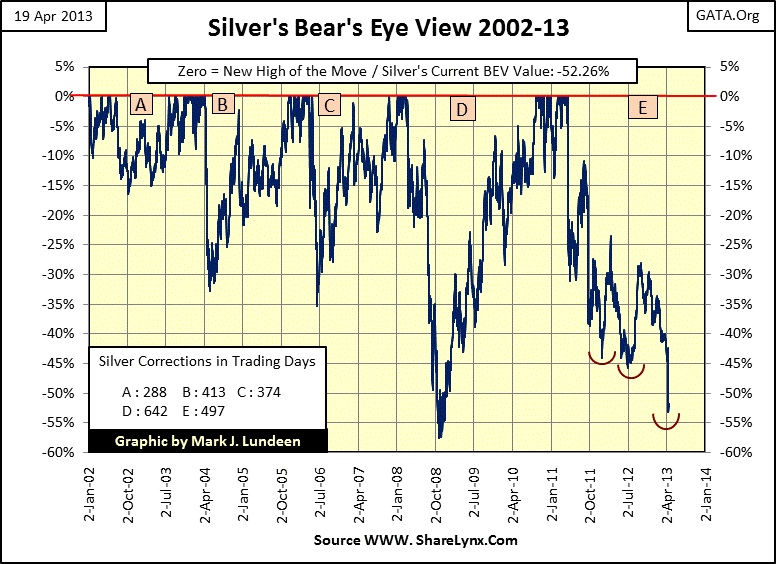
Silver, like gold, had a bad week, but we should note that the “policy makers” failed to drive silver down below its percentage decline of 2008. So what happens from here for gold and silver? I haven’t a clue, as I’m not privy to the hopes and fears of the powerful financial interests that can get away with selling hundred tons of paper gold they don’t have in a single hour. But the potential for significant gains in 2013 are still here. But I keep in mind that the problems the “policy makers” are having keeping their world functioning are huge, and are not going to get easier. Time is not on their side, so a day is coming when they will be overwhelmed by their pernicious activities in the financial markets. So I’m recommending that we all lower our expectations of what gold and silver are going to do for us next week, next month or maybe even next year, knowing that when the “policy makers” financial system does comes falling down, and it will, you’ll be glad for the gold and silver coins you held on to during trying times like this week.
Mark J. Lundeen


