NYSE Margin Debt Drifts Higher In November


The New York Stock Exchange publishes end-of-month data for margin debt on the NYXdata website, where we can also find historical data back to 1959. Let's examine the numbers and study the relationship between margin debt and the market, using the S&P 500 as the surrogate for the latter.
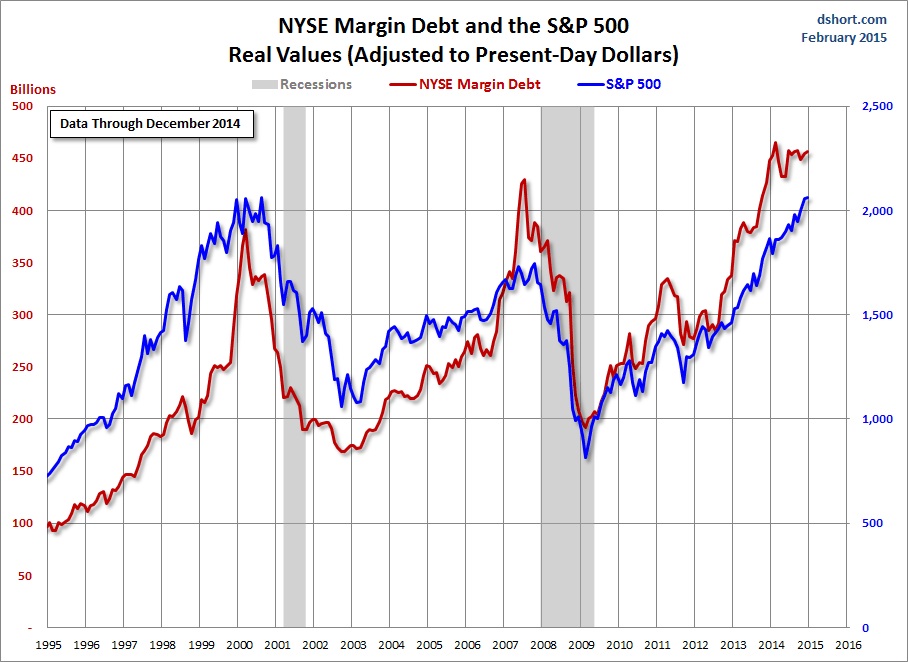
The first chart shows the two series in real terms — adjusted for inflation to today's dollar using the Consumer Price Index as the deflator. I picked 1995 as an arbitrary start date. We were well into the Boomer Bull Market that began in 1982 and approaching the start of the Tech Bubble that shaped investor sentiment during the second half of the decade. The astonishing surge in leverage in late 1999 peaked in March 2000, the same month that the S&P 500 hit its all-time daily high, although the highest monthly close for that year was five months later in August. A similar surge began in 2006, peaking in July 2007, three months before the market peak.
Debt hit a trough in February 2009, a month before the March market bottom. It then began another major cycle of increase. Margin debt hit an all-time high in February of this year.
The latest Margin Data
Unfortunately, the NYSE margin debt data is about a month old when it is published. Following its February peak, real margin declined sharply for two months, -3.9% in March -3.2% in April and was flat in May. It then jumped 5.7% in June, its largest gain in 17 months. The number has since hovered in a narrow range over the last five months. Real margin debt rose 1.0% in November and is now 2.7% off its February peak.
The next chart shows the percentage growth of the two data series from the same 1995 starting date, again based on real (inflation-adjusted) data. I've added markers to show the precise monthly values and added callouts to show the month. Margin debt grew at a rate comparable to the market from 1995 to late summer of 2000 before soaring into the stratosphere. The two synchronized in their rate of contraction in early 2001. But with recovery after the Tech Crash, margin debt gradually returned to a growth rate closer to its former self in the second half of the 1990s rather than the more restrained real growth of the S&P500. But by September of 2006, margin again went ballistic. It finally peaked in the summer of 2007, about three months before the market.
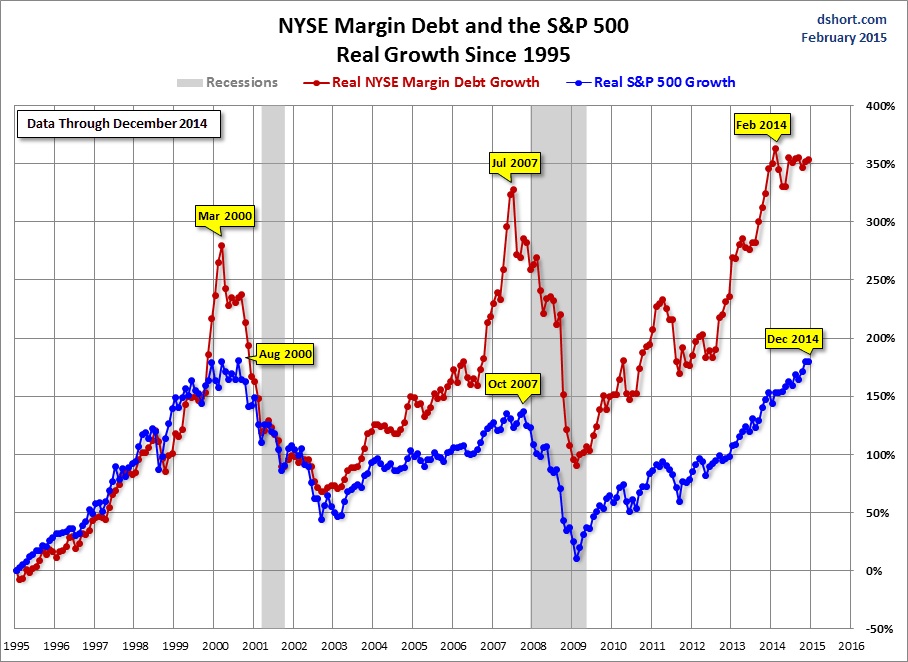
After the market low of 2009, margin debt again went on a tear until the contraction in late spring of 2010. The summer doldrums promptly ended when Chairman Bernanke hinted of more quantitative easing in his August, 2010 Jackson Hole speech. The appetite for margin instantly returned, and the Fed periodically increased the easing. Now that QE over, it will be particularly interesting to watch debt levels in the months ahead.
NYSE Investor Credit
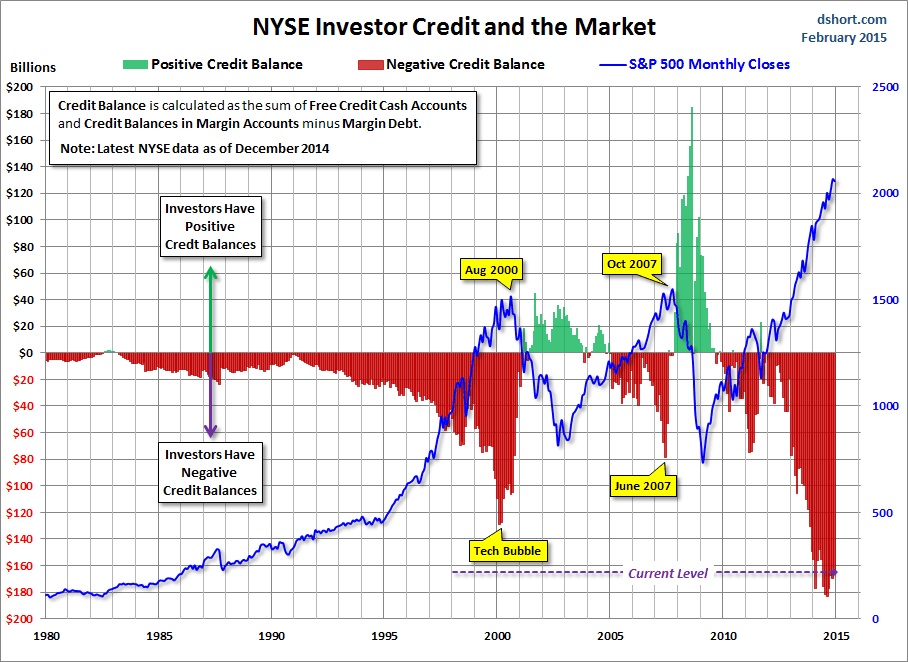
Lance Roberts of STA Wealth Management analyzes margin debt in the larger context that includes free cash accounts and credit balances in margin accounts. Essentially, he calculates the Credit Balance as the sum of Free Credit Cash Accounts and Credit Balances in Margin Accounts minus Margin Debt. The chart below illustrates the mathematics of Credit Balance with an overlay of the S&P 500. Note that the chart below is based on nominal data, not adjusted for inflation.
Here's a slightly closer look at the data, starting with 1995. Also, I've inverted the S&P 500 monthly closes and used markers to pinpoint the monthly close values.
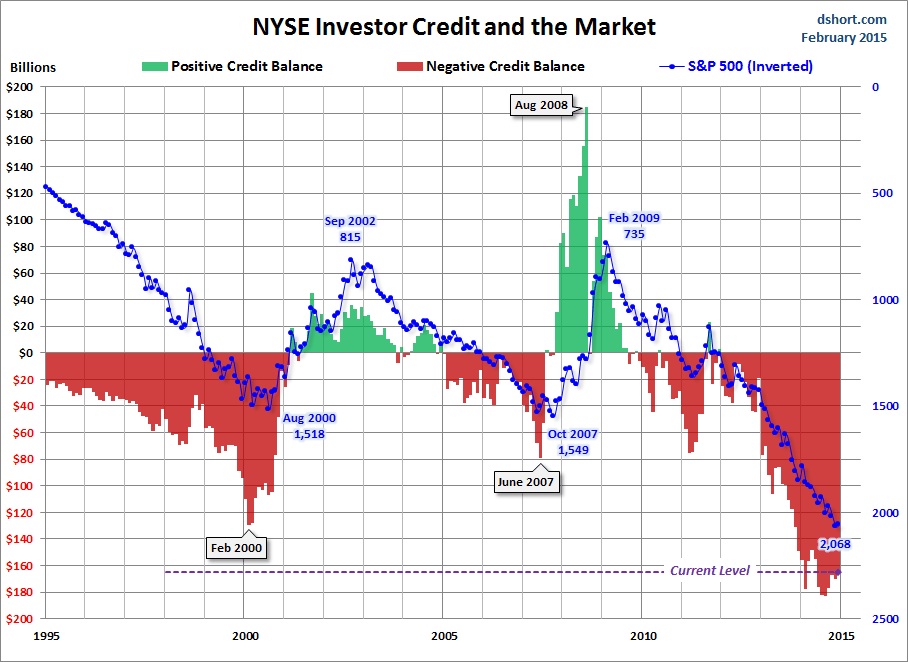
As I pointed out above, the NYSE margin debt data is a several weeks old when it is published. Thus, even though it may in theory be a leading indicator, a major shift in margin debt isn't immediately evident. Nevertheless, we see that the troughs in the monthly net credit balance preceded peaks in the monthly S&P500 closes by six months in 2000 and four months in 2007. The most recent S&P500 correction greater than 10% was the 19.39% selloff in 2011 from April 29th to October 3rd. Investor Credit hit a negative extreme in March 2011.
There are too few peak/trough episodes in this overlay series to take the latest credit-balance data as a leading indicator of a major selloff in U.S. equities. But we'll definitely want to keep an eye on this metric in the months ahead.
********
Courtesy of http://www.advisorperspectives.com/
 My original dshort.com website was launched in February 2005 using a domain name based on my real name, Doug Short. I'm a formerly retired first wave boomer with a Ph.D. in English from Duke and a lifelong interest in economics and finance. In 2011 my website was acquired byAdvisor Perspectives, where I serve as the Vice President of Research.
My first career was a faculty position at North Carolina State University, where I achieved the rank of Full Professor in 1983. During the early '80s I got hooked on academic uses of microcomputers for research and instruction. In 1983, I co-directed the Sixth International Conference on Computers and the Humanities. An IBM executive who attended the conference made me a job offer I couldn't refuse.
Thus began my new career as a Higher Education Consultant for IBM — an ambassador for Information Technology to major universities around the country. After 12 years with Big Blue, I grew tired of the constant travel and left for a series of IT management positions in the Research Triangle area of North Carolina. I concluded my IT career managing the group responsible for email and research databases at GlaxoSmithKline until my retirement in 2006.


