Oil's Drop Is Steep…But Gold Goes To Sleep


At this time of the year when all hell supposedly breaks loose across the spectrum of the BEGOS Markets (Bond / Euro / Gold / Oil / S&P) -- and therein Oil has been contributing its part, -12.7% through just these first eight trading days of September -- the balance of the bunch have thus far been relatively docile, Gold itself having flat out gone to sleep.
"But aren't stocks way down too, mmb?"
The word "way" is relative, Squire. Oh, there's the media hype that 'tis all going wrong. To be sure, from the S&P's recent all-time intra-day high of 3588 (02 September) to yesterday's (Friday's) intra-day low of 3310 is a demise of -7.7% across those seven days. The word "relative" being key there when compared to seven-day percentage declines of triple that amount back in March as economies were switched off; thus 'tis really not that daunting at present. Rather, the word "daunting" can describe the course of the stock market should the "live" price/earnings ratio of the S&P 500 ever work its way from today's 56.8x back to more normal levels in the 20s; (unless "normal" is no more, or until earnings triple without stock prices rising).
Indeed, Oil has taken quite the plunge in September. Ramped-up reactions to COVID have in turn furthered demand concerns leading to shipment price slashing, supply curb easings and inventory backups, all of which put Oil on its slippery slope. 'Course, back in April when Oil found itself -178% (yes, do the math) -- when we ought have been paid to "buy" petrol -- that quintessentially was daunting. And let's face it: the one-two punch of invoked controls due to COVID plus StateSide energy independence just ain't Oil friendly.
But be it Black Gold getting sold, a li'l old-fashioned currencies volatility, stock market plops and upside interest rate creep, our yellow metal itself is at present asleep. Gold just spanned its narrowest weekly trading range -- if one can cite 64 points as being "narrow" -- of the last eight, prior to which Gold had been comparably scrunched in battling week-in and week-out toward taking The Northern Front (1750-1800). Obviously it so did en route to topping 2000 on 31 July, in turn achieving the All-Time High of 2089 a week hence on 07 August. But for the seven weeks prior to this past one, Gold's average weekly trading range had been a robust 110 points; (its entire trading range for last year was 299 points).
Further, for all the fanfare and ballyhoo herein portrayed a week ago -- emphasizing Gold's positive seasonality from StateSide Labor Day to Thanksgiving during this century's first decade, such seasonality stint having turned negative in this second decade -- our expectations for this past week of "Game On!" volatility were instead met with "Lights Off!" lethargy. Neither did Sister Silver skirt the sleepiness which suffused the precious metals' week: she too was subdued in recording her narrowest week (1.77 points) of the last eight, like Gold, less that half her prior seven-week average trading range of 3.84 points.
Putting it into a picture, here are the percentage tracks for the primary BEGOS bunch from one month ago-to-date (last 21 trading days), the vertical red line dividing August's Dog Days from early September's "Game On!" days (or otherwise, daze):

Now according to Bank of America's "weekly flow statistics", Bond and Gold funds have been taking in investors' dough, although by the above graphic of core price movements, one wouldn't know. Almost ignorant to stocks' somewhat falling off the roof has Gold stayed aloof. Indeed as the S&P 500 dropped those 278 points (-7.7%) in just these early days of September (the so-called "worst month of the year" for stocks), their being sold has thus far brought no like flight to Gold. In fact, the graphic's tracks from a month back show the Bond +0.3%, Gold -0.9%, and the S&P -1.4% (...yawn...)
But from a year ago-to-date, Gold's graphic looks great, even as the weekly bars print their third rightmost dot of parabolic Short trend. Price's settling yesterday at 1948 is +28% year-to-date: lighting up the markets is our Gold, (and Silver too +50.4%!):
Lighting up the world's economies is the StateSide Economic Barometer as some COVID (or perhaps more apparently "covert") constraints are lifted. 'Tis important to bear in mind that the Econ Baro proceeds as an oscillator rather than as an index, meaning that it shan't keep climbing in perpetuity. Baro negatives include metrics growing more slowly, prior period downward revisions, and consensus misses. Just something for which to watch as the Baro glides along, albeit when the 29 October first peek of Q3 Gross Domestic Product is released, look for it to be a comparable upside doozie to Q2's -32%. As for the past week, the incoming metrics were rather mundane, although inflation at both the wholesale and retail levels continues to elbow our wallets. (As was penned in a recent missive to our Investors Roundtable: "...My wee Cheez-It [Reduced Fat] box just went from $5.29 to $6.49: +22.7%..." That's an ouch). Here's the year-over-year Baro, the red line being the S&P 500:
Meanwhile in the midst of next week's cavalcade of 16 incoming Econ Baro metrics also arrives the Federal Open Market Committee's policy statement on Wednesday (16 September). Do they dare nudge their Bank's FedFunds rate up a notch? Since their 29 July statement, the U.S. 30-year Treasury Bond yield has increased from 1.242% to as high as 1.530%; that for the 10-year Note from 0.579% to as high as 0.746%; and that for the Five-year Note from 0.253% to as high as 0.322%. Yes, they're all the longer end of the yield curve. Still, even as inflation is increasing, the FedFunds futures are priced for no rate change this time 'round. Too fragile, given COVID don't you know. Either way, we'll see how Chair Powell gets pressed.
As for the EuroZone, its European Central Bank remains fairly pro-stimulus, which in turn is taking the edge off the Euro, it having had quite the run from as low as $1.0671 on 23 March to as high as $1.2015 in kicking off September. But the broader take going forward is Europe's economy not being as COVID resilient as is that of the U.S., and moreover there's still all that Brexit "deal or no-deal" trade dithering for which to account. Further eastward, China's exports continue their rebound in the wake of economic lock-downs finding some relief. Recall the Pink Floyd piece "Us... and them..."from '73? We'll see...
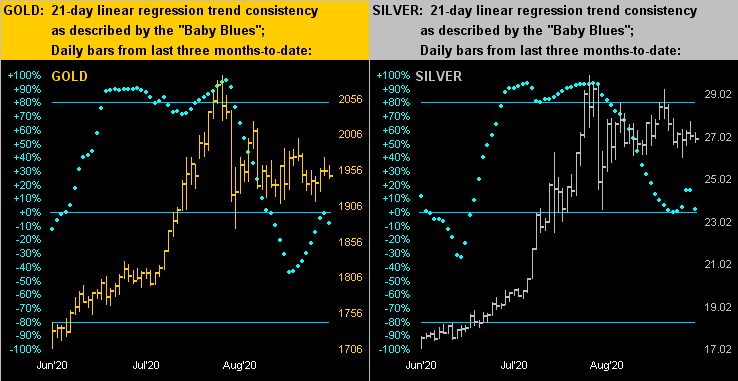
Here we next see the last three months-to-date of the precious metals' daily bars for Gold on the left and Silver on the right. For both markets, their "Baby Blues" of regression trend consistency are basically 'round their 0% axes, meaning such respective 21-day trends at present are essentially flat:
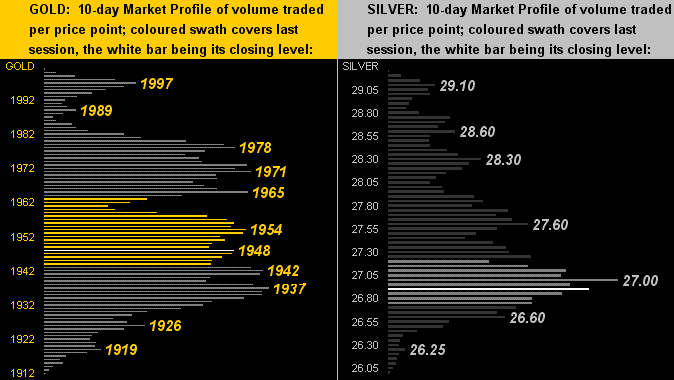
Then we've the 10-day Market Profiles for Gold (below left) and Silver (below right). Plenty of apices on both sides of the graphic indicative of trading support and resistance. And as noted in our most recent missives, Gold need stay north of the low 1900s, else there are really no structural footholds until down at 1830. For Silver, failure to save the mid-20s could well result in revisiting 19. ("Say it ain't so Sister Silver!"):
Towards our wrap, here's The Stack:
The Gold Stack
Gold's Value per Dollar Debasement, (from our opening "Scoreboard"): 3544
Gold’s All-Time Intra-Day High: 2089 (07 August 2020)
2020's High: 2089 (07 August 2020)
The Weekly Parabolic Price to flip Long: 2082
Gold’s All-Time Closing High: 2075 (06 August 2020)
10-Session “volume-weighted” average price magnet: 1955
Trading Resistance: here at 1948 and higher as noted in the Profile
Gold Currently: 1948, (expected daily trading range ["EDTR"]: 37 points)
Trading Support: here at 1948 and lower as noted in the Profile
10-Session directional range: down to 1912 (from 2001) = -89 points or -4.4%
The Gateway to 2000: 1900+
The Final Frontier: 1900-1800
The Northern Front: 1800-1750
On Maneuvers: 1750-1579
The 300-Day Moving Average: 1630 and rising
The Floor: 1579-1466
Le Sous-sol: Sub-1466
The Support Shelf : 1454-1434
2020's Low: 1451 (16 March)
Base Camp: 1377
The 1360s Double-Top: 1369 in Apr '18 preceded by 1362 in Sep '17
Neverland: The Whiny 1290s
The Box: 1280-1240
So we're well into September, let alone past Labor Day, and yet Gold is not really in play. Oil's drop has been steep and yet Gold's been asleep. Millennium-to-date, the correlation of Gold to Oil by ratio typically ranges from around 5x to 25x, outlying exceptions notwithstanding. At present 'tis 52x: but fundamentally, Gold isn't too high; thus 'tis Oil that's too low. Or has Oil's pricing paradigm shifted? COVID or otherwise, there's plenty of Oil to go 'round, (despite our being taught at U$C back in '76 that the world's Oil supply will have run out 20 years hence by '96). But even given the wisdom of "buy low, sell high" -- which would give the "buy" lean to Oil -- hardly is Gold truly high!
www.deMeadville.com
www.TheGoldUpdate.com
********

Mark Mead Baillie has had an extensive business career beginning in banking and financial services for two years with Banque Nationale de Paris to corporate research for three years at Barclays Bank and then for six years as an analyst and corporate lender with Société Générale.
For the last 22 years he has expanded his financial expertise by creating his own financial services company, de Meadville International, which comprehensively follows his BEGOS complex of markets (Bond/Euro/Gold/Oil/S&P) and the trading of the futures therein. He is recognized within the financial community of demonstrating creative technical skills that surpass industry standards toward making highly informed market assessments and his work is featured in Merrill Lynch Wealth Management client presentations. He has adapted such skills into becoming the popular author each week of the prolific “The Gold Update” and is known in the financial website community as “mmb” and “deMeadville”.
Mr. Baillie holds a BS in Business from the University of Southern California and an MBA in Finance from Golden Gate University.


