Palladium Was The Winner In 2014


Near the beginning of every year, we update and publish what can safely be called our most popular piece: the Periodic Table of Commodities Returns.
Below are the latest year-end results, which show the historical performance of commodities from best to worst. A larger, high-definition version of the table is available for download.
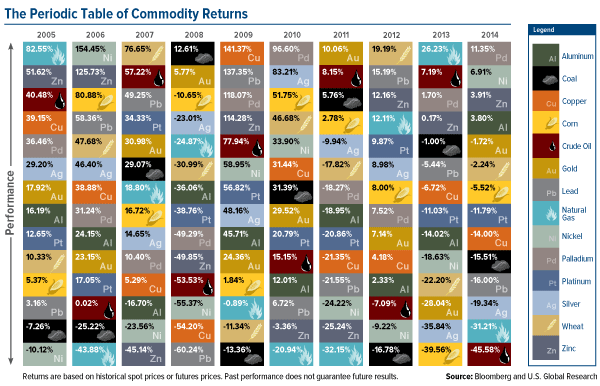
Last year we experienced one of the biggest commodity corrections in recent memory—the biggest since 1986, in fact—and we’re happy to put it in our rearview mirrors.
Base Metals Boasted Mettle
Although it came in second overall, right behind palladium, nickel was the real standout of 2014. With a shabby 10-year annualized track record of -1.8 percent, the metal gained nearly 7 percent on the back of supply scares after Indonesia, the world’s largest producer, unexpectedly banned all nickel exports last January to meet domestic demand. By May, the metal had rocketed up more than 50 percent before cooling to 37 percent in July, when it was then the best-performing commodity.
 Aluminum also managed to beat its 10-year annualized performance by close to 3 percentage points, owing to global production cuts and increased industrial usage of the metal in automobiles and aeronautics. The 2015 F-150, for example, is the first mass-produced truck in its class to feature an aluminum-alloy body. Because of these developments, Texas-based aluminum-producer Alcoa, which we own in our Global Resources Fund (PSPFX), enjoyed its best year since 2008, delivering 50 percent.
Precious Metals Pressured
Palladium, 2014’s top commodity, performed relatively according to script. For the year it was up 11.35 percent, compared to its 10-year annualized returns of 14 percent. Much like nickel, palladium was spurred by extenuating circumstances. Between January and June, a labor strike in South Africa, the world’s second-largest producer of the metal following Russia, halted production, which depleted reserves and sent palladium to a three-year high of $850 an ounce.
Although nickel doesn’t have an exchange-traded fund (ETF), we manage to capture this growth through a palladium ETF.
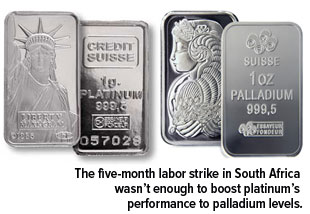 The South African labor strike didn’t seem to help palladium’s sister metal, platinum, which ended the year down 11.79 percent. To combat and find solutions to years’ worth of flat sales, six South African platinum producers launched the World Platinum Investment Council in December. CEO Paul Wilson summed up the group’s mission:
To date, the investment potential of platinum has been largely overlooked. We believe that presenting the platinum investment proposition to a wider range of investors will result in it rightfully being considered favorably as an investment.
Silver had its second straight down year, falling 19 percent, despite record sales of Silver Eagle coins. According to the U.S. Mint, 44 million ounces were sold in 2014, outpacing Gold Eagle sales by 59 percent. The U.S. Mint’s stock of bullion completely dried up on Christmas Eve.
However, silver mining also accelerated to record highs last year. This, coupled with weak industrial use of silver in the first half of 2014, led to falling prices.
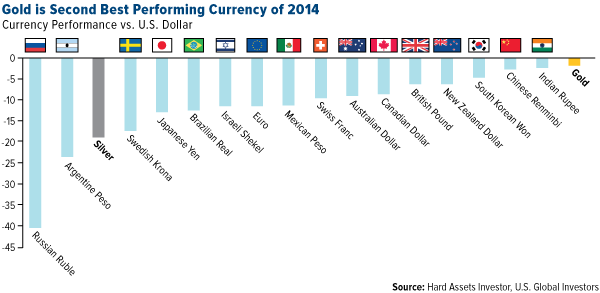
And then there’s gold, which also fell (slightly) for the second consecutive year. As I’ve already reported, even though the yellow metal dropped 1.72, it still remained a more reliable form of currency than any other globally, excluding the U.S. dollar.
Energy Feeling Sluggish
Besides crude oil, the biggest loser was natural gas. A particularly brutal winter in late 2013 helped make it the top performer for that year. But even though the polar vortex—remember that?—dragged frigid temperatures into the beginning of the new year, natural gas couldn’t quite manage to ignite the flame in 2014, which turned out to be one of the warmest years on record.
Natural gas remains the worst-performing commodity for the 10-year period, down 3.73 percent.
All three energy-related commodities, in fact—coal, natural gas and crude oil—showed up in the bottom five, their first time to do so since 2006.
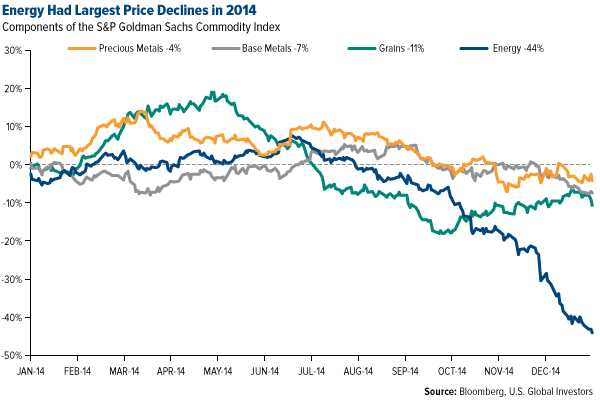
Weighed down by crude oil, which tanked 46 percent in 2014, the energy component of the S&P Goldman Sachs Commodities Index (GSCI) lost 44 percent for the year.
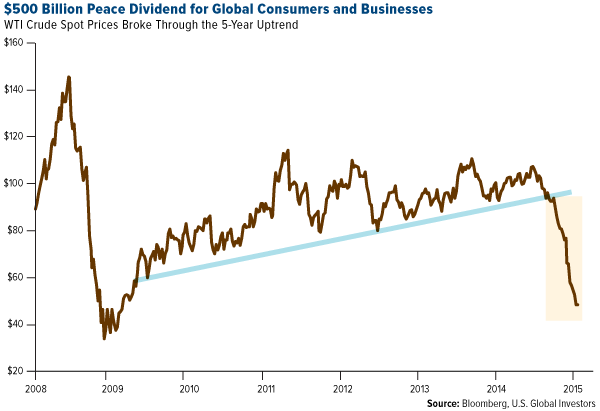
By all accounts, crude oil’s collapse was both unexpected and swift—and it looks as if the bottom has not yet been reached. Goldman Sachs recently reduced its six- and 12-month West Texas Intermediate (WTI) crude forecasts to $39 per barrel.
It’s disconcerting to recall that as recently as July, Brent oil set a record for trading between $107 and $112 per barrel for 12 consecutive months. It now trades for less than half that, at approximately $50 per barrel.
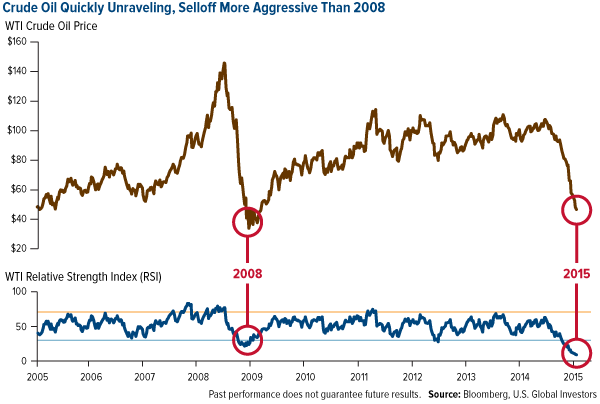
The selloff is so extended now that crude’s weekly relative strength index (RSI) is at 8.5, which is even lower than its RSI during the 2008-2009 crisis.
Where’s the Global Demand?
In response to unraveling crude prices, several companies, from the small caps to the majors, announced they would be laying off workers in huge numbers. Schlumberger, the world’s largest oilfield-services company, will reportedly be letting go of 9,000 of its workers, or 7 percent of its workforce; Suncor Energy, Canada’s largest, will cut 1,000 members of its staff and slash $1 billion in capital spending.
Many more companies have had little choice but to cut costs by halting exploration and production. The U.S. oil rig count saw its largest one-week drop in six years, losing 74 last week alone. As disconcerting as all this might sound—especially the job losses—these decisions are necessary to rebalance supply and demand and stabilize prices.
After peaking at $10 per 1,000 cubic feet in 2008, prices for natural gas—remember, it’s the worst-performing commodity of the last 10 years—plummeted and never fully recovered, which is why you see a gradually diminishing number of gas rigs in the chart below.
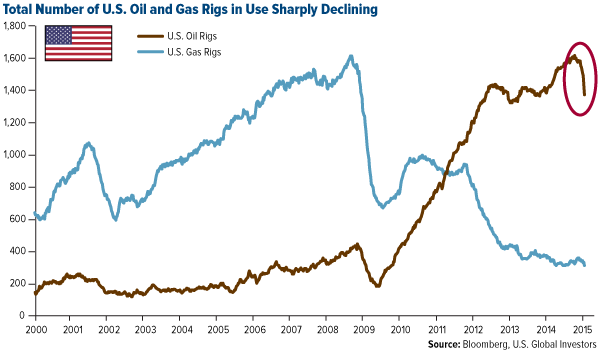
When the shale oil revolution began in 2009, the number of rigs steeply ramped up, adding approximately 200 new rigs each year. And not just any rigs, but much more efficient, technologically-advanced pieces of machinery, capable of extracting crude from places that until now were inaccessible.
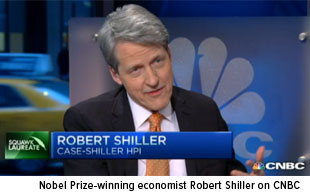 That’s what American ingenuity has given the world: cheap oil and cheap fuel. Speaking on CNBC last week, Nobel Prize-winning economist Robert Shiller praised the U.S.’s drive and innovative spirit: “This country is proud of our oil technology and it’s been boosting our spirit, our animal spirits.”
But just as the U.S. has provided the world with plentiful oil, the rest of the global economy has cooled, especially Europe, choking demand.
“The global economy today is much larger than what it used to be,” World Bank Chief Economist Kaushik Basu recently stated, “so it’s a case of a larger train being pulled by a single engine, the American one.”
Tough Times Don’t Last Forever
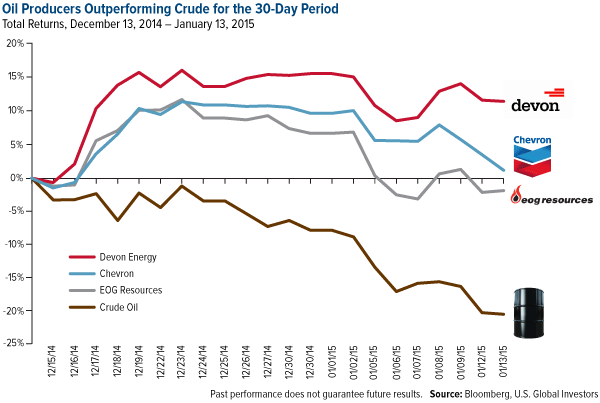
Speaking to Fox Business last Monday, PSPFX portfolio manager Brian Hicks explained where we continue to see opportunity and value in this low-price environment:
Certainly the [oil] selloff is getting long in the tooth and we’re actually becoming more and more constructive as [it] continues… These prices are not sustainable [and] not high enough to replace production going down a few years from now. We think the stocks look very attractive here, and if you look at their performance to crude oil, they’ve actually been outperforming since mid-December.
Michael Waring, CEO and Chief Investment Officer of Toronto-based Galileo Global Equity Advisors, visited our office last week and reminded our team of the cyclical nature of the energy sector. We’ve been through similar downturns in crude oil, Michael noted—in 1986 and 2008-2009, most recently.
“I’ve seen this movie so many times, I already know the ending,” Michael said, suggesting that oil has tended to move back to its mean eventually.
The chart below shows the inverse relationship between crude and the dollar, going back to 1984. The current standard deviation spread between the two is clearly widening to 1985 and 2008-2009 levels. But as strong as the dollar or as depressed as oil got, both eventually reverted back to their means.
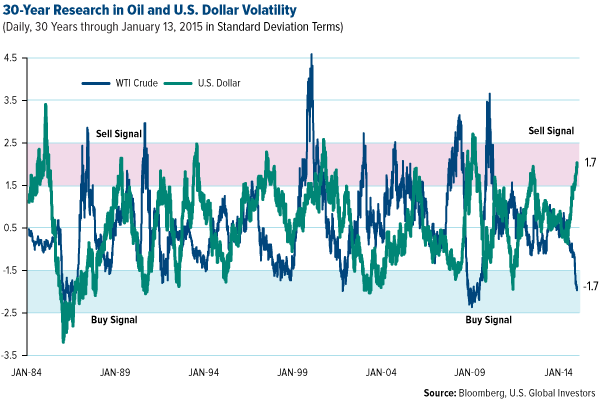
For the past 30 years, the 12-month rolling sigma or volatility for oil is ±30 percent 70 percent of the time; the dollar’s is ±9 percent. Today the odds are high that the dollar will correct and oil will rise. In 30 years, this is the third-widest gap between oil falling and dollar rising. But if you look over the same amount of time, you’ll see that oil has historically bottomed in February and subsequently rallied.
I cannot stress enough how greatly low gasoline prices have benefited consumers. They might also contribute to non-oil-services employment. According to BCA Research:
In the U.S., the decline in gasoline prices should boost household disposable incomes by around $150 billion this year, with an additional $30 billion coming from lower heating bills [and] decreased airline fares… The money spent, in turn, will generate additional demand for goods and services. This will lead to faster employment growth, translating into more income and spending.
Mark Your Calendars
- I just presented at the 20th Anniversary Vancouver Resource Investment Conference 2015. I’ll be sure to inform you of the main takeaways from the conference.
Watch my preconference interview with Vanessa Collette, host of Cambridge House Live.
- This Wednesday, January 21, we will be hosting our first webcast of the year, “Bad News Is Good News: A Contrarian Case for Commodities.” The presenters include me, Director of Research John Derrick and portfolio managers Brian Hicks and Ralph Aldis. Don’t miss out on this special opportunity to gain expert insight on where commodities might be headed this year!
You can register here.
- On Wednesday, February 18, we will be conducting our second webcast, which will focus on China and Emerging Europe.
- And finally, look out for our Shareholder Report magazine, which will be arriving in mailboxes soon!
********
Please consider carefully a fund’s investment objectives, risks, charges and expenses. For this and other important information, obtain a fund prospectus by visiting www.usfunds.com or by calling 1-800-US-FUNDS (1-800-873-8637). Read it carefully before investing. Distributed by U.S. Global Brokerage, Inc.
Past performance does not guarantee future results.
Foreign and emerging market investing involves special risks such as currency fluctuation and less public disclosure, as well as economic and political risk. Because the Global Resources Fund concentrates its investments in specific industries, the fund may be subject to greater risks and fluctuations than a portfolio representing a broader range of industries.
The Goldman Sachs Commodity Index is a composite index of commodity sector returns, representing an unleveraged, long-only investment in commodity futures that is broadly diversified across the spectrum of commodities.
Fund portfolios are actively managed, and holdings may change daily. Holdings are reported as of the most recent quarter-end. Holdings in the Global Resources Fund as a percentage of net assets as of 9/30/2014: Alcoa, Inc. 1.40%; Chevron Corp. 1.90%; Devon Energy Corp. 1.82%; EOG Resources, Inc. 2.13%; Ford Motor Co. 0.00%; Schlumberger Ltd. 0.00%; Suncor Energy, Inc. 2.13%.
Standard deviation is a measure of the dispersion of a set of data from its mean. The more spread apart the data, the higher the deviation. Standard deviation is also known as historical volatility.
All opinions expressed and data provided are subject to change without notice. Some of these opinions may not be appropriate to every investor. By clicking the link(s) above, you will be directed to a third-party website(s). U.S. Global Investors does not endorse all information supplied by this/these website(s) and is not responsible for its/their content.
 Frank Holmes is the CEO and Chief Investment Officer of U.S. Global Investors. Mr. Holmes purchased a controlling interest in U.S. Global Investors in 1989 and became the firm’s chief investment officer in 1999. Under his guidance, the company’s funds have received numerous awards and honors including more than two dozen Lipper Fund Awards and certificates. In 2006, Mr. Holmes was selected mining fund manager of the year by the Mining Journal. He is also the co-author of “The Goldwatcher: Demystifying Gold Investing.” Mr. Holmes is engaged in a number of international philanthropies. He is a member of the President’s Circle and on the investment committee of the International Crisis Group, which works to resolve conflict around the world. He is also an advisor to the William J. Clinton Foundation on sustainable development in countries with resource-based economies. Mr. Holmes is a native of Toronto and is a graduate of the University of Western Ontario with a bachelor’s degree in economics. He is a former president and chairman of the Toronto Society of the Investment Dealers Association. Mr. Holmes is a much-sought-after keynote speaker at national and international investment conferences. He is also a regular commentator on the financial television networks CNBC, Bloomberg and Fox Business, and has been profiled by Fortune, Barron’s, The Financial Times and other publications. Visit the U.S. Global Investors website at http://www.usfunds.com. You can contact Frank at: [email protected].


