Peculiar Markets


Last week, the heading, ‘Miracle or hoax?’ was a reference to the strange strength of the DJIA following the dire warnings for markets should Brexit happen – as it did. It became even more of a mystery with sustained strength last week to set another all-time high. The US dollar index also rallied to new recent highs. One explanation for this and other similarly strange trends might be found in a news release on the day after the voting. The G-7 Finance Ministers and Central Bank Governors stated that “G7 central banks have taken steps to ensure adequate liquidity and to support the functioning of markets. We stand ready to use established liquidity instruments to that end.” It therefore seems that the strength of Wall Street and the US dollar is clearly not a miracle; it has been wrought purely by the hand of man, in the form of the central banks.
At the same time, the past week or so has seen the strongest, sustained attack on gold and silver for quite some time. However, the results must be as disappointing to those who launched the attacks as the central banks are pleased about how Wall Street and the dollar had responded to their supportive efforts. Where, in the past, such attacks would have many longs running for cover and then waiting to get in at much lower prices, this time around the volume of long positions being closed, still large on some days, often are fewer than the new long positions that are opened in later months.
This applies in particular to silver. While gold is being hammered, conceivably to try and shake silver longs loose, buyers of silver futures are using the new low prices to add to their positions, resulting in silver open interest setting new all time highs, one after another. If, as has been presumed here for a long time, silver presents a more serious threat to stability in the markets, this contrary behaviour must now be a cause of great concern to those who want to see lower metal prices. Should they now continue to depress the silver price, even in combination with gold, they will be exhibiting the behaviour labelled as ‘insane’ – repeating the same action, hoping the result will change.
History has shown that manipulation can be successful for a long time; for example, the DJIA has been visibly supported during sudden weakness at least since 2011. It is also known that markets that have been pushed far away from where they ought to be, become very vulnerable to even a small black swan. In these times of turmoil and turbulence on a global scale, the odds favour the landing of such a swan at any time. It is difficult to accept that the unexpected Brexit and the upheaval in interest rate markets in particular, did not cause dislocations in the massive rate derivatives market. There has to be massive intervention and fire fighting to prevent one of the major financial institutions that had a large bond derivatives position in the ‘wrong’ direction to go belly up going on below the public radar.
The question is how far intervention can be stretched before it fails.
Euro-Dollar
The new tentative support line for the euro was added to the analysis last week on the off chance that it would rebound higher off that support. More weakness last week just failed to break lower, holding right at that support at line L ($1.0962). If the euro does break lower this week, it will indicate further woes for Europe. While Deutsche Bank seems to be working on building a black swan, Italian banks appear to be trying to hatch their own version. However, more acts of terror, new troubles out of Turkey, disputes within NATO, anti-migrant feelings running higher in some countries and threatening the established order, among others. Europe is also not the only trouble spot that could upset the forex cart!
A rebound higher off line L and a recovery back above bear channel UV ($1.1191) would signal that the effects of Brexit really have been contained. Which situation could change overnight!
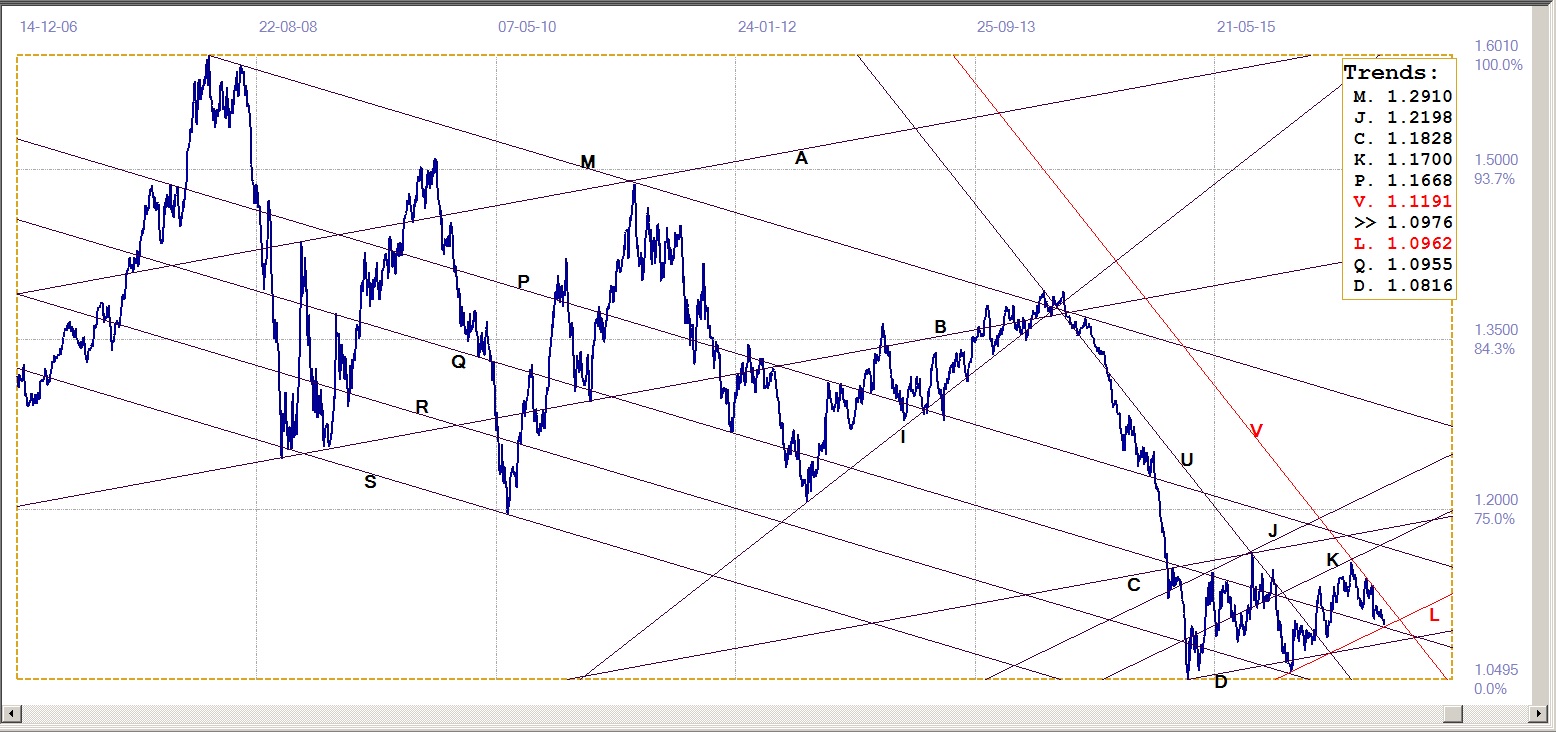
Euro-dollar, last = $1.0976 (www.investing.com )
Dow Jones Industrial Average (DJIA)
Another new high, one after the other! Watching the DJIA during the trading day it soon becomes clear that there is relentless effort to ensure that no small correction can build momentum to become a large correction. Also prominent, with very rare exceptions, is the late afternoon rally, irrespective whether the DJIA was up for the day, or whether the rally tries to turn a down day into one the media will like.
It does not make sense that the DJIA should be setting all time highs while the US economy is in such a poor state that the Fed simply cannot increase rates. That is not a miracle or a hoax, but must be intervention intended to create a resemblance of economic growth for Main Street’s consumption in this election year.
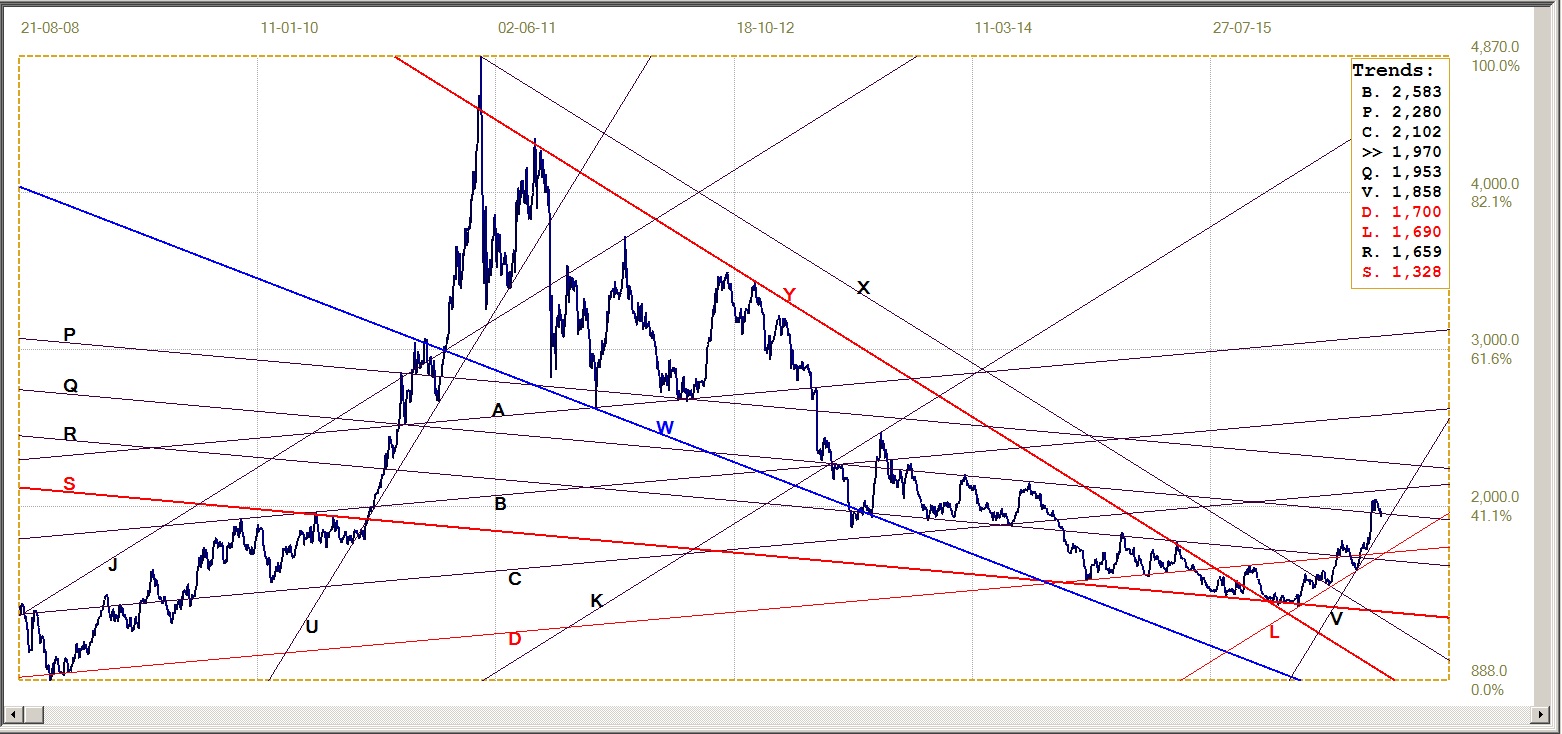
The first resistance in this analysis is line A (18836), almost 250 points above the close on Friday and approaching the 19 000 level – something that as recently as a few weeks ago would have seemed completely out of reach. If this rally is to reach a second goodbye kiss on line L (19196) after the break below steep bull channel KL, the DJIA can extend well above 1900 before reaching the next resistance.
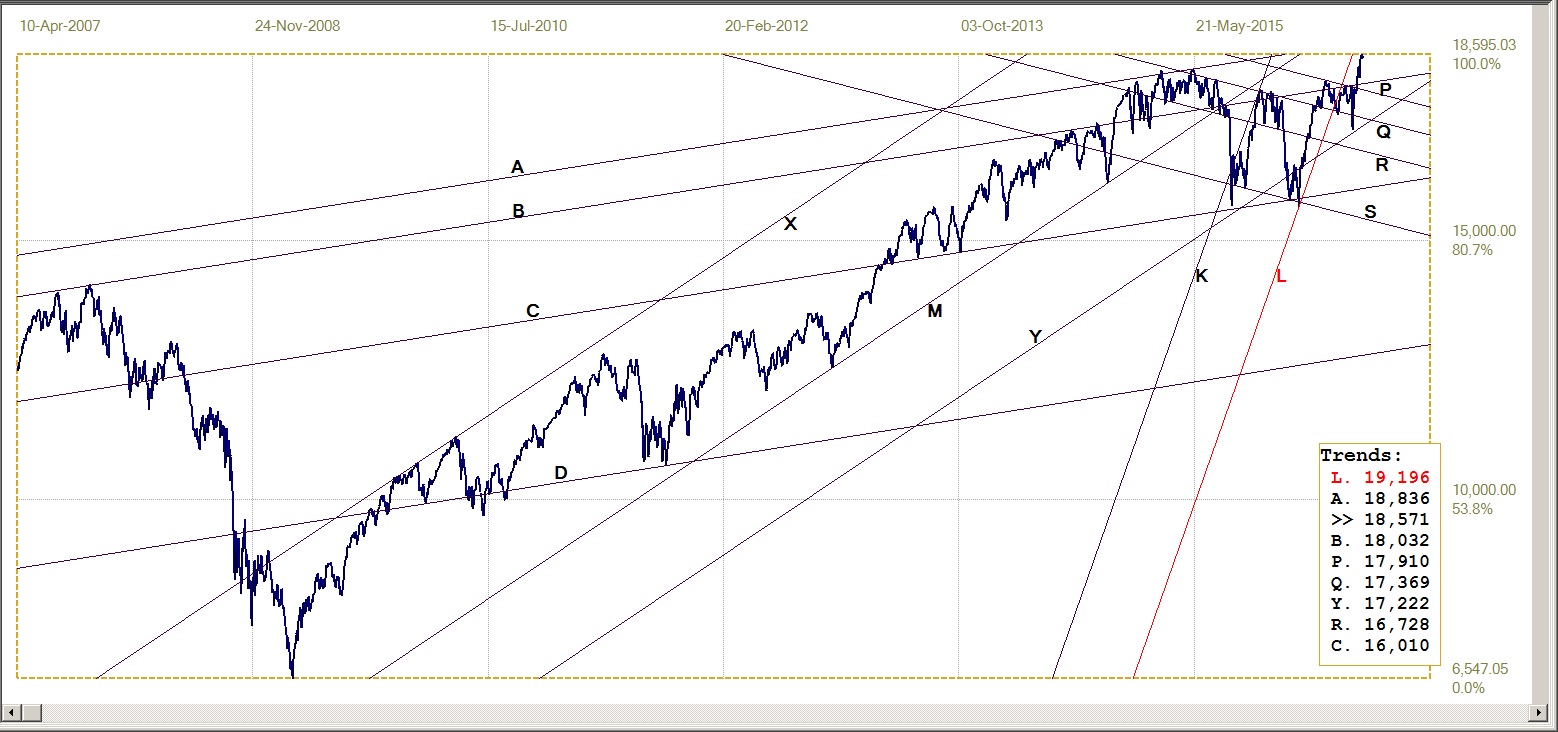
Dow Jones Industrial Index, last = 18571 (money.cnn.com)
Gold PM Fix - Dollars
After the break below the initial steeper bull channel of which line V ($1396) is the lower boundary, the neat lower channel, KL ($1270) acted as good support. After the rebound off line L, the gold price broke above resistance at lines C ($1283) and Q ($1288), to reach higher and test the resistance at line V. The attempt to break higher has failed and gold slipped back under the intense selling of the past week.
The new selling is not having the desired effect, as mentioned in the introduction – the longs are not closing positions en masse, as they had regularly done in the past under bouts of selling. If only some small specs are closing, while the large players who are long are adding to their positions, it could be foolish to continue the selling – unless the means exist to force the gold price down many more tens of dollars.
It could be that doing so could actually be counterproductive. While gold longs are shaken loose, the then much lower price of silver could bring many more persistent buyers of silver out of the woodwork; that could greatly escalate the already fierce dilemma this metal presents to the Cartel. A case of the devil and the deep blue sea that will not be easy nor without risk to resolve, if at all possible.
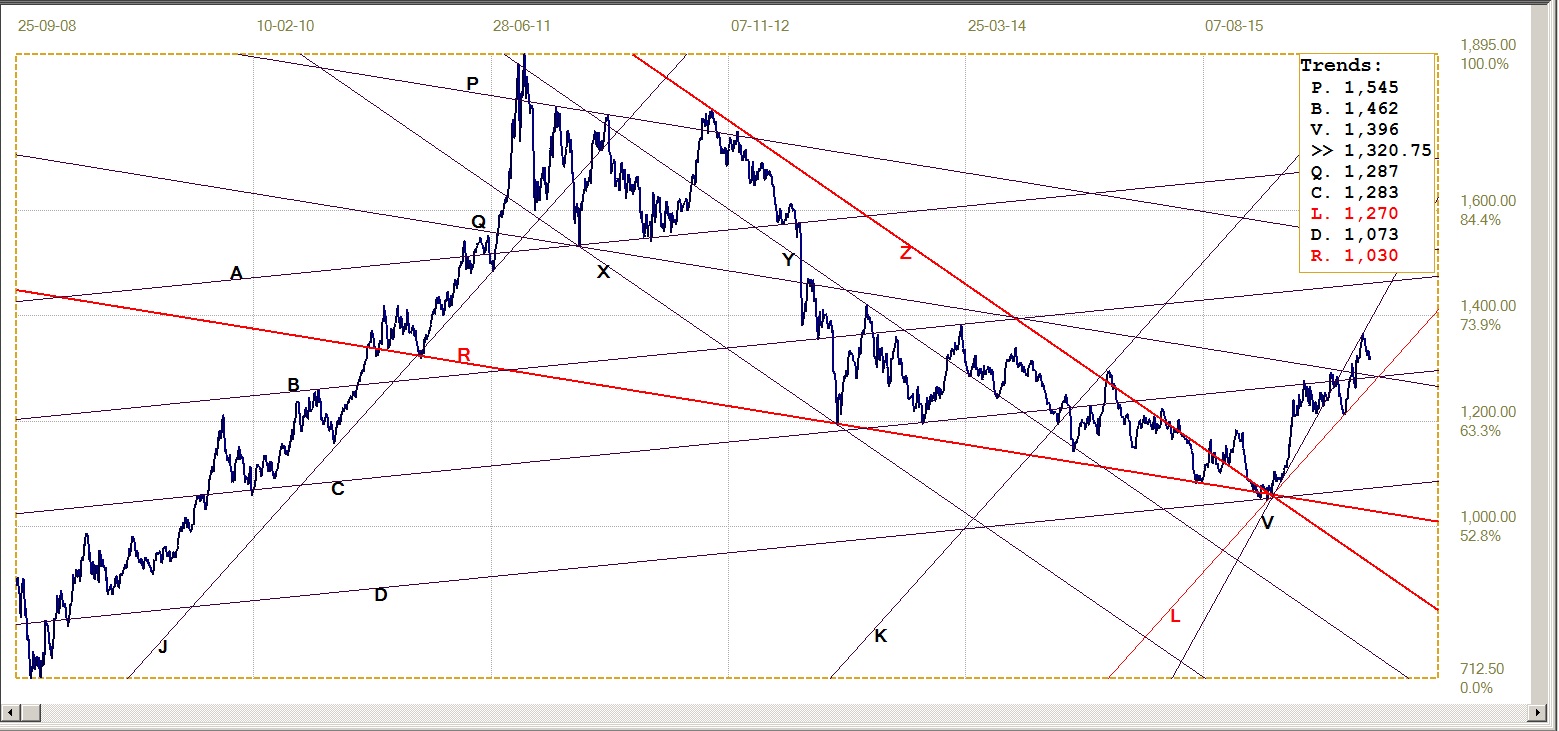
Gold price – London PM fix, last = $1320.75 (www.kitco.com )
Gold PM Fix – Euro-gold
Two weeks ago, the euro price of gold failed to hold the break above resistance at line R (€1203). At least the price did not extend lower, but held around line R. On Friday, the euro closed at a new recent low against the US dollar; this was enough to bring the euro price of gold to just above line R again – having done so despite the struggling price of gold
A definite break below the support at line R – whether from a stronger euro, or the price of gold declining even more, or a combination of the two – has to hold at the support at line W (€1180) for the euro price of gold to retain its bullish bias. This would still leave the steep bull channel KL (€1124) intact; however, a decline down to test that support would imply that the current steep rally in the euro – and dollar – price of gold is interrupted.
Since, as mentioned in the introduction, the dollar, similar to the DJIA, is suspected of being supported. While there it is also likely to be a flight to safety from outside the US, the timing of when the dollar index rallies – mainly during US trading hours – suggests the origin of the support is local. This may not last, to favour the euro.
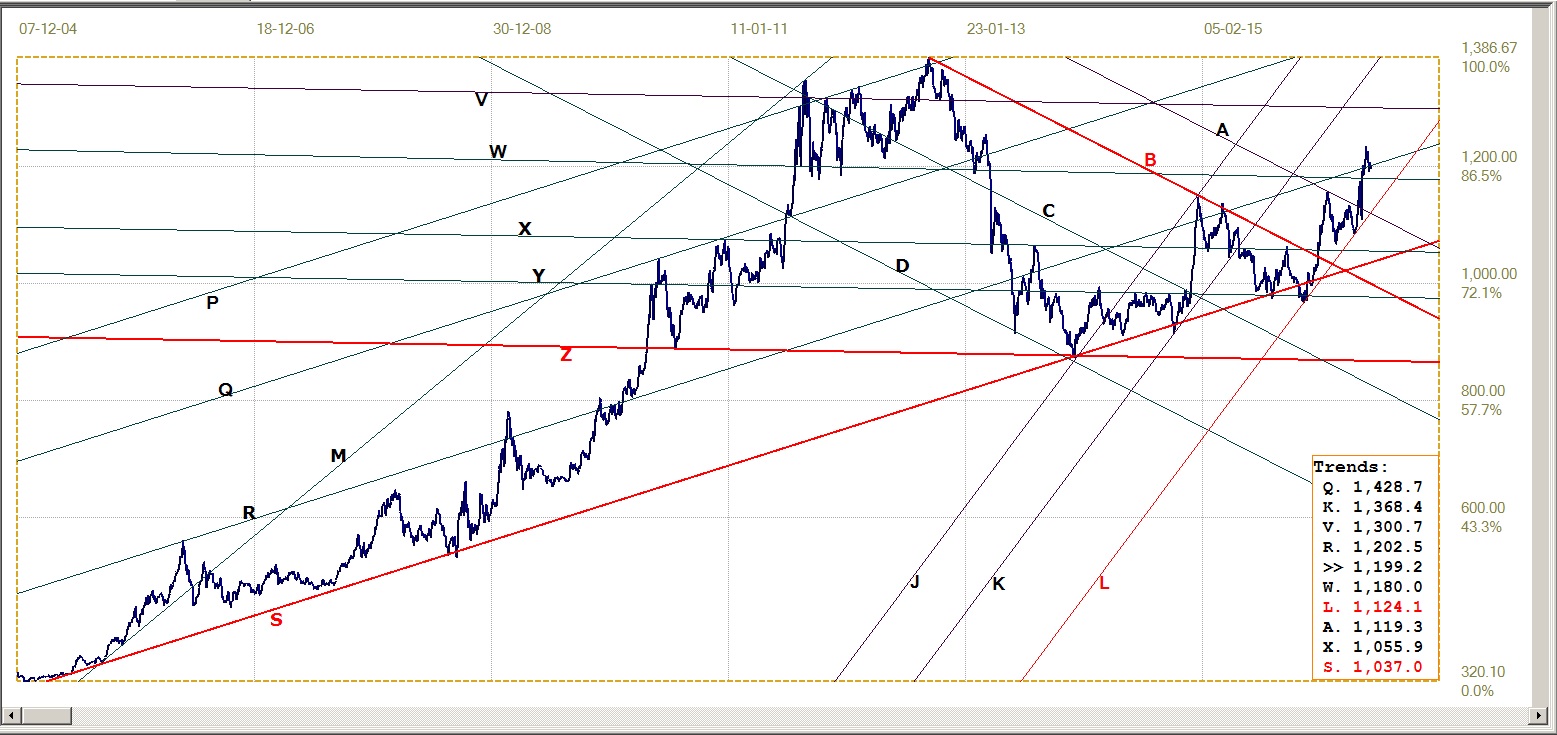
Euro Gold Price – PM Fix in Euro, last = €1199.2 (www.kitco.com)
Silver Daily Fix Chart
Silver Daily Fix, last = $19.70 (www.kitco.com )
Silver is holding to the steeper bull channel UV ($18.58) after it had rebounded off the bottom of the shallower bull channel KL ($16.90) some time ago. However, the break above resistance at line Q ($19.53) failed to hold when the selling recently became more intense. The break lower was limited in extent and in duration, and silver managed to claw back to just above line Q during the past week.
The new break higher has to hold and extend higher, then to successfully challenge resistance at line C ($21.02), for the new bull market to regain momentum. In this respect the positive response of buyers when the price dipped lower – as reflected in the increase in open interest when normally longs would run for cover when the price is attacked – raises hopes that such a challenge could happen soon.
U.S. 10-Year Treasury Bond
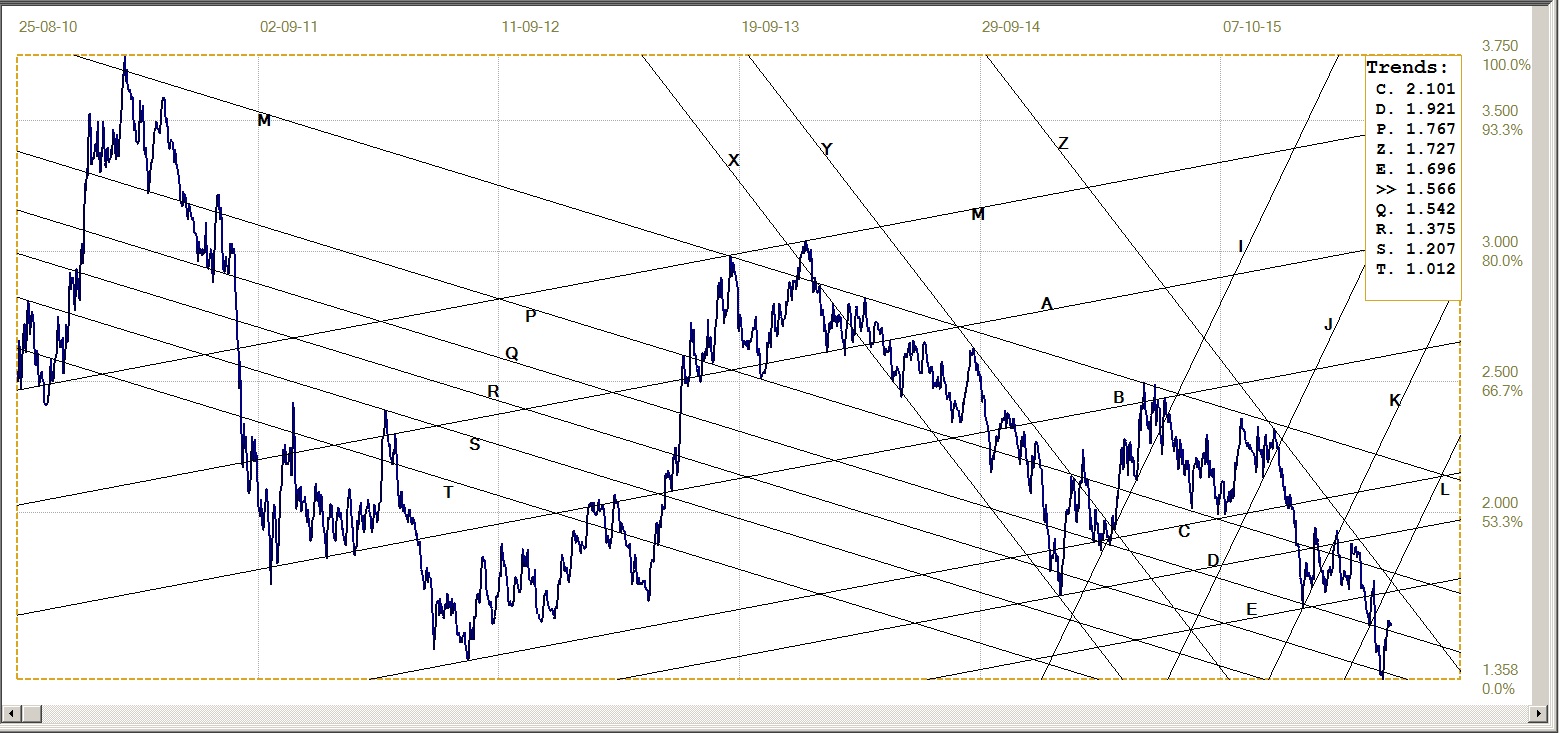
U.S. 10-Year Treasury Note, last = 1.566% (www.investing.com )
The yield on the US 10-year Treasury bond rebounded steeply higher off the recent record low. That all time low yield is a result of the initial panic after Brexit and now that the main markets – equities and currencies – have stabilised and turned more bullish again, the panic has subsided and profit taking had the yield in a steep rising trend.
The break above market support for the Treasuries at line Q (1.542%) – important support over the long term – did not extend mush further, but settled in a sideways knot. This could be preparatory to extending the trend higher, or warn that a trend reversal is due soon. This would have to break back below line Q to be bullish.
West Texas Intermediate Crude. Daily close
After the psychologically important $50 level moved out of reach some weeks ago, the price of crude for a while held just above the support at lines D ($46.74) and T ($46.82) then broke lower to become more bearish. The initial break below bull channel UV ($55.14) was bearish Holding above lined D and T held promise that the bull trend could resume, however when the price broke below the two support lines the outlook became bearish. The steep bear channel, JKL ($46.42) has been added to the analysis and the bear outlook remains in place while this steep channel holds.
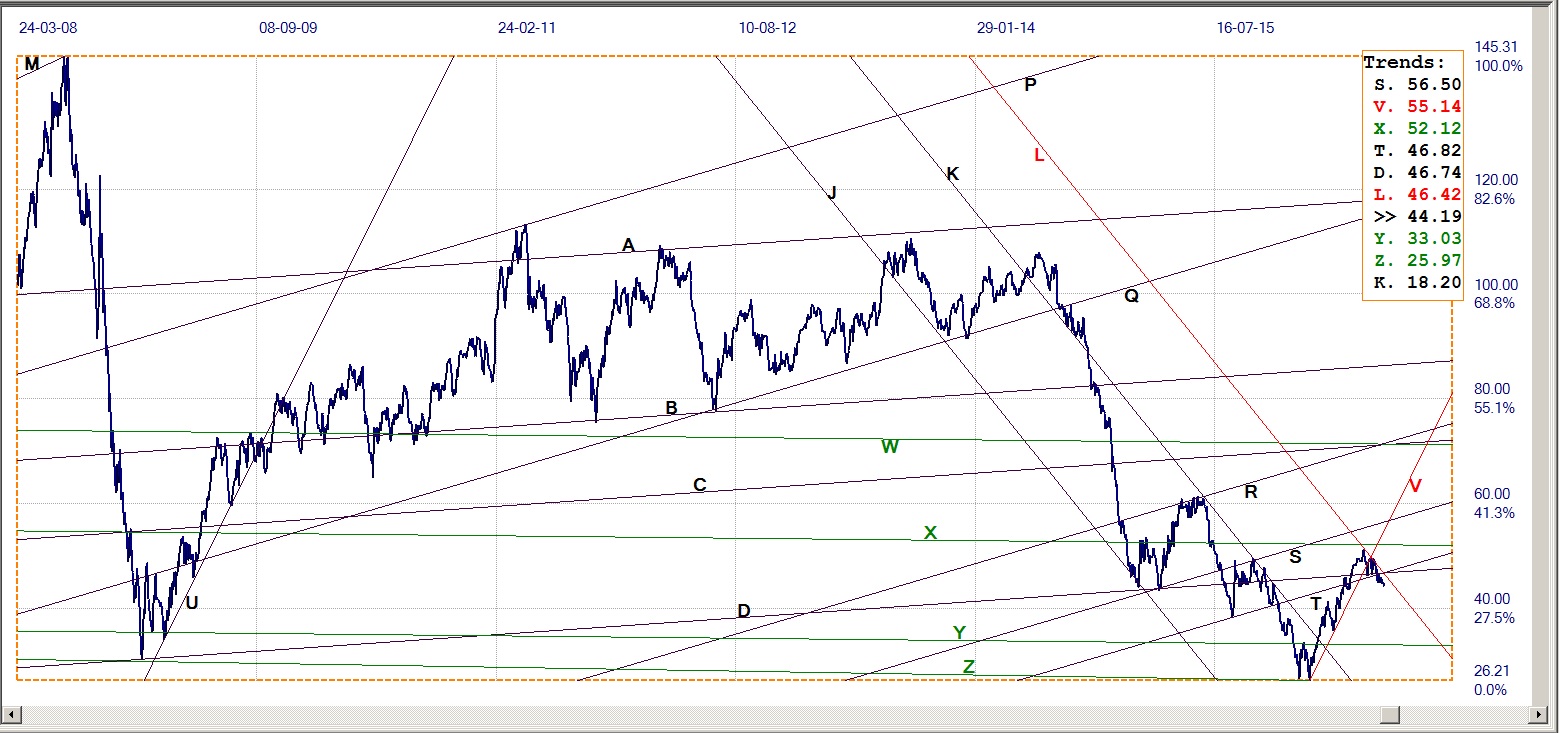
WTI Crude – Daily close, last = $44.19
©2016 daan joubert, Rights Reserved
chartsym (at) gmail(dot)com


