The Perfect Storm For Gold
 share
share
 share
share
 share
share
 share
share
 share
share

In December 1997, The Financial Times ran an article entitled “The Death of Gold.” Since then, the gold price in US dollars has increased 519I% from $288 to $1,780. Today, after many political events and crises we have evidence of the continuous and in many ways spectacular growth of the gold price. This confluence of many current events is creating a perfect storm for gold to increase dramatically more than we imagined.
Currency Devaluation
Typically, currency devaluation is always at the heart of a rising gold price. This has been taking place in all of the major fiat currencies, resulting in an average annual price increase in gold of over 10% since 2000.
For the naïve there is something miraculous in the issuance of fiat money. A magic word spoken by the government creates out of nothing a thing which can be exchanged against any merchandise a man would like to get. How pale is the art of sorcerers, witches, and conjurors when compared with that of the government’s Treasury Department.”
Ludwig von Mises
Since 1900, all major fiat currencies have been devalued by over 90%
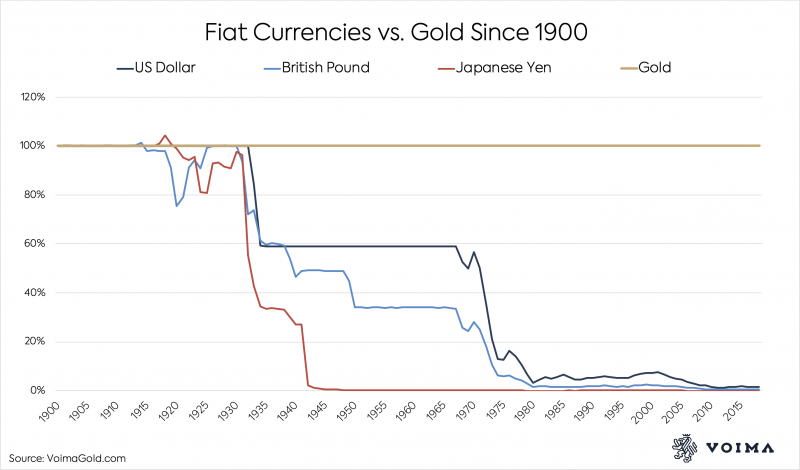
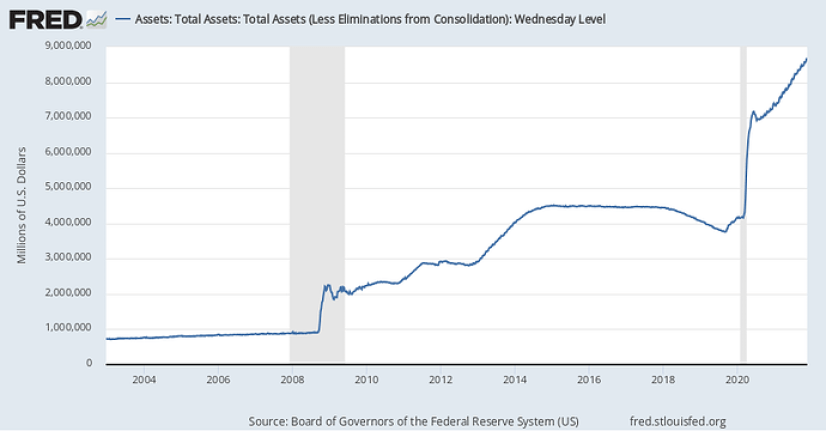
To understand currency devaluation, it is necessary to understand that all currency is created by governments issuing debt and then the central bank monetizing that debt by printing the currency. In 1960, the U.S. federal debt to GDP stood at 52.2%, whereas today it has grown to 125.9%. The Federal Reserve has increased its balance sheet by a historically unprecedented amount of over $7.5 trillion since 2008.
Because of this central bank policy, all western currencies are being devalued and this in turn leads to inflation.
Nations are not ruined by one act of violence, but gradually and in an almost imperceptible manner by the depreciation of their circulating currency, through excessive quantity.”
Nicholas Copernicus – 1525
Fed Chairman Powell has pumped trillions of newly printed dollars into the system in order to prop up the financial markets, but in the process has unleashed a tsunami of inflation that is unlike anything we have seen since the 1970s.”
Michael Snyder
As Currencies Are Devalued, Price Inflation Will Inevitably Follow
Inflation, as this term was always used everywhere and especially in North America, means increasing the quantity of money and bank notes in circulation and the quantity of bank deposits subject to check. But people today use the term ‘inflation’ to refer to the phenomenon that is an inevitable consequence of inflation, and that is the tendency of all prices and wages to rise.
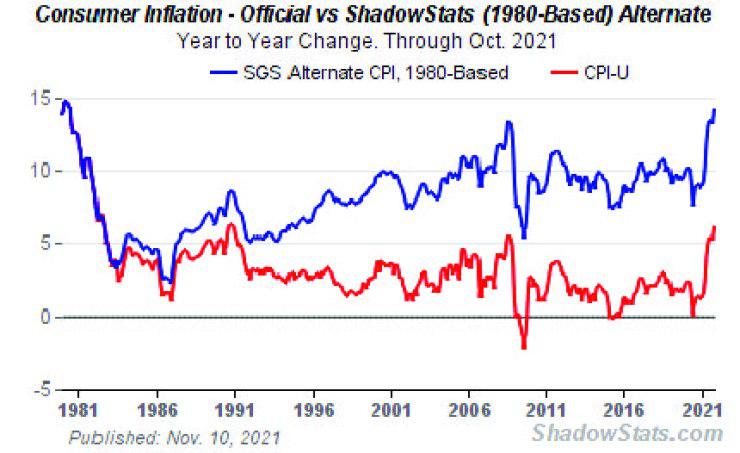
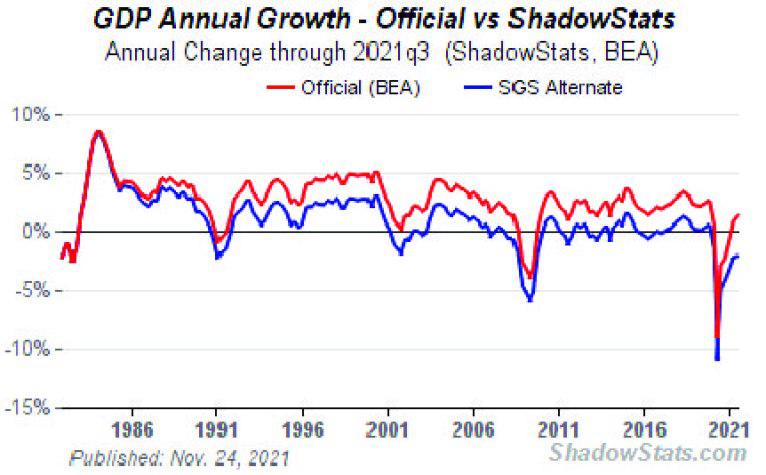
In October 2021, consumer inflation jumped to a four-decade high, the highest since the days of runaway inflation in the early 1980s. Headline year-to-year GDP inflation hit a 38-year-plus high of 4.53%.
According to John Williams of Shadowstats.com, if inflation was calculated using 1980s methodology, the CPI would be nearly 15%. Since treasury yields are about 2%, the true inflation-adjusted treasury yield would be about -13%.
Inflation is destined to go even higher in 2022. Many of the biggest corporations have already announced price increases that will take effect in 2022.
Declining GDP — Stagflation
The…economy is facing a period of stagflation in which both growth and inflation disappoint.”
David Walton—Goldman Sachs
Stagflation is worse than a recession. It’s because stagflation combines the bad economic effects of a recession (stock declines, unemployment increases, housing market dips) with inflated prices. When this is dragged out over the long term, it becomes a problem that can have a big impact on societal habits.
To make matters worse, we are already experiencing declining GDP together with increasing inflation. This is due to an unusual combination of supply chain disruptions and labour shortages due to COVID-19 policies that have been implemented in most western countries.
Supply Chain Disruptions
The COVID-19 pandemic impact and the disruptive government responses continue to have enormous negative impact on global supply chains. Beyond COVID-19, compounding profound governance incompetence, media bias, political conflicts, disintegration of society split by “Covid politics”, natural disasters, cybersecurity breaches, international trade disputes have negatively impacted supply chains leading to product shortages, distribution delays, and manufacturing disruptions. The lockdowns imposed in many countries have led to revenue declines and many bankruptcies, with many more to come. Making matters even worse is the implementation of vaccine mandates, causing over 4 million people to leave the workforce in the U.S. This will lead to other societal problems due to lack of first responders, nurses, firefighters and police.
Some analysts expect that it will take years for the capacity constraints and backlogs to ease.
Labour Shortages
How can the U.S. economy be recovered minimally, with October 2021 payroll employment still 2.8% shy of recovering its pre-pandemic/pre-recession peak? Except for the severe recessions in 1981 and 2007, and despite being well off bottom, the current pandemic-driven payroll shortfall remains deeper than anything seen at the troughs of the other six U.S. recessions all the way back to 1957.
Even with unemployment well above pre-pandemic levels there is also pressure on wages resulting in companies having to pass on additional wage costs, we have the beginning of a wage price spiral.
The Tax Foundation estimates that the Democrats’ new welfare bill will destroy 103,000 jobs over the next 10 years.
Many of these job losses are due to tax increases, increased regulatory burdens and energy inefficiency introduced by the Green New Deal.
The job losses projected by the Tax Foundation are in addition to hundreds of thousands of job losses facing the economy in the short run because of vaccine mandates and the firing of employees who refuse to be injected with the gene-modification treatments called ‘vaccines.’ In the U.S., 4.4 million people have already quit their jobs due to vaccine mandates.
The Misery Index
Since the launch of the fiat money era in the early 1970s, economies have gone very wrong, and unemployment and inflation rates have skyrocketed. Campaigning in the late 1970s, then-presidential candidate Ronald Reagan added the two numbers together and famously named the result the Misery Index. Subsequently, the Misery Index became the bellwether for stagflation—the combination of economic stagnation and runaway inflation.
The Misery Index (sometimes known as the Economic Discomfort Index, or EDI) is simply the sum of the inflation rate plus the unemployment rate. The higher the combined score, the worse the economic situation.
Misery Index By US Presidential Administration
Index = Unemployment rate + Inflation rate | |||||||
President | Time Period | Average | Low | High | Start | End | Change |
1948–1952 | 7.88 | 3.45 – Dec 1952 | 13.63 – Jan 1948 | 13.63 | 3.45 | -10.18 | |
1953–1960 | 9.26 | 2.97 – Jul 1953 | 10.98 – Apr 1958 | 3.28 | 9.96 | +5.68 | |
1961–1963 | 7.14 | 6.40 – Jul 1962 | 8.38 – Jul 1961 | 8.31 | 6.82 | -1.49 | |
1963–1968 | 6.77 | 5.70 – Nov 1965 | 8.19 – Jul 1968 | 7.02 | 8.12 | +1.10 | |
1969–1974 | 10.57 | 7.80 – Jan 1969 | 17.01 – Jul 1974 | 7.80 | 17.01 | +9.21 | |
1974–1976 | 16.00 | 12.66 – Dec 1976 | 19.90 – Jan 1975 | 16.36 | 12.66 | -3.70 | |
1977–1980 | 16.26 | 12.60 – Apr 1978 | 21.98 – Jun 1980 | 12.72 | 19.72 | +7.00 | |
1981–1988 | 12.19 | 7.70 – Dec 1986 | 19.33 – Jan 1981 | 19.33 | 9.72 | -9.61 | |
1989–1992 | 10.68 | 9.64 – Sep 1989 | 14.47 – Nov 1990 | 10.07 | 10.30 | +0.23 | |
1993–2000 | 7.80 | 5.74 – Apr 1998 | 10.56 – Jan 1993 | 10.56 | 7.29 | -3.27 | |
2001–2008 | 8.11 | 5.71 – Oct 2006 | 11.47 – Aug 2008 | 7.93 | 7.39 | -0.54 | |
2009–2016 | 8.83 | 5.06 – Sep 2015 | 12.87 – Sep 2011 | 7.83 | 6.77 | -1.06 | |
2017–2020 | 6.91 | 5.21 – Sep 2019 | 15.03 – Apr 2020 | 7.30 | 8.06 | +0.76 | |
2021–2021 | 9.77 | 7.70 – Jan 2021 | 11.29 – Jun 2021 | 7.70 | 10.19 | + |
Wealth Preservation
I believe that the times ahead will be radically different from the times we have experienced so far in our lifetimes, though similar to many other times in history.”
Ray Dalio
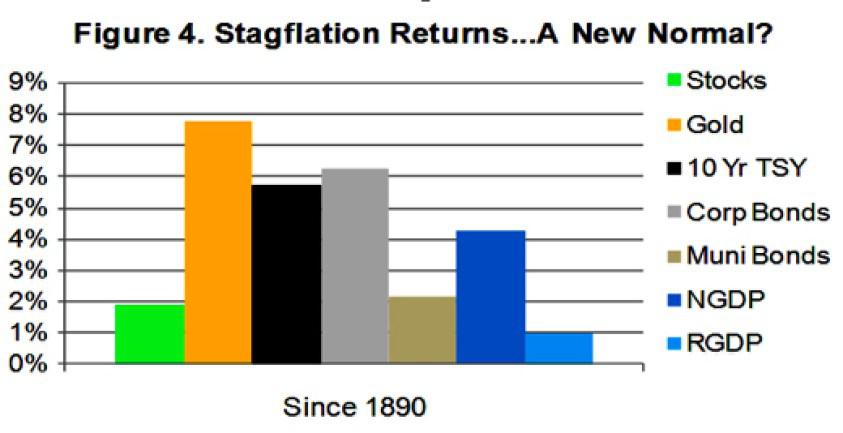
Source: https://www.etf.com/sections/features/6900-the-new-normal-and-asset-class-cycles.html/page/0/1
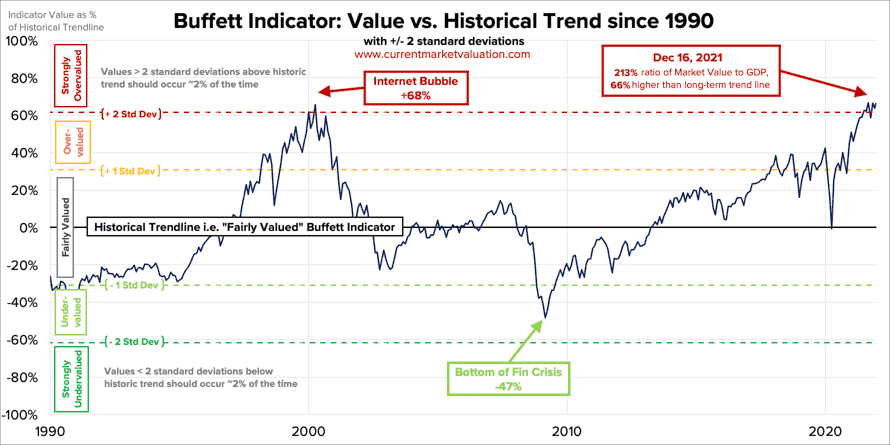
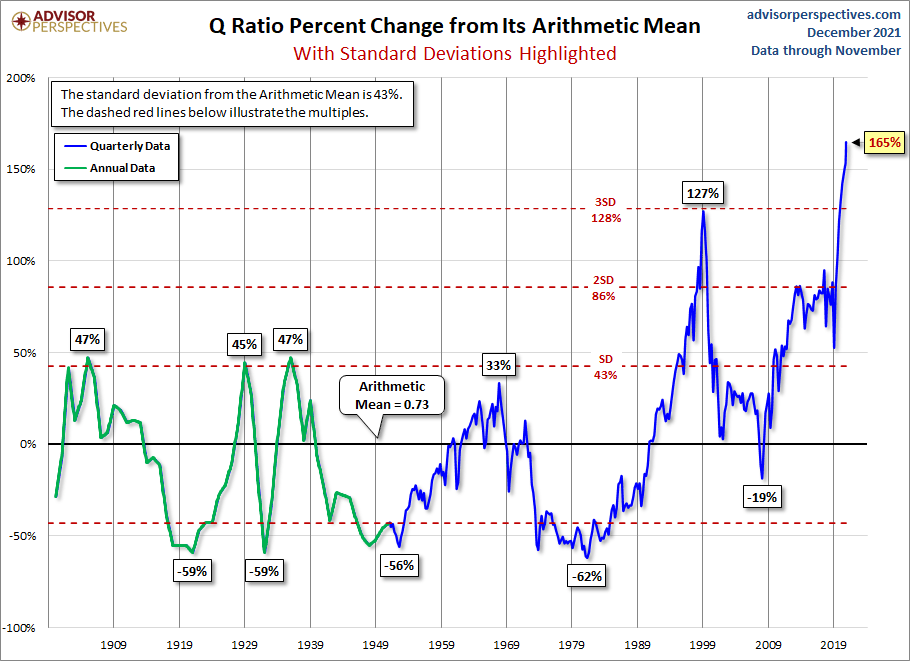
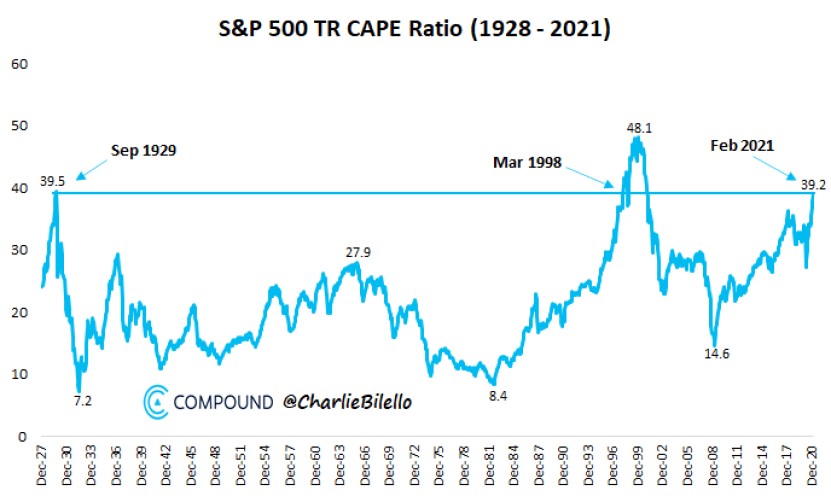
Overvalued Equity Markets
TTo add even more cause for concern, the U.S. equity markets are more overvalued than during the financial crisis of 2008 and, depending on the methodology, may be more overvalued than during the dot.com bubble in 1999 and even the 1929 crash. Although some of the excess money supply has resulted in consumer price increases, much of it has gone into the equity markets and real estate.
During past equity declines, gold has generated positive returns.
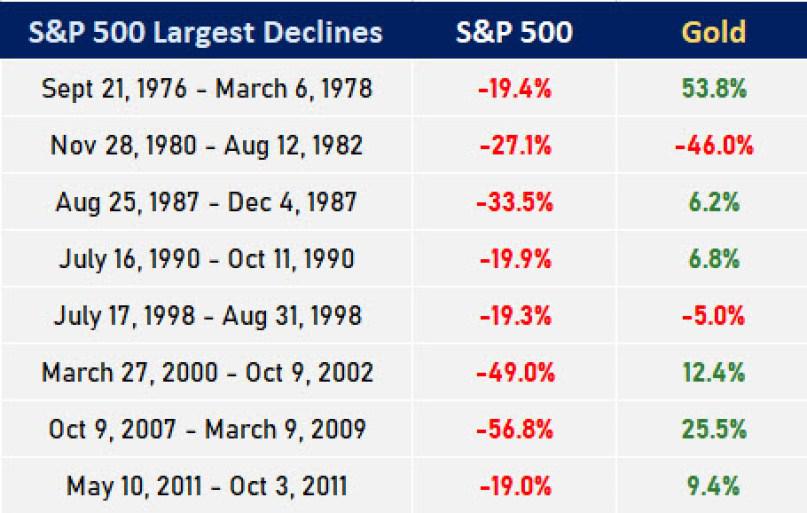
Source: https://www.gold-eagle.com/rate/price-of-gold/
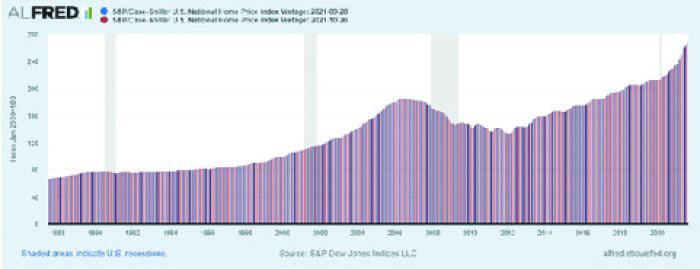
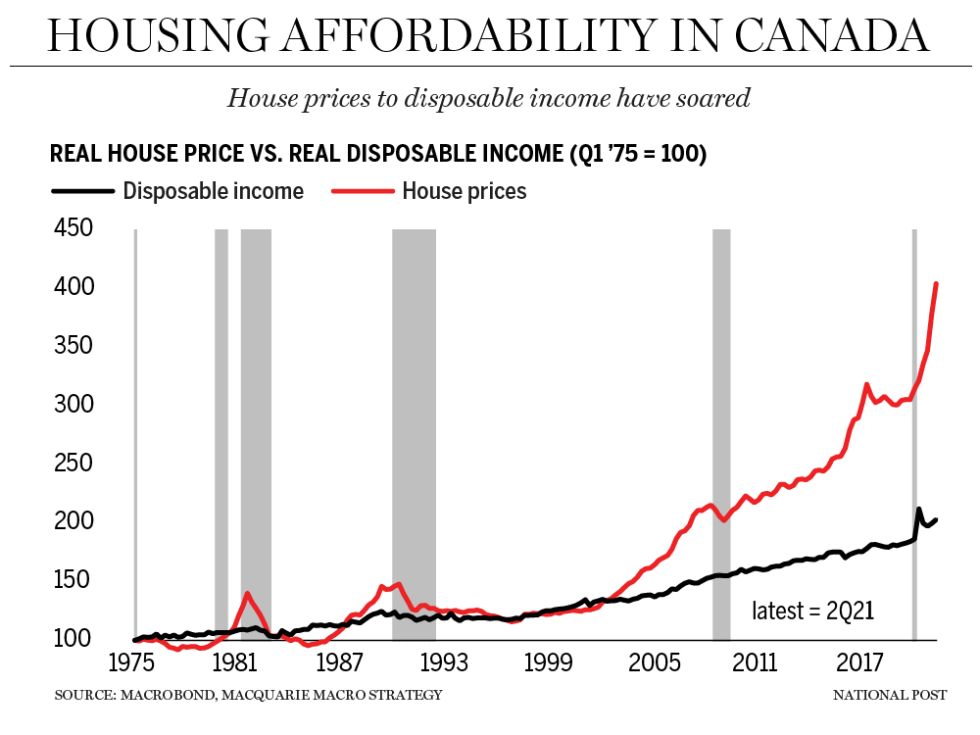
Overvalued Real Estate
AAccording to the Case Shiller National Home Price Index, home values are 38% higher than during the 2008 market crash.
The UBS Global Real Estate Bubble index ranks Toronto just behind Frankfurt among the major urban markets, with overpriced housing that is not supported by incomes and demands outsized mortgages.
Gold, in the end, is not just competition for the dollar; it is competition for bank deposits, stock and bonds and most particularly during times of economic stress—and that is the source of enduring interest amongst policymakers.”/em>
Paul Volcker
Gold In USD Has Been The Best Stagflation Performer Since 1973
AAAAR since Q1 1973*
Asset | Full Sample | Goldilocks | Reflation | Stagflation | Deflation |
Gold (USD / Oz) | 54.7 | -3.1 | 8.4 | 32.2 | 12.8 |
S&P 500 Index | 54.4 | 16.8 | 28.5 | -6.6 | 11.4 |
EAFE Equities | 29.5 | 10.5 | 18.8 | -11.6 | 11.7 |
US Tsy & Agency Bonds | 32.4 | 7 | 2.3 | 9.6 | 11.2 |
US Corporate Bonds | 44 | 10.9 | 8.6 | 6.1 | 14.1 |
S&P GSCI Index | 48.8 | 9 | 34.7 | 17.5 | -13.5 |
US Dollar Index | 5.5 | 4.6 | 0.6 | 0.9 | -0.7 |
The combined effects of currency devaluation, inflation and declining GDP, when taken together with overvalued equity and residential real estate, creates a perfect storm for dramatically increasing precious metals prices in the future. Every portfolio should have at least 20% allocated to bullion in order to preserve wealth, improve returns and reduce portfolio volatility. Investors need to consider that if they lose 50% of their portfolio, they will need to achieve gains of 100% just to break even. Although prices still may go up, it would be prudent to sit out the next few months in cash or gold. That will provide investors with the opportunity to reinvest in their favourite assets at considerable discounts at the bottom.
This is the perfect time to allocate to gold based on all the factors and data during this “perfect storm for gold”.
********
share
share
share
share
share
 Nick Barisheff is the founder, president and CEO of Bullion Management Group Inc., a company dedicated to providing investors with a secure, cost-effective, transparent way to purchase and hold physical bullion. BMG is an Associate Member of the London Bullion Market Association (LBMA). His website is www.bmgbullion.com.


