Platinum Technical Outlook


Let’s investigate the technicals of platinum using the weekly, monthly and yearly charts.
PLATINUM WEEKLY CHART
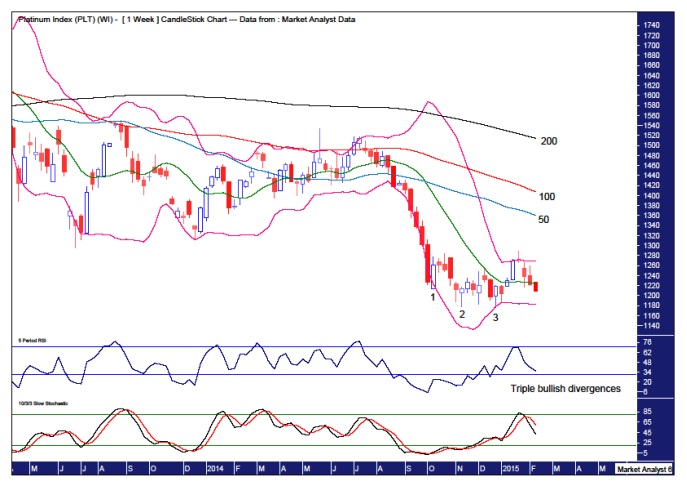
We can see a “three strikes and you’re out” low formation in place consisting of three consecutive lower lows. The third and final low was accompanied by triple bullish divergences in the Relative Strength Indicator (RSI) and Stochastic indicator. This has led to a decent rally but nothing spectacular. I’d like to see some further upside before the downtrend resumes.
And there can be no doubt that a downtrend dominates the landscape. That is evidenced by the moving averages I have added with time periods of 50 (blue), 100 (red) and 200 (black). These averages are in order as one would expect in a downtrend with the 200ma above the 100ma which in turn is above the 50ma. And this is the weekly chart so it is a solid downtrend indeed.
These moving averages look like they are just starting to set sail so to speak after trading sideways with some criss-crossing action. They are all now starting to turn down so the downtrend looks like it is about to build up some steam.
Price is quite a fair way below the 50ma and perhaps any further upside will be rejected at one of these moving averages. Let’s see.
The Bollinger Bands show the bands tightening up which is consistent with a consolidation or coming trend change. I certainly don’t expect a major trend change but I do favour higher prices before the downtrend resumes in full effect.
PLATINUM MONTHLY CHART
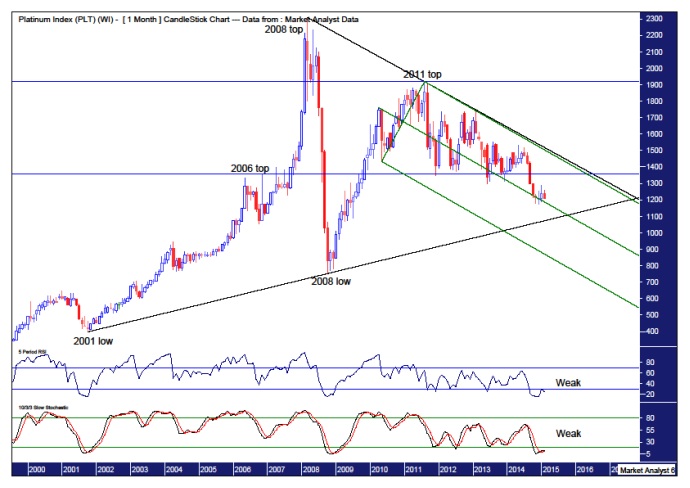
I have drawn a downtrend line across the 2008 and 2011 tops and an uptrend line along the 2001 and 2008 lows. This sets up a triangle formation which is holding price. These trend lines represent both resistance and support and breaking one will be bullish or bearish depending on which trend line is broken. Which scenario do I favour?
Price is currently in a downtrend which is highlighted by the Andrew’s Pitchfork I have drawn. Price can be seen to be trading down within the upper channel of this bearish pitchfork. Until price can break out above the upper channel line (which will also likely signify price breaking above the downtrend line), I continue to favour further downside which includes breaking below the uptrend line.
The lower indicators, the RSI and Stochastic indicator are both looking very weak having made recent new lows. Looking at this picture I just can’t get excited about any sustainable uptrend.
Old tops often provide support in future and that can be seen to have occurred with the 2006 top which is denoted by the lower horizontal line. We can see price found support around that level before finally succumbing in the second half of 2014. That support should now act as resistance and considering I’m expecting some further upside over the short term, price turning back down around there and resuming the downtrend looks like a good possibility.
Breaking out above the 2011 top doesn’t look a chance any time soon but that will be a bullish development whenever it does occur.
Let’s wrap it up by looking at the big picture with the yearly chart.
PLATINUM YEARLY CHART
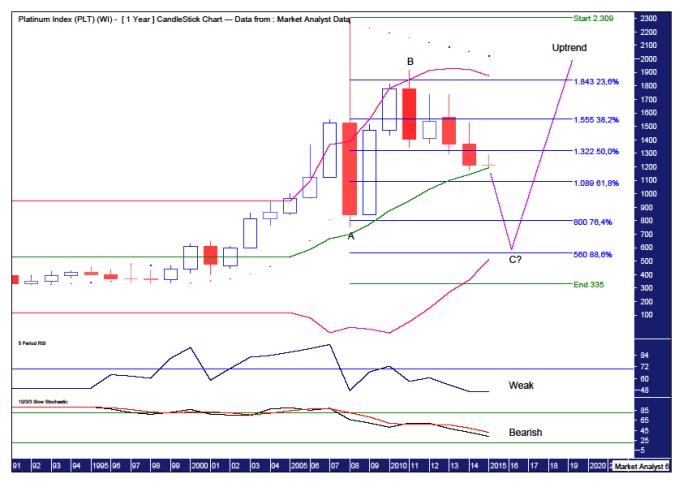
The lower indicators, the RSI and Stochastic indicator, look weak and don’t offer much solace for the bulls. Both are trending down and in weak territory.
The Parabolic Stop and Reverse (PSAR) indicator, which pertains to the dots, has a bearish bias with the dots above price.
To my eye, it looks like a massive ABC correction is taking place. Waves A and B are already complete which implies we are currently in wave C. I expect this wave C to make new yearly lows.
To determine some likely ending levels, I have added Fibonacci retracement levels of the move up from the 1998 low to 2008 high. The wave A low in 2008 at US$752 was just below the 76.4% level so I favour the wave C low zooming in on the 88.6% level which stands at US$560.
Finally, I have added Bollinger Bands which show the 2008 high traded well above the upper band which is consistent with solid highs. Price is currently at the middle band and considering the analysis already undertaken I favour price busting below as it makes its way to the lower band which is currently just below the 88.6% Fibonacci level and will likely be above it in 2016.
Once the wave C low is in place I expect the massive uptrend to continue which should see price reach new all time highs above US$2308 in the years to come.
********
My website is www.thevoodooanalyst.com
© 2014 Copyright The Voodoo Analyst - All Rights Reserved
Disclaimer: The above is a matter of opinion provided for general information purposes only and is not intended as investment advice. Information and analysis above are derived from sources and utilising methods believed to be reliable, but we cannot accept responsibility for any losses you may incur as a result of this analysis. Individuals should consult with their personal financial advisors. Put simply, it is JUST MY OPINION.


