Precious Metals Bear Phase III…Dead Ahead
(Part 1)


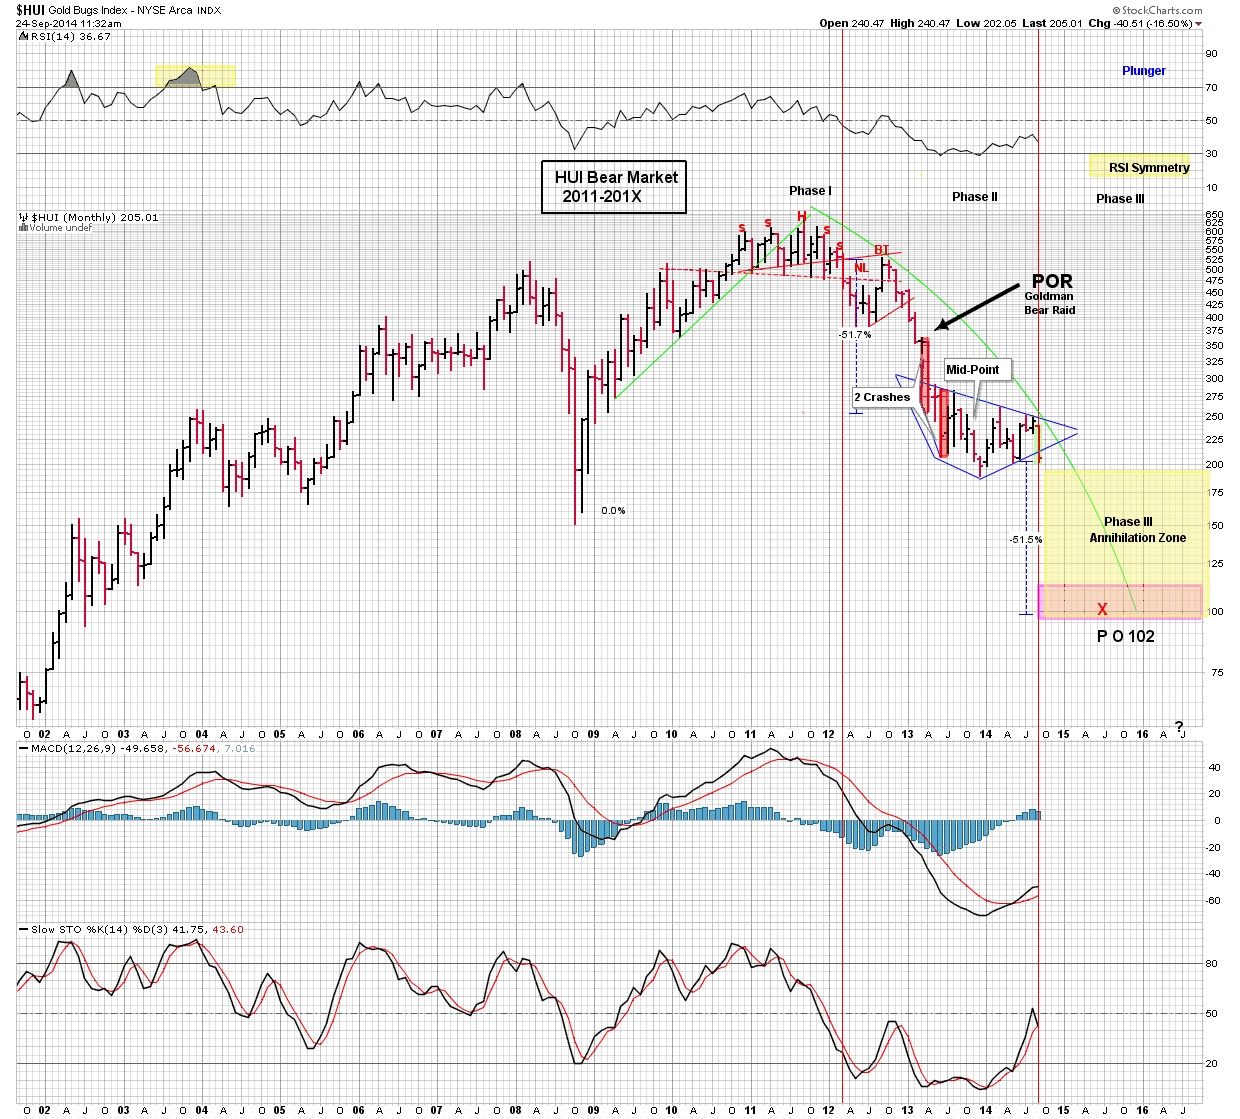
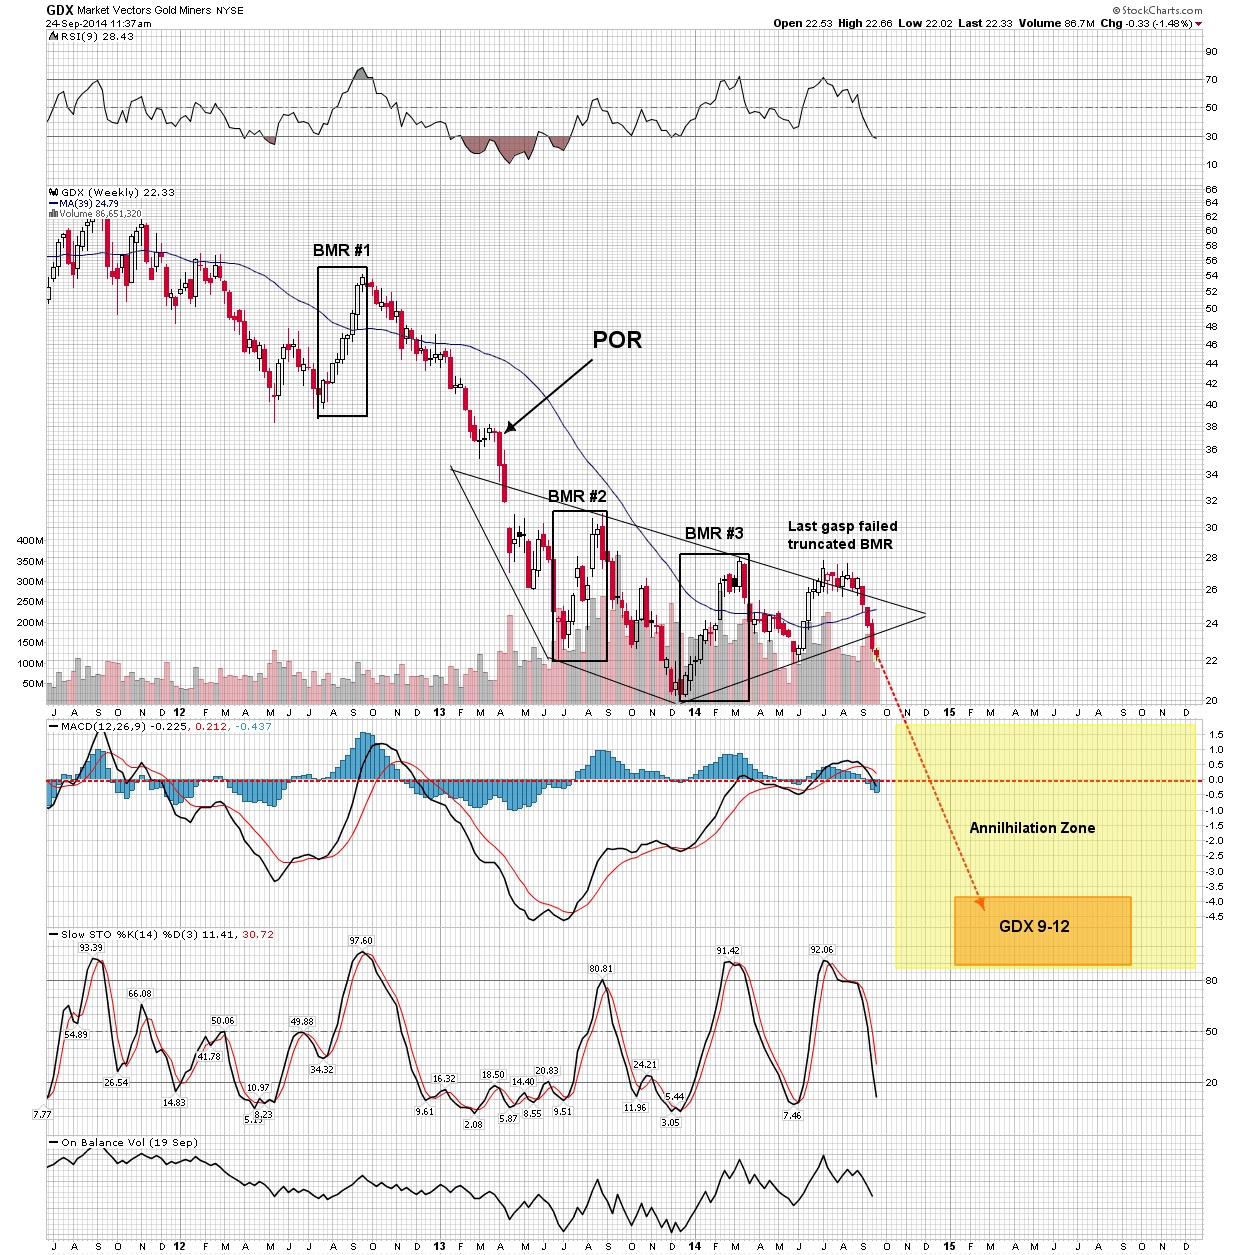
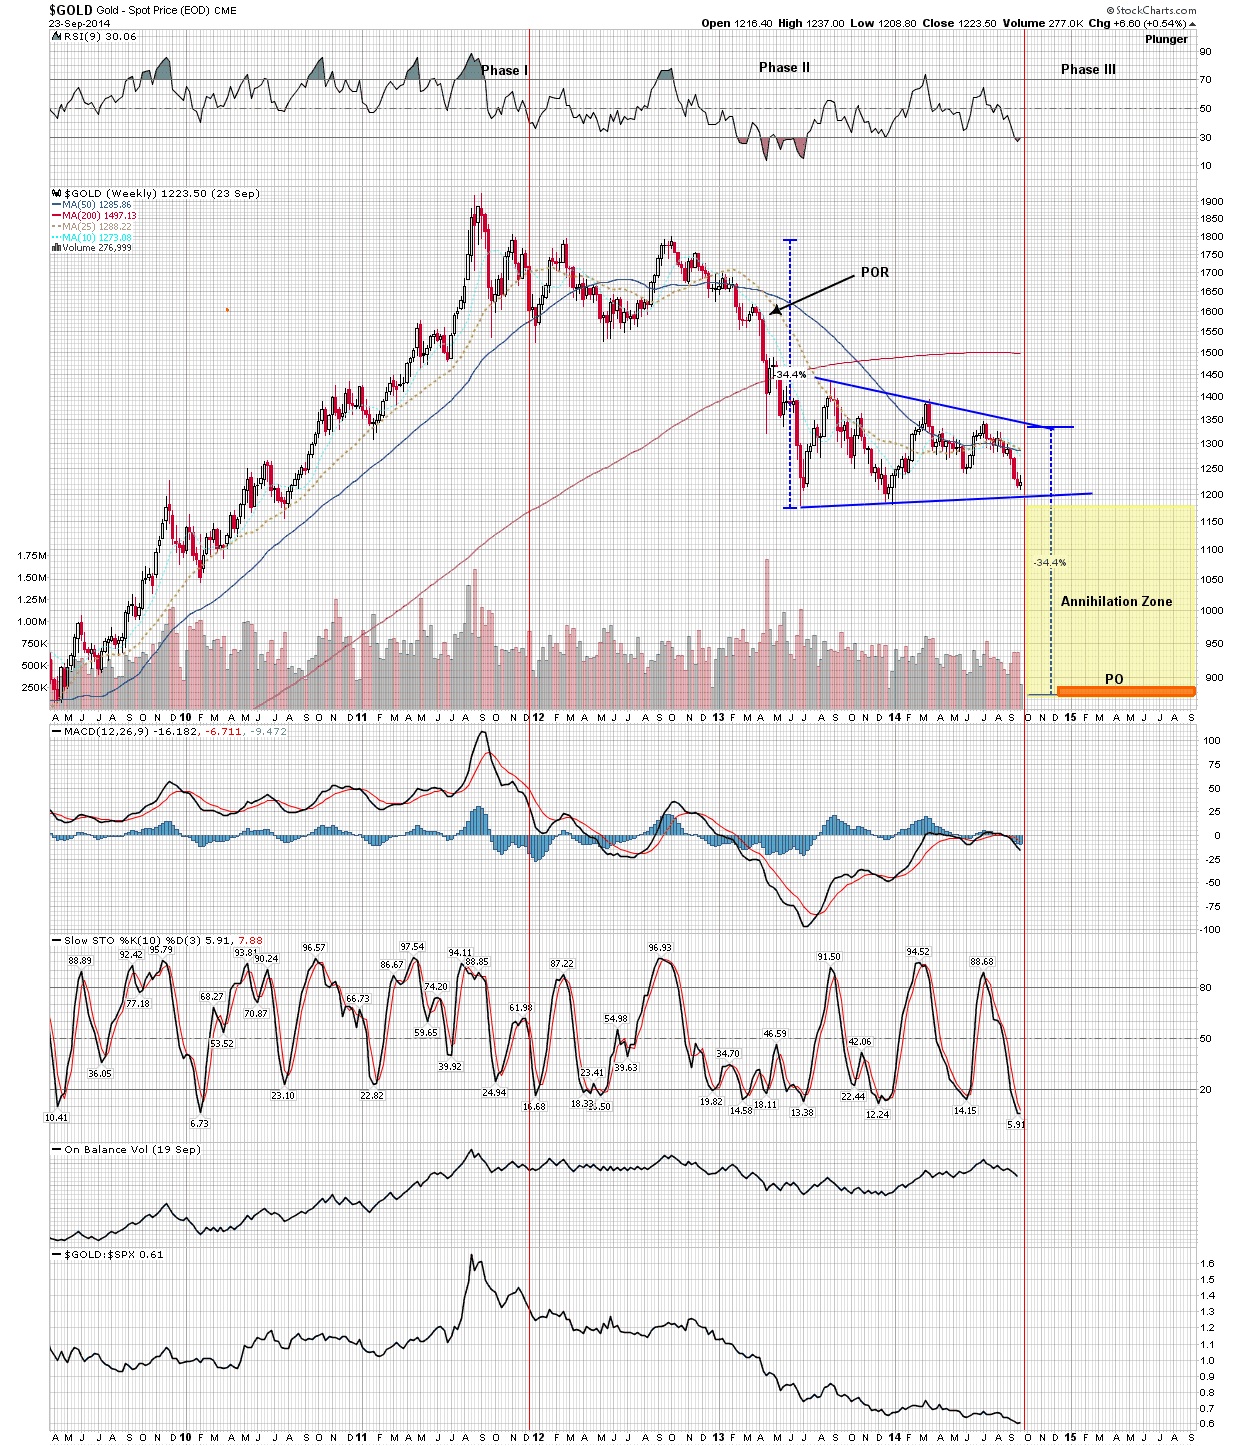
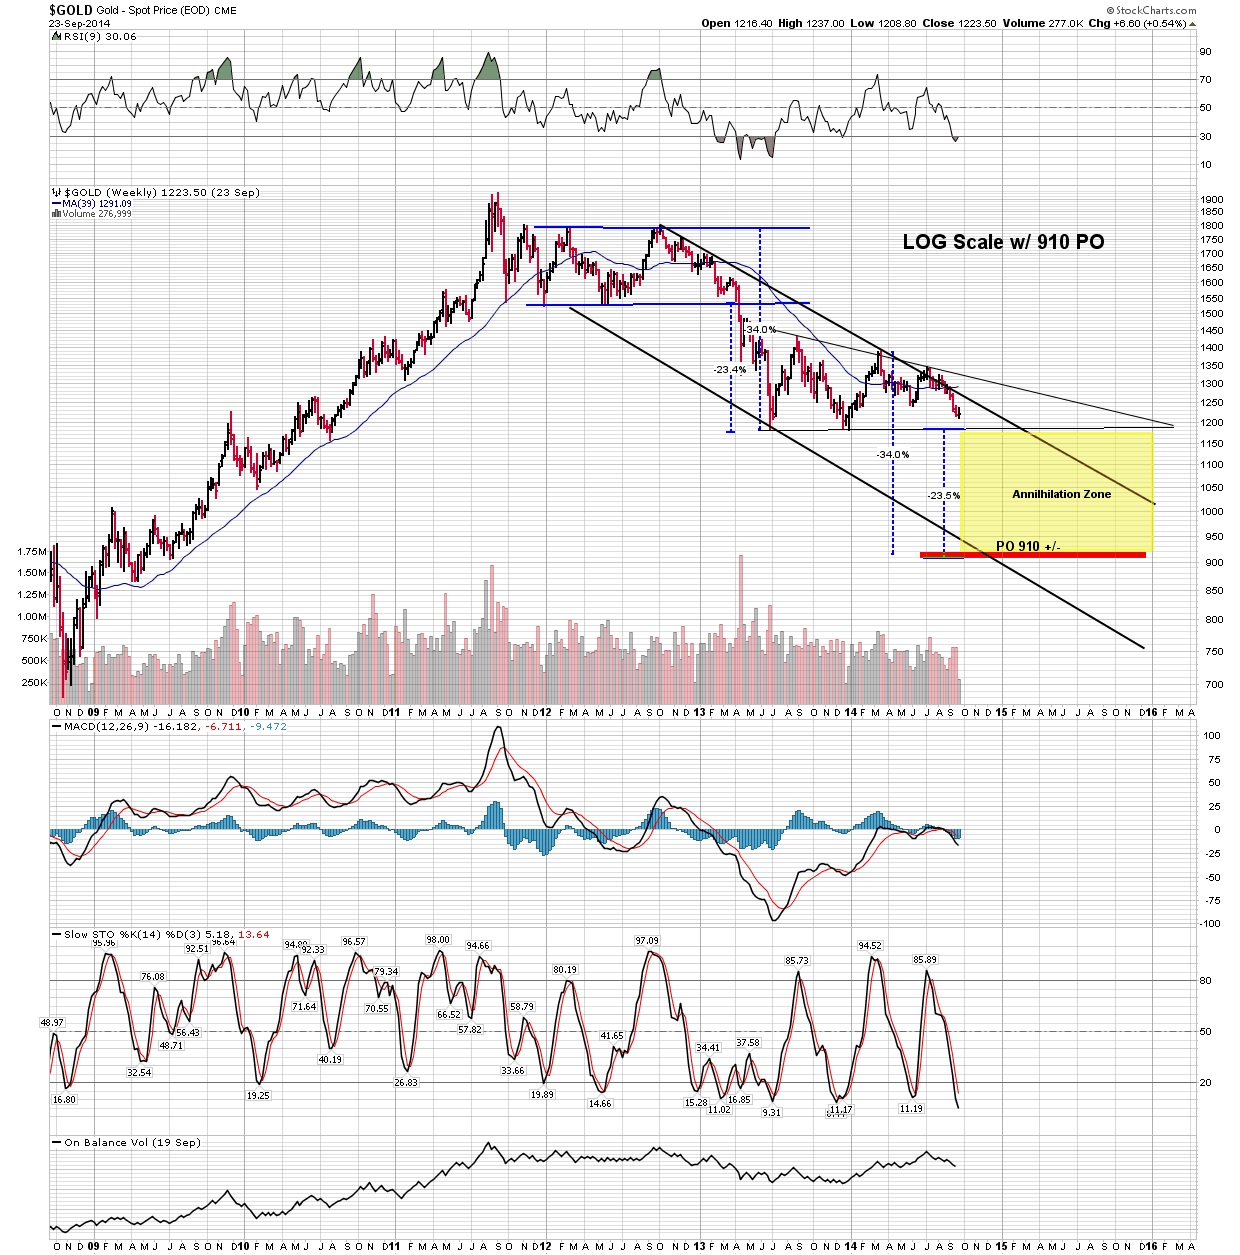
The current decline in precious metals will not be complete until it passes through all three phases of a bear market. This is the conclusion I have mapped out in previous essays. The PM bear market began in 2011 and declined steadily until the Goldman raid of April 2013. At that point the bear reached its point of recognition (POR) and underwent double crashes in April and June. After these two crashes the bear has been undergoing a complex consolidation pattern for the past 18 months. It appears that this consolidation is now complete and the bear is setting up for its final phase. This of course is the loathed phase III decline described in a previous post. In the 1930’s Robert Rhea described the three psychological phases of bull and bear markets. I have extended his work by using chartology to precisely assign price levels to these three phases. This is ground breaking work as it gives us a critical tool to assess where we are and what may remain in a bull or bear cycle. This tool identifies the critical flaw of the fervent gold bug who for three years has advocated “staying the course” which has resulted in lambs being led to slaughter. The previous essays can be reviewed here: Review Phases of a bear market and Phase III essays.
http://forum.rambus1.com/?p=37780
In order to navigate through a phase III decline and transition to the follow on bull market one needs a grasp of the macro forces that are driving this process. We will take a step back and attempt to get our head around what is really happening from the overall macro perspective. This requires a comprehensive review of the entire history of the currency regime in which we live. We are now in the end game of the USD life cycle and one must know the signposts in order to navigate and thus transition into the upcoming bull market in the PM’s. After laying out the dynamics of this process I will propose a strategy to position oneself through the upcoming market turbulence. One interesting finding is a suggestion of where to “hang out” while phase III devours the gold bug faithful and its not where you think! There are certain markers to watch for to identify the upcoming phases in both bear and bull, so let’s get started, but first here is a depiction of what may lie ahead before this bear is over:
click to enlarge charts
POR = Point of Recognition
BMR = Bear Market Rally
Bear Market Rally
This bear is not over & drivers of the next bull.
The problem with people is not with what they don’t know, but in what they know that just ain’t so…Will Rogers.
Here’s the standard gold bug narrative: Evil FED prints money… money supply expands…inflation results….gold goes up…smart people invest in gold stocks… they get rich! Sounds logical, but as Will Rogers would say…”it just ain’t so”. In fact gold has proven to be a lousy inflation hedge, just ask the gold bug who held his inflation hedge for 20 years starting from 1980. History shows a gold bull market is driven by other factors than inflation, so let’s take a look at them. Great gold bull markets historically come at the tail end of economic depressions. This is due to debt deleveraging and the effect it has on input costs into the gold production process. In a post bubble contraction deflationary forces lower mining costs in the form of cheaper labor, energy, explosives and equipment. Meanwhile the end product, gold becomes more valued. Since gold is pure money with no counter party risk, its value increases relative to other items of account with counter party risk. In a deflation items such as bonds and financial assets eventually become less desired due to insolvency issues while gold provides liquidity and therefore attracts capital and offers a safe store of value. As gold’s value rises and input costs decline the net effect is improved margins of gold producers and increased valuations of orebodies. This is reflected in higher stock prices of gold producers and results in a bull market. Currently we are entrenched in a gold bear market, however, once we complete Phase III of the bear the process described above will lay the foundation to the upcoming bull market in gold stocks. The transition to this bull may be confusing and will be met with plenty of skepticism, however in classic form well prepared, informed investors will accumulate major positions at stock prices below known values. That’s the definition of a phase I bull market. This phase may be short lived but the transition into phase II will build over time. Martin Armstrong has often said that what gold needs is broader public participation. This describes the character of phase II, an increase in awareness by the public that financial assets are no longer safe to hold and there will be a great move, over time, to seek out objects of permanent value, of which gold is the premiere asset in this category. Investors will initially be motivated by their concern over the solvency of the system and how this affects their own well-being. This is the classic move towards safety. Later on, as this concern develops into a full blown fear of a currency collapse, the bull market should move onto phase III which will be driven into a blow off and characterized as a mania.
In a nutshell, that’s the road ahead, but I need to fill in the detail and explain the macro dynamic that is driving this process. It’s important to comprehend the deflationary aspects of the debt cycle to understand that this is what will drive the upcoming bull market. This gold bull market will be the exclamation point to the end of this currency cycle. The gold bug narrative that money printing leads to gold bull markets is simply misinformed and it has cost its followers dearly in this path to Phase III. Annihilated gold bugs will soon be bludgeoned in the upcoming phase III. It’s really too bad since their hearts are in the right place, but they don’t understand the driving factors of this bear market.
The Nature of Debt
Debt is not inherently bad, but if misapplied it leads to a deflationary outcome. The key is in the income stream of the asset which the debt was used to purchase. If the resultant income stream cannot service both interest and principle repayment then the debt eventually subtracts from the overall demand of goods and services. As a result demand decreases and the economy contracts. Debt of course is the increase of current spending at the cost of future spending. Once debt reaches a certain level, future spending must decline. Eventually the future arrives and spending is reduced to service the debt. When debt is used for present day consumption, as opposed to investment to produce an income stream, future demand is reduced. Malinvestment works the same way, debt is used to built unneeded or inefficient projects in order to stimulate current spending, but in the long run causes deflation since the resultant income stream is less than the cost….think Solendra or just about any other government directed project.
The FED’s wrong prescription
Let’s be clear, we are in an economic depression, the first since the 1930’s. A depression is where cyclical growth remains below secular trend. In a depression growth does not have to be negative, in fact cycles of growth may occur as in the period from 1933-1937. A depression is caused by the lack of demand, Keynes got this right, however where he errored was in thinking demand could be replaced by synthetic credit rather than accumulated savings. When debt becomes elevated it robs the economy of demand and causes a contraction. Therefore the FED is applying the wrong prescription by trying to solve an indebtedness problem by increasing leverage. Currently the major economies of the world have excessive Debt/GDP ratios: USA-346% Europe 450% Japan 650%
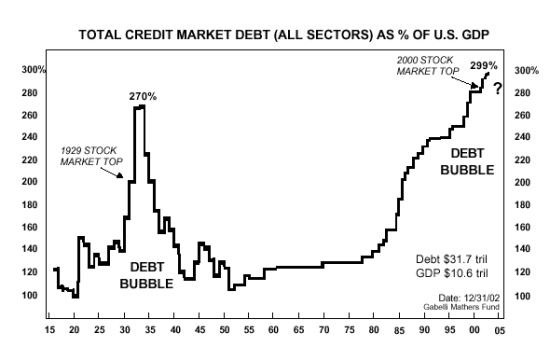
Debt Deleveraging-the historical solution
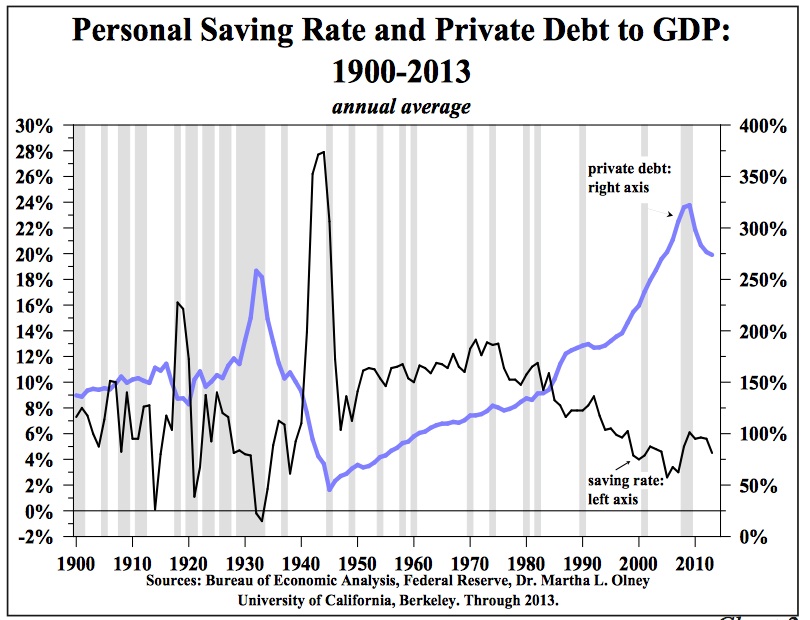
These two charts below show the interplay between personal savings rates and private debt and their role in causing and curing a depression. Note how savings steadily declined in the 1920’s while debt trended higher. The prescription to get out of the depression took nearly 20 years (1929-late 40’s). That prescription was to delever personal balance sheets, increase savings and pay down debt. Note government spending during WWII did not get us out of the depression it was the increased savings caused by the war which fueled post war demand.
It is interesting to note how dismally low our personal savings are today, in fact it has actually turned back down. One can see by this chart that the US economy has a long way to go to set the stage for a real organic sustainable recovery. Instead, the FEDs prescription of borrowing money and spending it gives a short term boost, but makes the economy weaker. The cure that works is high savings and debt pay down. Historically this process of deleveraging takes about 20 years.

The Life cycle of the currency 1933-2020?
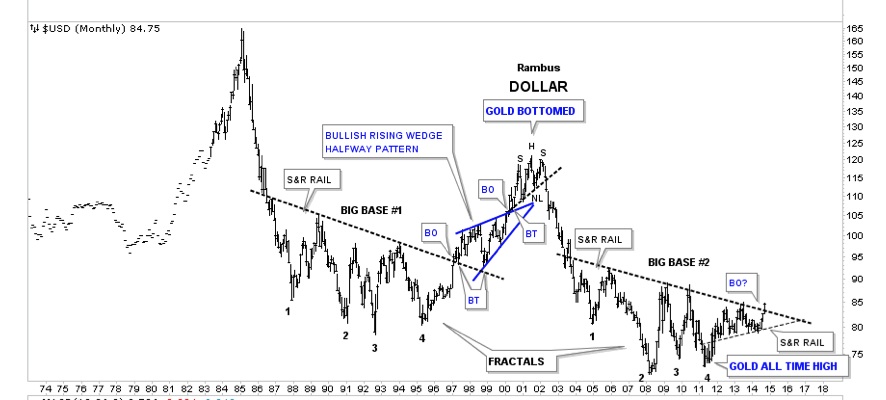
Prior to 1933 the currency was gold backed and inflation was experienced during economic expansions and deflation occurred during contractions. After 1933 this changed as we simply got inflation all the time, just in varying degrees. From 2008 to present we have been in a transition period into something we have not witnessed in 75 years. Inflationary finance is ending and the bottoming of the USD is an indication of this. This is driven by a maturing debt cycle and the current rise and breakout of the USD signals the triumph of deflation.
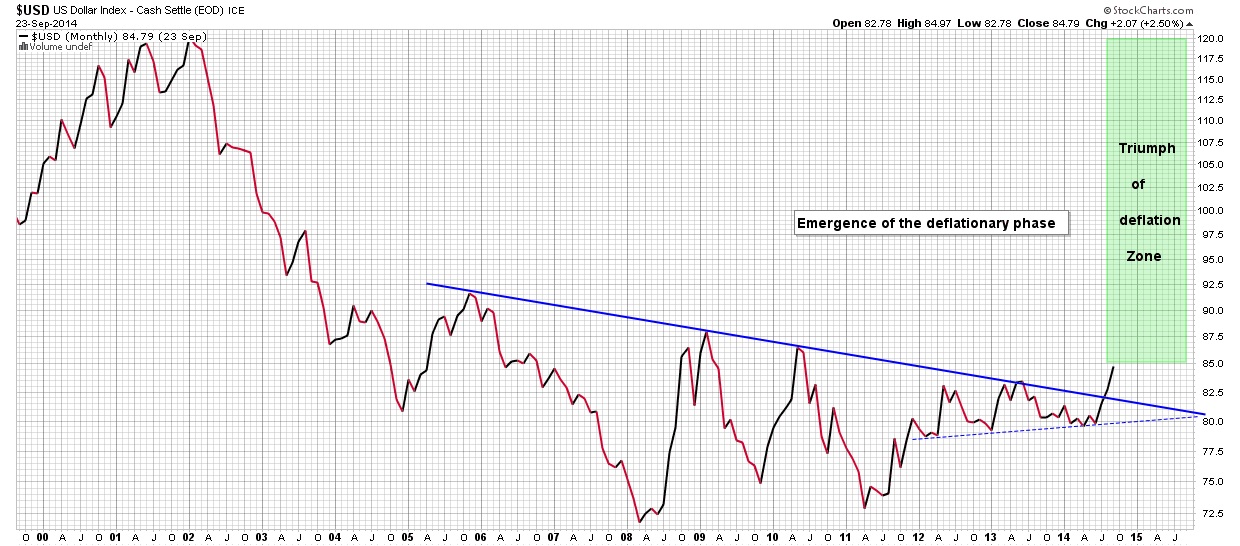
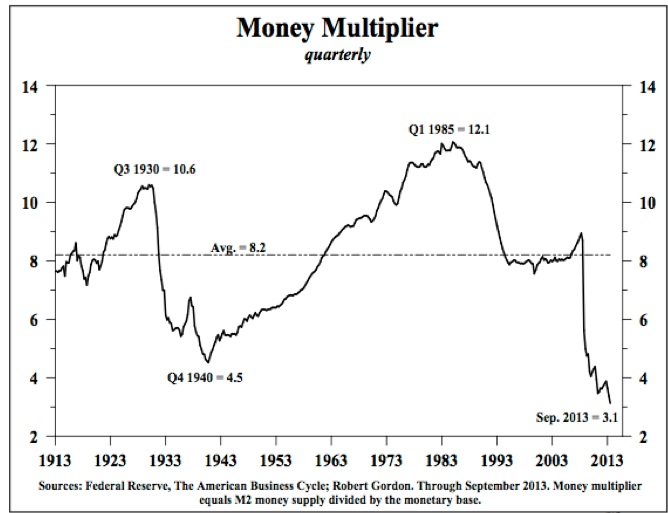
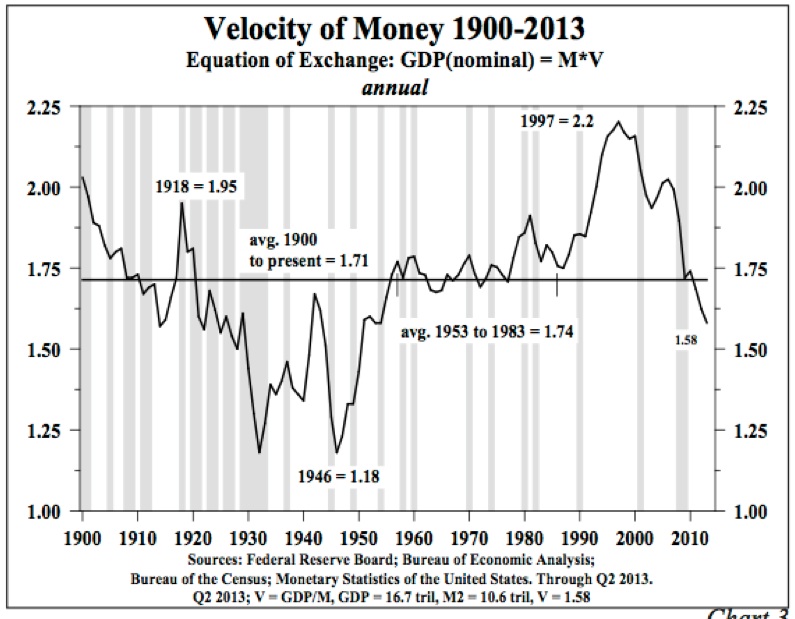
The decline of the velocity of money and the money multiplier is consistent with this deflationary dynamic and the rise of the USD. Deflation is precisely what the FED has been battling with its zero interest rate policy (ZIRP), however this build-up of debt and leverage actually insures a deflationary outcome due to debt dynamics. Today’s increasing debt levels and downward economic grind is all a prelude to reaching the Bang Point.
The Bang Point
The end of the line of a zero interest rate policy is the Bang point. This is where debts can no longer be rolled over because income streams are insufficient to pay off debts and service interest. When debt levels get too high the math no longer works. The market loses confidence and chaotic conditions prevail. When this point arrives it will provide the fuel for Phase II in the upcoming bull market in gold. The Bang Point will most likely be experienced in Japan first due to that country’s deteriorating demographics and elevated debt levels. It is not clear the timing of the Bang point , but once the conditions arrive it occurs quickly.
Austrian Economics- explaining the driving forces for Phase III and the next gold bull.
Soon a deflationary headwind will power the final phase in today’s metals bear market. Debt dynamics will be the force behind both the decline and the upcoming bull market. With the Macro explanation now behind us we can move onto the markers along the path of the upcoming phases. In part 2 we will outline Phase III -apocalypse now, including some anecdotal stories and an update on the step sum indicator plus review some time lines. We then will move on to the transition into the upcoming bull market in PM shares.
********
To Contact the Author
Plunger c/o
[email protected]


