Preparing For A Move…Up Or Down?


The Merv’s FAN Principle is working as expected as mentioned in my last post (17 Feb 2017). Gold seems set for another thrust However, the only difficulty is in guessing which way that thrust will go. I guess we’ll just have to go through the analysis to get a better feel for the direction.
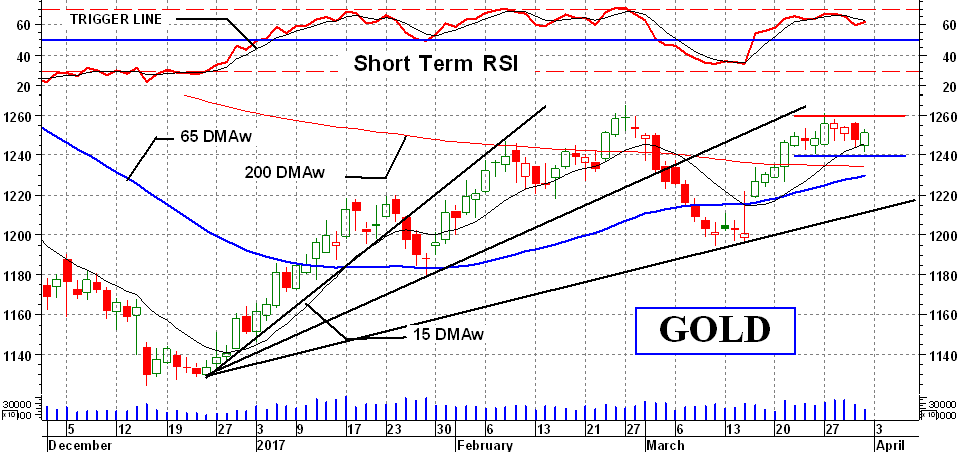
So far, so good. This is (so far) almost a perfect example of my FAN Principle at work. We have our three FANs well defined and the gold price action trapped within that 2nd and 3rd FAN trend line space. The action should remain trapped inside this space until it breaks through, either above the 2nd FAN line or below the 3rd FAN trend line. As mentioned in my occasional very brief comments on my Facebook page, I do not expect the action will break above the 2nd line but will eventually move below the 3rd line. Prior to breaking one way or the other, one can expect the action to remain within the lines and may at times ride up the lines without breaking through. Should gold break below that 3rd FAN line, the question would be how low would it go? The pattern is not a projection pattern, but it would not be unusual for the price to go back to the FAN apex point, at about the $1125 mark.
There are two other important potential features in this chart.
First, we have a very short-term “box” pattern as shown by the resistance (red) and support (blue) lines developed over the past few days. As readers may recall my mentioning in the past Nicholas Darvas use of this pattern to amaze his millions back in the 1960’s. The pattern does not tell us which way the action will break, only that once broken the direction is set for some length of time. This being a short-term pattern, one would not expect the action to continue for too long of a time. I expect the break to be on the down side with the resulting action still staying above the 3rd FAN trend line. BUT I wouldn’t jump the gun and act until the action tells me the direction.
Secondly, there is a potential head and shoulder (H&S) pattern with an exaggerated right shoulder. A full H&S would require a break below its neckline (not shown), which would be around the $1200 mark. I have my own criteria for determining a H&S pattern - and one criteria is that the distance from the neckline (directly below the head) up to the head should be less than or equal to one half of the distance from the start of the pattern to the top of the head. In this case it misses the criteria by just a miniscule amount, not enough to disregard the pattern, but still not quite up to the criteria. We shall see how this develops.
LONG-TERM
Gold closed on Friday just above my long term moving average line although the line is still pointing in a downward direction. I use the weighted moving average method. Using the more common simple moving average, gold is still trading below that moving average line. So, I guess we just flip a coin to see which we go with. As far as its momentum is concerned, the long term momentum is just above its neutral line by a hair. Not enough to go gung ho about. I will rate the long term indicators as NEUTRAL at this time until they give me a more confirming message.
INTERMEDIATE-TERM
Gold closed Friday above its positive sloping intermediate-term moving average line. The momentum indicator is also in its positive zone sitting right on top of its trigger line. The momentum, however, is not acting all that positive. Consequently, we’ll have to keep an eye on its future action. For now the intermediate-term is rated as BULLISH. To be sure the future will depend upon what the short-term does. A positive note is that the short-term moving average line remains well above the intermediate-term line.
SHORT-TERM
As we see on the chart gold closed above its positive sloping short-term moving average line and the momentum indicator is in its positive zone, although showing some weakness remaining below its negative trigger line. For now the short-term rating is BULLISH, which could change very fast should gold drop below that “box” support at the $1240 level.
Merv’s Gold & Silver 100 Index
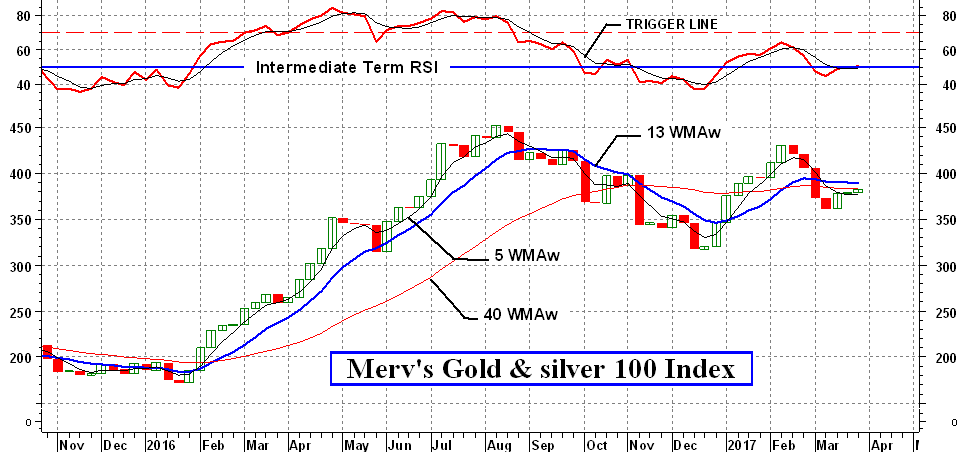
Speculators, those with sufficient capital to move prices, are not all that enthused with gold and silver stocks. The various gold Indices are underperforming that of the gold price in recent market action. This includes the normal North American Indices as well as Merv’s 100.
While gold is butting up against its high from late February, gold shares remain just about where they were at the low point of early March. This suggests weakness in gold shares with the high potential of further weakness ahead. This might also reflect upon where gold price itself will trend in the near future.
The Merv’s Gold & Silver 100 Index which includes the top 100 gold and silver stocks trading on the North American markets, based upon market value at the last review, closed the week up by only 0.6%. There were 49 stocks closing on the up side and 48 stocks on the down side for almost an even 50/50 split. The other 3 stocks closed with no change from the previous week.
LONG-TERM
The long-term indicators are a mixed bag here. The Index is just touching its negatively sloping moving average line. The long-term momentum indicator is in its positive zone just above a neutral sloping trigger line. I would have to rate the long-term as BEARISH…but this could change quickly.
As far as the overall long-term BULL/BEAR performance rating of these 100 stocks are concerned, 35 are still rated as bullish, while 51 are rated as bearish. The neutral rating applies to the rest. A slight bearish overall rating.
INTERMEDIATE-TERM
The Index closed the week below its negatively sloping moving average line. The momentum indicator closed just below its neutral line very slightly above its positive trigger line. I would rate the intermediate-term as still BEARISH but not strongly so.
As for the BULL/BEAR ratings of the overall Index components, 29 were rated as bullish, 63 as bearish and 8 as neutral. A bearish overall performance rating for these stocks as far as the intermediate-term was concerned.
Confirming this bearish rating is the fact that the shorter term moving average line remains below its intermediate term line.
SHORTER-TERM
As previously mentioned, using weekly charts and indicators is not conducive to performing short-term analysis. I’ve used a time period that is in between the daily designated short and intermediate-term periods.
At the Friday close the Index closed just above its positive sloping shorter term moving average line. The shorter term momentum indicator is still in its negative zone but above its positive sloping trigger line. All in all I would give the shorter term a rating of BULLISH.
As for the overall BULL/BEAR ratings of the individual stocks, 46 were bullish while 37 were bearish with 17 neutral. This is neither a bullish rating nor a bearish one but closer to bullish overall.
Readers are invited to view my Facebook page at https://facebook.com/merv.burak where I will probably post from time to time a brief sentence or paragraph on the markets (gold, energy, technology and markets in general). However, nothing I post is meant to be a recommendation to buy or sell. One should check with their broker or investment advisor before acting.
 Merv is a retired Aerospace Engineering consultant. He is also a retired market technician with over 40 years of market experience and research. Merv received his certification as a Chartered Market Technician (CMT) in 1992. Developer of many technical techniques and programs which he has been using in his previous Technically Speaking with Wil-Arm and Technically Precious with Merv commentaries posted throughout the globe. Developer of several gold and silver Indices, Merv continues to update his Merv’s Gold & Silver 100 Index and Merv’s Penny Arcade 50 Index and reviews them during his periodic on-going Technically Precious commentaries.


