Pretending That Everything Is Just Fine


Market Update
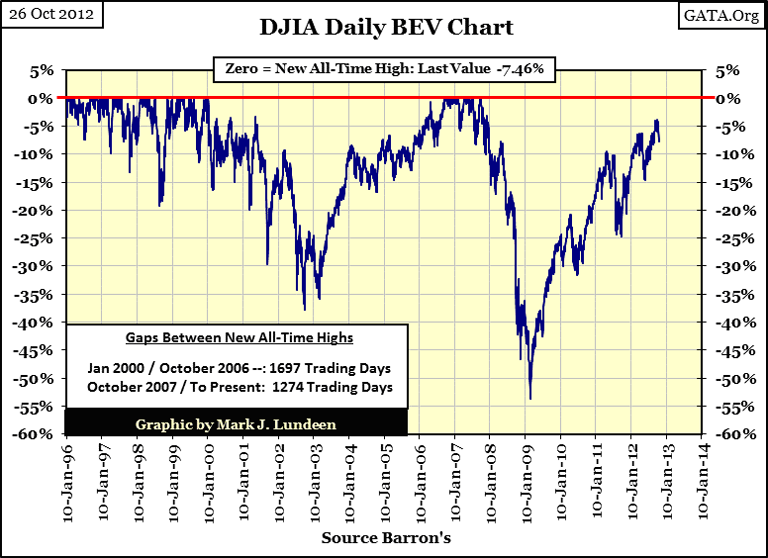
With less than two weeks from election-day, the Dow Jones is going the wrong way! Not by much, it was down by only 1.43 BEV points from last week, but with only seven trading days left until the election, you'd think the guys would make a bigger effort getting the Dow Jones to make a new all-time high. Remember, it was President Obama who was in office when the credit crisis saw its bottom in 2009, and when news of a few trillion in fraudulent derivative contracts came into the money that left the big banks bankrupted. You'd think that Obama would have enjoyed the news. Instead, the former socialist-community organizer, who claims he hates the billionaire "Fat Cats" on Wall Street, had America's impoverished proletariat pick up the bill to bail-out Wall Street, and then he refused to have his Justice Department investigate the rampant fraud that caused the market crash in the first place.
And how does Wall Street repay the best friend Wall Street ever had? They're letting the Dow Jones go the wrong way just days before election-day. But don't cry for the Obama's. In the next few years, his good friends from Lower Manhattan will make sure that Obama will become the wealthiest "community organizer" in American history. He and Michelle will soon be able to afford a carbon-footprint the size of a herd of elephants, and with the kind of money they'll soon see, they'll never have to travel first-class air ever again; as flying a chartered flight, or having their own Gulf Stream is how important people travel.
But we already know that; what we don't know is if the Dow Jones will make a new all-time high anytime in the near future. I expect the Dow Jones will crash below its BEV -70% line (BEV chart above), before it sees its next BEV Zero. But I've been wrong before, so I can't rule out a new all-time high before this Dow Jones bear-market makes a serious attempt at becoming the #1 bear market since 1885.
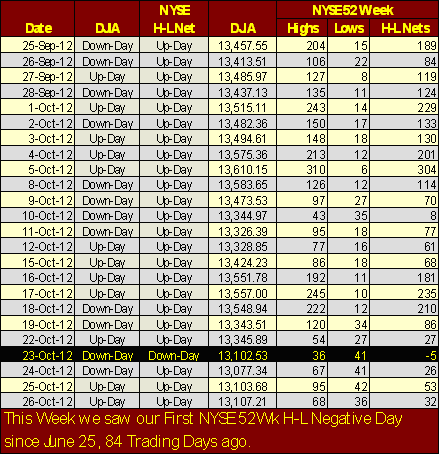
Well, what do we see below? After eighty four trading days, the NYSE 52Wk High Low data saw its first negative day since June 25. It was only down a net -5 on Oct 23, but it's a start. This may mark the beginning of another down cycle in 52Wk lows at the NYSE.
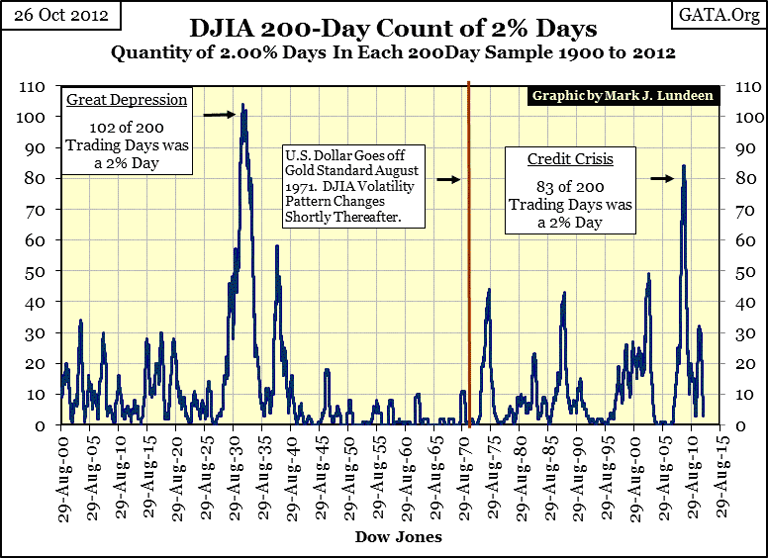
However, we may not see new 52Wk lows overwhelm 52Wk highs for a few months from now, or ever if we don't see a pickup in "Days of Extreme Volatility" in the Dow Jones. A day of extreme volatility is a day where the Dow Jones rises or declines 2% or more from its previous day's closing price. The last one we've see occurred was on June 29. In the chart below, the plot lists the number of 2% days for the Dow Jones in a 200 Day Moving Sample. Our current 200 day sample spans from last January 13 to today, and there is now only three days of extreme volatility in the sample. When Mr. Bear returns to work cleaning up Wall Street, we'll see this plot rising up again. The last time his pickup truck was seen in front of the NYSE, we saw 83, Dow Jones 2% days in a 200 day sample. That was only nineteen short of what we saw at the bottom in July 1932! Until the Dow Jones once again sees wild daily volatility, I don't expect much excitement (good or bad) coming from Wall Street.
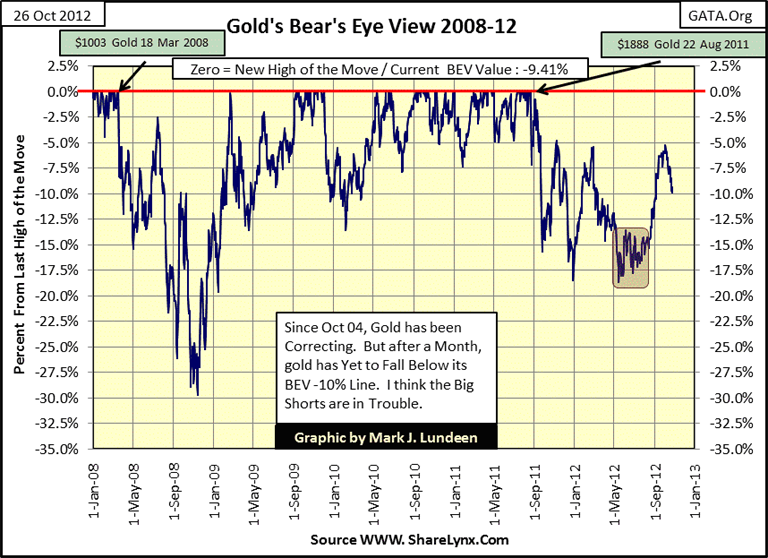
Let's move on to the gold market. As we see in gold's BEV chart below, gold has declined from BEV -5.44% on October 04, to BEV -9.41% at today's close. So after seventeen trading sessions in the gold market, the big Wall Street shorts have only 3.97 BEV points to show for all their hard work. Like Wall Street's failure to deliver a new Dow Jones all-time high for Obama, their lack of success in forcing the gold market into a selling panic is not a very impressive performance for our former "Masters-of-the Universe." I think they are in trouble.
Moving on to gold's step sum chart, where there is nothing exciting going on, we see gold's price and step sum in agreement that gold is going down.
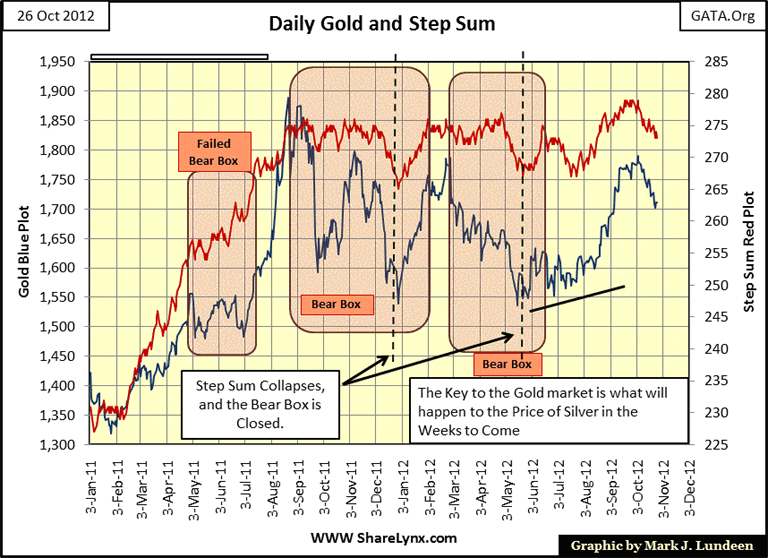
However, since October 4th, gold has closed lower on eleven of seventeen trading sessions at the COMEX. Another way to look at this is to realize that even though there have been only been six up days for gold since Oct 4th, the gold bulls haven't panicked as they routinely have since 2001 whenever Wall Street bushwhacked the longs. As noted above, gold has lost only 3.97 BEV points since October 4th, and that's not much! What is going to happen? I still expect the key to the short-term future of gold is best determined by what is happening in the silver market.
Like gold, silver's BEV chart is very encouraging. Since Sept 13, silver is only down 5.68 BEV points - simply amazing! And we should also note that if the big silver shorts can't manage to drive silver's price below its BEV -45% line ($26.66), they are stuck with a huge reverse head & shoulders technical formation with a very bullish rising neck line for all the world to see. For over a decade, trading gold and silver on technical patterns has been a mug's game. Should this reverse head & shoulder pattern resolve to the upside, it's a huge sign that the price of silver, and gold are breaking free of the "policy makers" strangle hold. But as always, we will have to wait and see what actually happens.
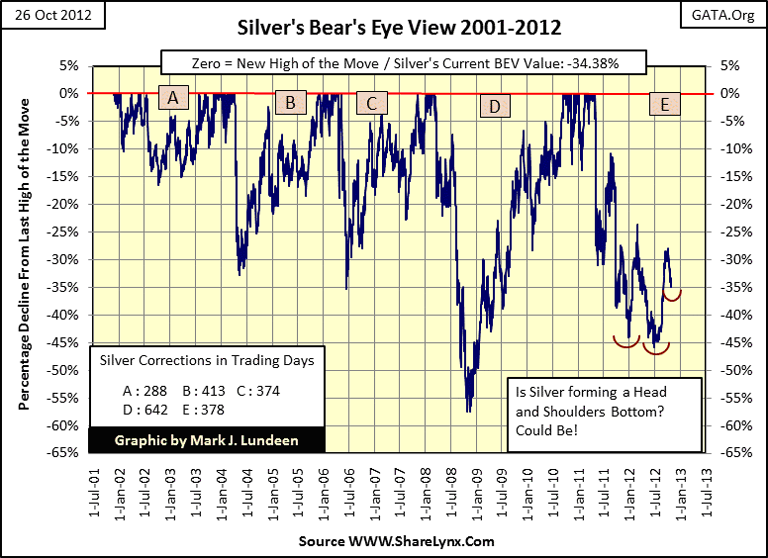
I, for one, believe this reverse H&S pattern in the Silver's BEV chart will work out to the bulls' favor. Since Obama was sworn into office in 2009, our Congress has never passed a budget; not that having a budget has been a big deal for Washington ever since Kennedy was president. But, being so obvious about it is symptomatic of the growing chaos in the management of Washington, and our country's finances. What is going to happen in the next few months when Washington has to yet again pass a bill to raise their debt limit? Whether they do raise the debt limit, or not, I expect that whatever Washington does will be bad for stocks and bonds, and good for gold, silver and the precious metals' mining stocks.
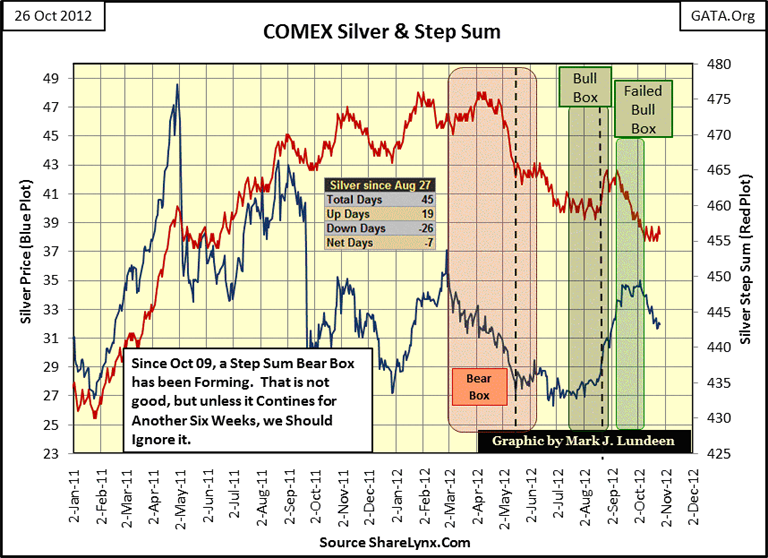
Silver is beginning to form a bear box; which is not good! See how the step sum's trend has turned sideways as the price trend for silver continues to decline? But this has only gone on for the past two weeks. In Step Sum Analysis, the price trend is market reality, while the step sum trend is the market's expectation. Usually the two trends agree with each other, as with gold's step sum above. But when the two trends go different ways, usually it's the price trend that will prove to be profitable. Personally, until a step-sum box has continued for about two months, or more, I don't take them seriously. But it's a chaotic market that sees a bull-box fail one day, only to see the beginning of a bear-box the next! Geez Louise, the silver bulls and bears are really slugging it out in the mud, the blood and the beer inside the COMEX just a few days before the election.
Pretending that Everything is Just Fine
The scary thing for me when I watch, or read something in the financial Media is how clueless the "experts" appear to be when "informing" the general public on this, that and the other thing concerning the economy and markets. To wit:
The author, CNBC Senior Editor John Carney, asserts that it doesn't matter whether Germany's gold exists -- provided that everyone just pretends and acts as if it exists: "As long as the Fed says it is there, it is as good as there for all practical purposes to which it might be put. It can be sold, leased out, used as collateral, employed to extinguish liabilities, and counted as bank capital just the same whether it exists or not."
Can John Carney be serious, or is he really as misguided as he sounds? Central banks have been leasing their gold reserves for almost two decades, and most likely have already written one hundred ounces in derivatives for each ounce in their gold receivables for just as long. There has been plenty of evidence that the West's central bank vaults contain as much Tom Foolery (tungsten and fraudulent accounting) as gold bullion since Long Term Capital Management (LTCM) cratered in 1998, and Gordon Brown sold half of the UKs' gold in 1999. A paradigm shift occurred in 2009 when the world's central banks became net buyers and ceased to be net sellers of gold bullion, even though the 1999 & 2004 Washington Agreements regulating the orderly sale of official gold is still in effect.
Reread the quote above; Mr. Carney is clearly aware of the "rumors" circulating of malfeasance involving official sector gold, yet he has done no investigation for well over a decade. If you are unaware of these "rumors", it's because "financial journalists" like John Carney have refused to hold central bankers and government officials responsible for betraying the public's trust. Instead, financial journalism for decades has turned a blind eye to this, and many other financial scandals involving Wall Street and Washington. If we have finally descended to the point where the structural integrity of the global financial system depends on everyone "pretending", we are in big trouble!
However, most "experts" aren't actually clueless; in fact, they know a lot more than they tell us. It's just that they have a poor opinion of the general public's intelligence for the good reason that they keep coming back to be fed more disinformation by the media.
The politically sensitive jobs data is but one example of what I'm pointing out, as the way they report it is meaningless; reporting the latest figure with scant historical reference. This is intentional, as the main-stream media are members with good standing in the establishment. In the past decade, Washington's central planners have done a horrible job keeping America's middle class employed, but that isn't news today. Apparently, the media sees its contribution to society in keeping the public totally unaware of the extent Washington has damaged the private sector ability to create jobs, and more recently failing to report on the damage to local governments' property tax base which was devastated by Washington's mortgage bubble.
So instead of repeating this month's employment figure, let's look at plots for private and government payroll numbers as recorded in the dusty old pages of Barron's going back twenty years. These plots are information that somehow is never shown to the general public by the media; and for good reason - the media serves the establishment, not the public.
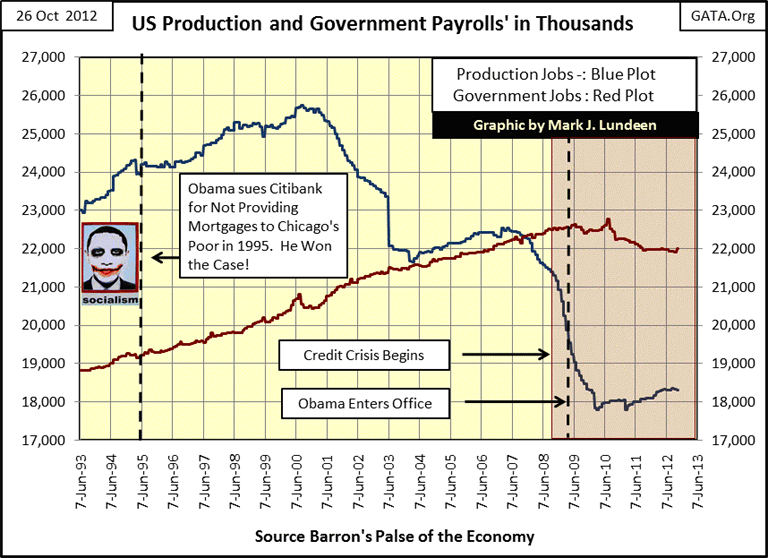
The blue plot is for private sector jobs, the red is for government jobs. The chart is self-explanatory, except to note that in the aftermath of both the high-tech and mortgage bubbles, four-million jobs ceased to exist, or eight-million total private sector jobs were lost in the past twelve years as a result of "economic stimulation" by the Federal Reserve. Yet to this day, our apparently clueless media and Congress hold fast to their optimistic views that Doctor Bernanke will create jobs via with his quantitative easing program. Can you look at the chart above and convince yourself that these idiots will achieve a different result this time using the same failed tactics?
Never noted in the media is Obama's role in the mortgage bubble. The Chicago Sun Times noted Obama's 1995 victory in suing Citibank to force it to provide mortgages to inner-city residents. I don't have the link from the original Sun Times article; this link sites that article, and gives a summation of Obama's role in the mortgage crisis in the city of Chicago. The willingness of the press to overlook the part their favorite "community organizer" played in the mortgage crisis when he now condemns these same banks for a crisis he helped to create is disgusting. Why isn't it reasonable for us to point out President Obama's contribution to the loss in jobs from the mortgage bubble? Anyway you look at it, Obama's life's work before and during his White House years has done more harm than good for America's workers.
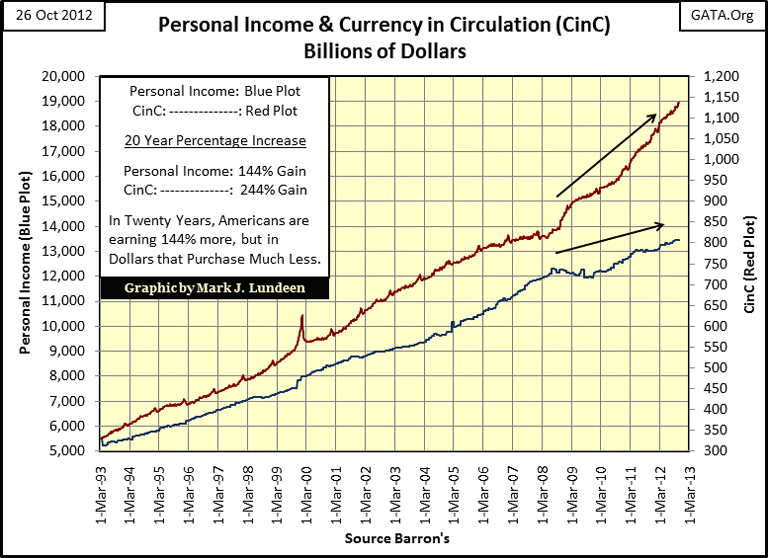
But even for people who have remained continuously employed for the past twenty years, they too have suffered at the hands of the hack politicians, greedy bankers, and quack economists who created the Federal Reserve ninety-nine years ago, and continue to defend the Fed's role of setting, and executing "policy". Let's look at the growth in currency in circulation (CinC Red Plot/Left Scale, the number of paper dollars and base-metal coins in circulation), and compare the growth of CinC to the growth in personal income (Blue Plot/ Right Scale) since 1993. As evident in the chart below, personal income may have increased by 144% over the last two decades, but CinC has risen by 244%. People may be receiving more than twice the number of dollars in wages, but their paycheck could actually purchasemore in 1993 than today.
In Ron Chernow's book "the Warburgs" (Paul Warburg is considered the father of the Federal Reserve) Mr. Chernow noted that when the Income Tax was first implemented in 1913, one had to make $3,000 a year to enter the bottom income tax bracket, because only wealthy people made $3,000, or more a year. Today, $3,000 a year places someone in dire poverty.
The continual increases in CinC have had two deleterious effects that will eventually destroy the middle class:
- Increasing consumer prices (the dollar continues to purchase less)
- Decreasing disposable income (paychecks continues to purchase less as more and more income goes towards servicing debt created by the Federal Reserve System)
As these trends continue, the impoverishment of the middle class will be characterized by ever rising income.
Below, I took the personal income data above (Red Plot Below), and consumer debt (Blue Plot), and indexed them to 1.00 = March 1993. This allows us to observe these data sets as in a horse race. I've already noted above that personal income has fallen behind increases in CinC. Below we see how the middle class is filling this gap in their consuming power; they are falling deeper into debt. Just last week, I saw a CNBC "economist" declare the rising levels in consumer debt (Blue Plot Below) are a positive sign of "our economic recovery." These people are not your friends. To them, we are only a "human resource" to be exploited.
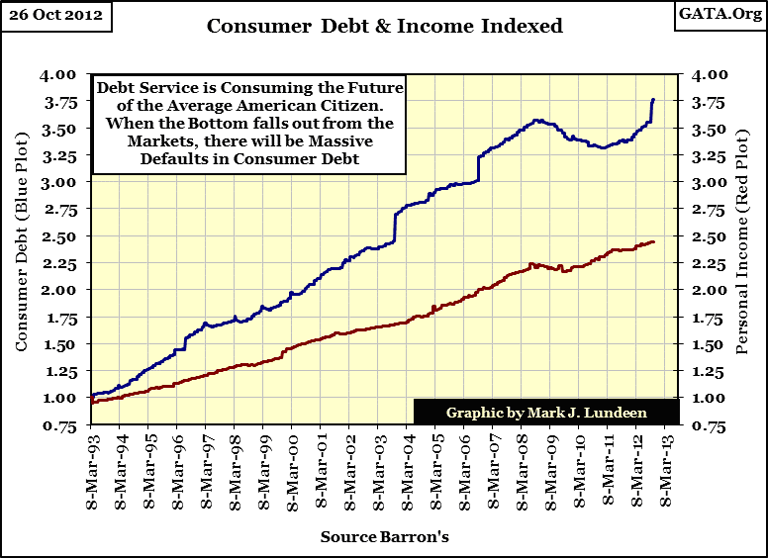
In the current "economic model", increases in debt levels are an essential component in a "healthy economy", and the only cure Doctor Bernanke knows for any economic crisis. A year after the top in the High-Tech bubble, American consumers were given this pearl of advice by Robert McTeer, of the Dallas Fed.
"My term for what happened to the economy as we were gliding in for the proverbial soft landing is that we hit an air pocket. Fortunately, we were flying high enough so that the sudden decline in growth didn't cause us to crash-land. If we all join hands and go buy a new SUV, everything will be all right. Preferably a Navigator." -- Robert McTeer, President Dallas Federal Reserve Bank: Remarks before the Richardson, Texas, Chamber of Commerce, 02 Feb 2001
As evidenced by the chart above, many Americans took this advice, and continued to increase their consumption by assuming more and more debt. Today, there are just too many people over 60 with hundreds of thousands of dollars of debt and only a few thousands of dollars in assets. This is no surprise, since 2001 CNBC also hosted an endless train of "investment experts" who urged "consumers" to make an investment in their future in the mortgage market. They still do. Should we be surprised that eleven years later, CNBC's Senior Editor John Carney is now urging us to "pretend" that the banking system (American and European) that has purchased the best government money could buy, would respect the national gold reserves of any country under their thumb? Prudent people should question the legitimacy of any gold bullion reserve estimate that hasn't been assayed, audited and not held in one's possession, sovereign nation or ETF managed by a Wall Street bank, trading on the NYSE.
But really, how bad is it? I believe we are within sight of the termination point of a historic inflationary cycle that will be remembered for many hundreds of years to come.
Let's look at the Fed Funds Rate to the US Treasury Long Bond Yield credit spread from 1954-2012. The plot shows how many percentage points the Fed Fund's Rate has risen above, or declined below the yield in the US Treasury's long bond for the past fifty four years.
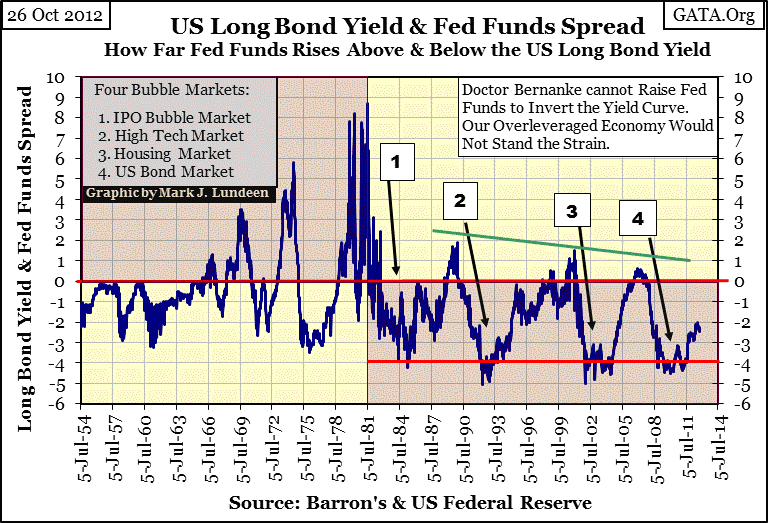
When the plot is positive, the Federal Reserve is stepping on the monetary brake pedal, creating a "tight money policy" which forces banks to contract credit, forcing weak creditors to liquidate unviable debts in the process. This checks "inflationary excesses" in the economy. When the Fed Funds Rate is below the US T-bond yield (the plot is negative), the Fed is "injecting liquidity" into the economy to promote "growth" in the economy.
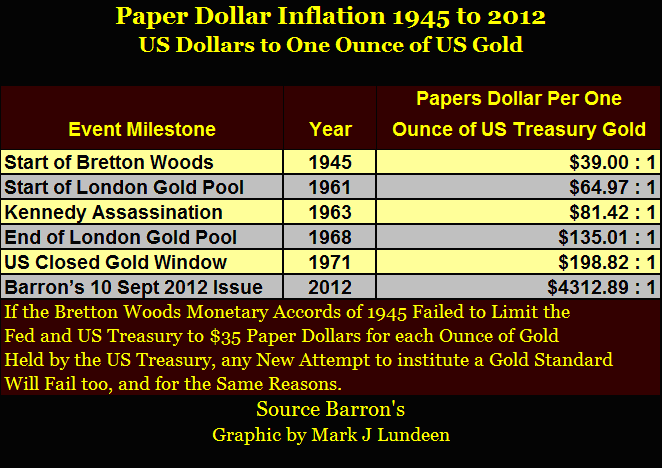
Remember that 1954 was only nine years after the Bretton Woods Monetary Accords were ratified, and became the law of the land. But Washington never took Bretton's Woods' $35 paper dollars for each ounce of US Treasury Gold seriously, as adhering to the $35 gold peg made "monetary injections" by the Federal Reserve impossible. And with no "injections" into the banking system, the Dow Jones would have never have risen to over 14,000 in 2007 (the Dow Jones was less than 300 in January 1954), and trillions of dollars in consumer and school loans would have also been impossible. Bretton Woods' gold peg was designed to make life as we now know it, and now fear it, impossible.
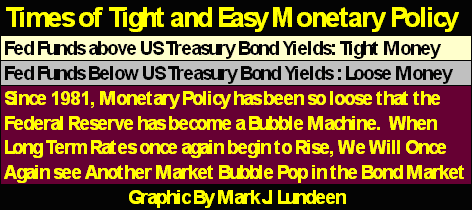
I shaded two areas in the chart above:
- 1954-1981: (27 Years When "Inflationary-Monetary Policy" was Dominated by caution at the Federal Reserve)
- 1981-2012: (31 Years When Fearless Morons Dictated Global Monetary Policy, Inflating one Financial Bubble after another with Easy Money)
In the first shaded area (1954-81), the US Government, and their creature, the Federal Reserve, ignored the law by issuing more paper dollars than the US gold reserves allowed by law (see table below).
But like little kids afraid of being caught in the act, the Fed attempted to hide their inflationary actions with frequent periods of tight monetary policy (high positive values in the chart above).
Now look at the second shaded area for 1981 to 2012 where the Federal Reserve never raised their Fed Funds rate even 2% above the yield for the US long bond. Instead they lowered this spread below -4% four times, and each time they did, they inflated a financial bubble in a different sector of the economy.
Note how after 1981, as each of the first three of these bubble markets began deflating, as the spread in the chart above increased just barely to a positive value, the Federal Reserve quickly lowered its Fed Funds a full 4% below the US T-bond yield. Unlike "monetary policy" from 1954 to 1980, where the Fed would raise their Fed Funds rate well above the US Treasure's long bond yield to force the liquidation of unviable debt held by the banking system, after 1981 the Fed.
* NEVER * instituted a proper tightening of the yield curve. Now after more than thirty years of easy money, the banking system's reserves are fouled with illiquid assets that cannot be marked to market. Should we be surprised that journalists such as CNBC's Senior Editor, John Carney, are now also pretending that there is nothing wrong with Doctor Bernanke "monetizing" his own banking systems' toxic assets, to keep the bond and mortgage markets inflated and protect the unviable assets held by his banking system? Since 1980, as evident in the chart above, the liquidation of ill-considered loans made by Wall Street's banks has not been an option, as far as the Federal Reserve was concerned!
After thirty-one years of this monetary madness, it is obvious that Doctor Bernanke can't invert the yield curve, evenslightly positive without blowing up the entire global bond market, and driving the world into a calamity that is likely to exceed the 1929-34 depression.
What makes this monetary malfeasance possible is a complacent, government-funded education system that has taught the dubious virtues of having "economists" manage monetary inflation for too many decades. If the majority of America's population is ignorant of the danger we are now in, it's because the financial media has knowingly refused to inform the American people of the shenanigans devised by Washington, Academia and Wall Street.
Clarence Barron, founder of Barron's Financial Weekly, is a hero of mine. But today, few "financial journalists" would care to shoulder the moral responsibility he'd place on them.
"You are in the field to defend the public interest, the financial truth for investors and the funds that should support the widow and the orphan." -- Clarence W. Barron's Mission Statement for the Financial Press
Mark J. Lundeen
[email protected]
[email protected]
More from Gold-Eagle


