Prices Of Gold Exclusive Update


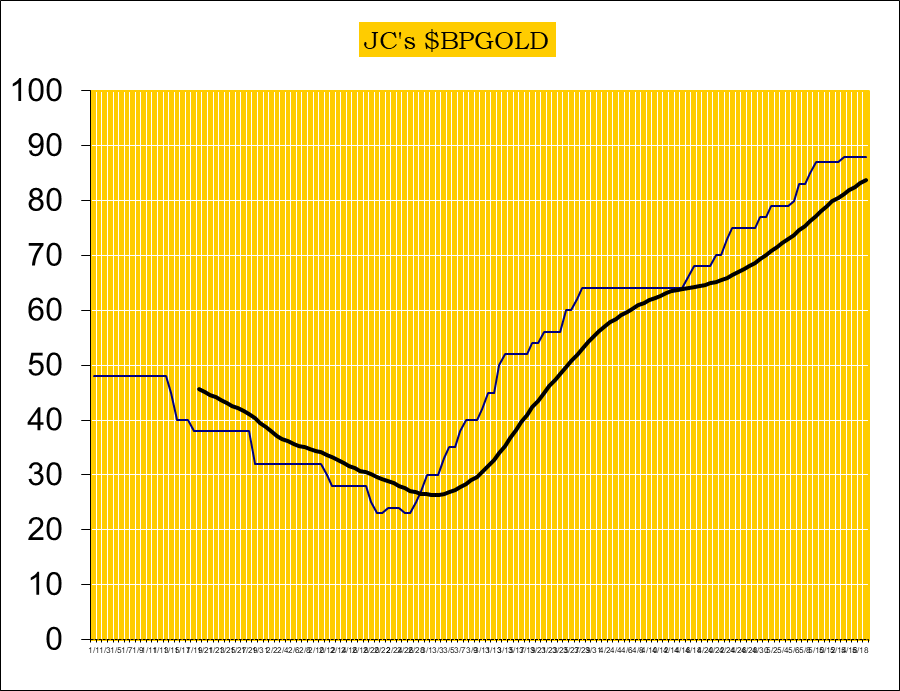
Our proprietary cycle indicator is up.
To public readers of our updates, our cycle indicator is one of the most effective timing tool for traders and investors. It is not perfect, because periodically the market can be more volatile and can result in short term whipsaws. But overall, the cycle indicator provides us with a clear direction how we should be speculating.
Investors
During a major buy signal, investors can accumulate positions by cost averaging at cycle bottoms, ideally when prices are at or near the daily 200ema.
During a major sell signal, investors should be hedged or in cash.
Traders
Simply cost average in at cycle bottoms when prices are at or near the daily 200ema; and cost average out at cycle tops when prices are above the daily 50ema.
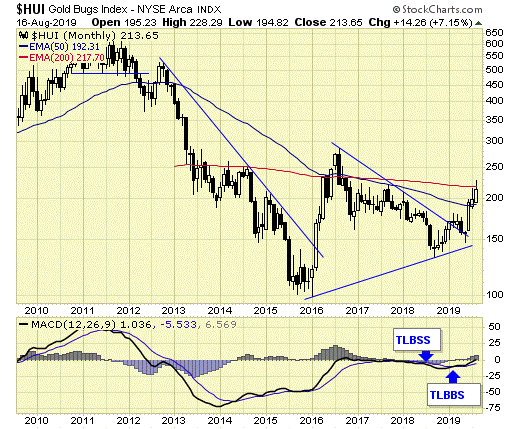
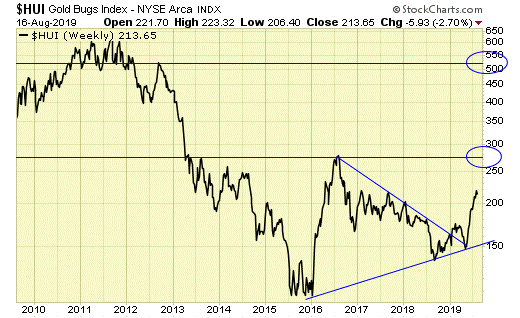
Gold sector is on major buy signal.
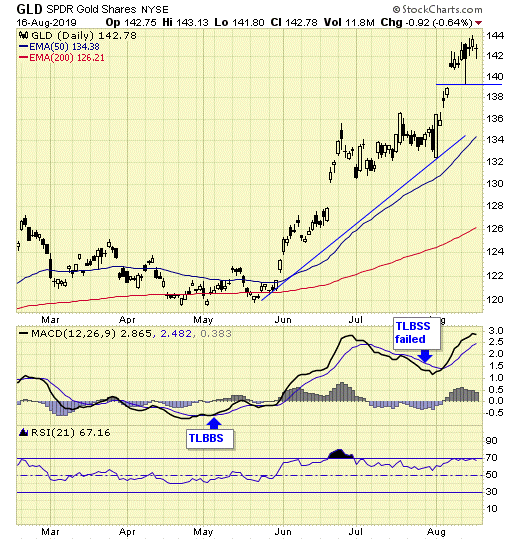
GLD is on short-term buy signal.
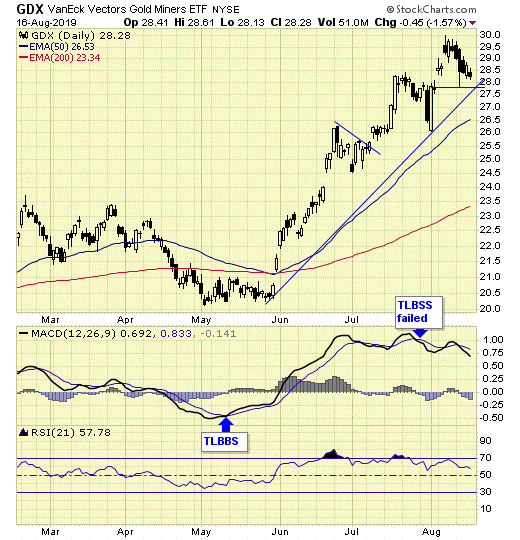
GDX is on short-term buy signal.
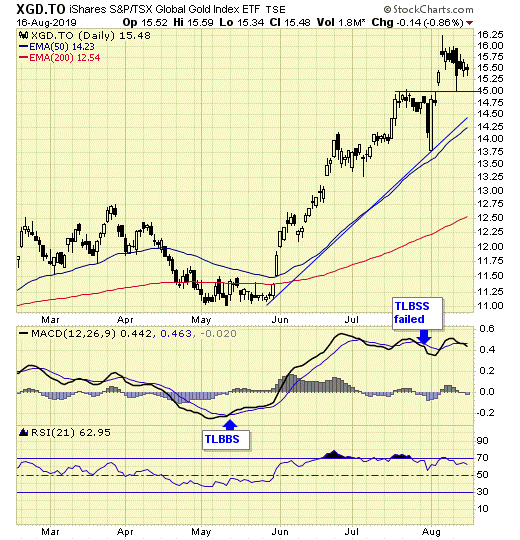
XGD.to is on short-term buy signal.
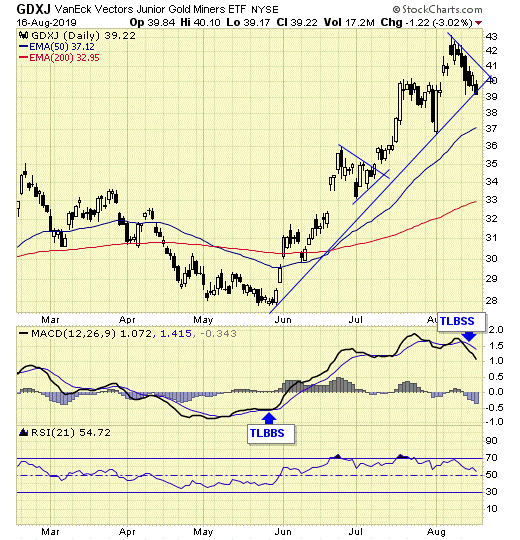
GDXJ is on short-term sell signal.
Analysis
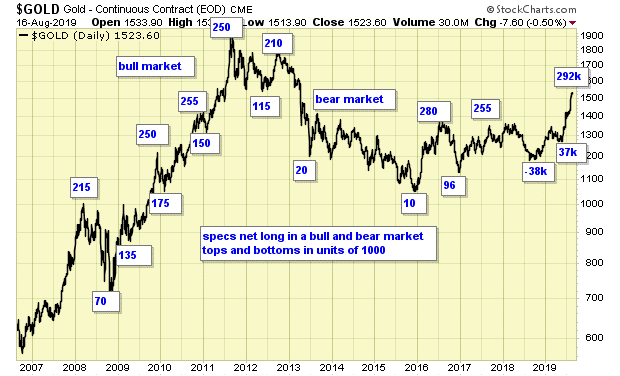
COT data on gold speculation is now at an all-time high.
Short-term volatility can be very sharp, stay focused on the big picture.
Stay focused on the long-term.
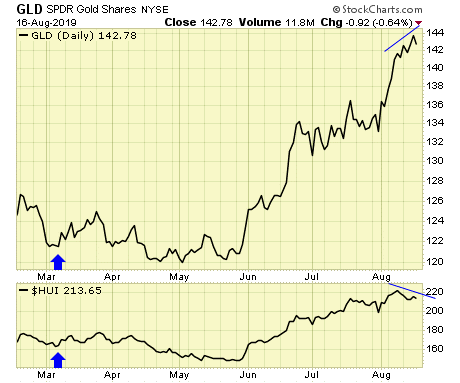
There is now a divergence in progress, expect a pullback or correction soon.
Summary
Long-term – on major buy signal.
Short-term – on mixed signals.
Gold sector cycle is up.
COT data is at levels of previous tops.
Stay focused on the long term and stay the course.
New money should wait for a correction.
Disclosure
We do not offer predictions or forecasts for the markets. What you see here is our simple trading model which provides us the signals and set ups to be either long, short, or in cash at any given time. Entry points and stops are provided in real time to subscribers, therefore, this update may not reflect our current positions in the markets. Trade at your own discretion.
We also provide coverage to the major indexes and oil sector.

Jack Chan is the editor of Simply Profits, established in 2006. Chan bought his first mining stock, Hoko Exploration, in 1979, and has been active in the markets for the past 37 years. Technical analysis has helped him filter out the noise and focus on the when, and leave the why to the fundamental analysts. His proprietary trading models have enabled him to identify the NASDAQ top in 2000, the new gold bull market in 2001, the stock market top in 2007, and the US dollar bottom in 2011.


