Resistance Roars Down On Gold


The best, brightest -- and moreover duly accomplished -- Gold analysts these past few weeks quite understandably have been in full throat calling for "Gold 2000 by the end of April!" or "Gold 2500 by June!" So much so have they put Gold on "Go!" that joining their chorus are many of lesser-to-non-analytical ilk so as to show they, too, are in the know. All of it serving to rather overwhelm our own occasionally-quipped pet headline of "World Ends, Dow +2".
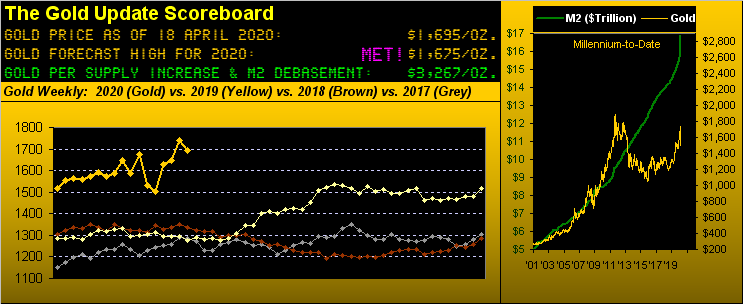
But you know what they say about markets: when the entire trading world makes it expectedly obvious that price is to lurch from A to B, if it hasn't instantly happened, it doesn't happen. Certainly per the above Gold Scoreboard, we've pegged Gold's price to be at 3267 right now. Indeed, without having scoured what everyone else is penning, ours may be the sole voice week-after-week -- ad infinitum, ad nausea, ad whatever -- that has been citing Gold's road to regain the 1900 level is fraught with resistance, which in its own full throat roared down upon price this past week.
To be sure, Gold just grew to its greatest level in better than seven years with price reaching 1789 this past Tuesday -- but smack into the heart of that resistance level to which we refer as "The Northern Front" (1750-1800) -- in turn tumbling nearly 100 points to as low 1691 yesterday (Friday) toward settling out the week at 1695, a mere 20 points above our forecast high for this year of 1675. The resistance we've been citing clearly won that battle at the front.
All fundamental rationale aside that Gold today truly ought be far higher than 'tis -- and shall inevitably be -- this obviously is not price's first foray both up and down between where 'tis today at 1695 and the All-Time High of 1923. Further, 'tis not only different, but indeed more difficult, this time.
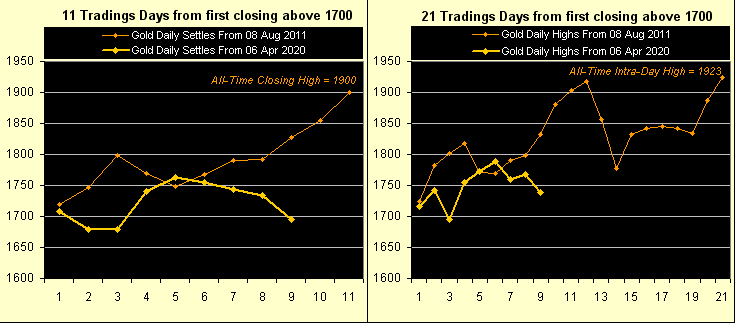
Remember back in 2011 as Gold moved into "hyperdrive" (per last week's missive) in blasting up through the 1700s and 1800s? There was nothing in the way nearly nine years ago to impede price whatsoever. Free as a bird was Gold to fly high as if supercharged by the infatuative, stomach-churning butterflies in every youngster's first all-consuming puppy-love crush. But this time 'round, the romantic energy is lacking. To wit the following two-panel graphic:
Gold first closed above 1700 on 08 August 2011, 11 trading days later reaching its All-Time Closing high of 1900 as shown on the left and a further 10 trading days later (i.e. 21 trading days in all) reaching its All-Time Intra-Day high of 1923 as shown on the right. Those tracks are the thin lines in both panels. The thick lines represent this year's Gold trading tracks by the day since again having closed above 1700 on 06 April. And as you can plainly see, the puppy ain't in play, at least to this point. To replay Gold's achievement of reaching 1900 at the 2011 pace, price has but two trading days remaining (per the left panel) to get there: it shan't happen that swiftly. As for reaching 1923, there's more time for Gold to wiggle its way there (per the right panel), but that means first winning the aforementioned Northern Front followed by taking The Final Frontier (1800-1900). All in all, 'tis one tall order:
"Your being dubious stands to reason, mmb."
Appreciate your acknowledgment there, Squire, thank you. And now there's an additional technical wrinkle of negativity of which to be aware. This next two-panel graphic is that of the daily bars across the last three months-to-date for Gold on the left and Silver on the right. And for both precious metals, their "Baby Blues" -- the dots which depict trend consistency -- have just kinked below their respective +80% horizontal axis levels, more often than not a portent for lower prices near-term:
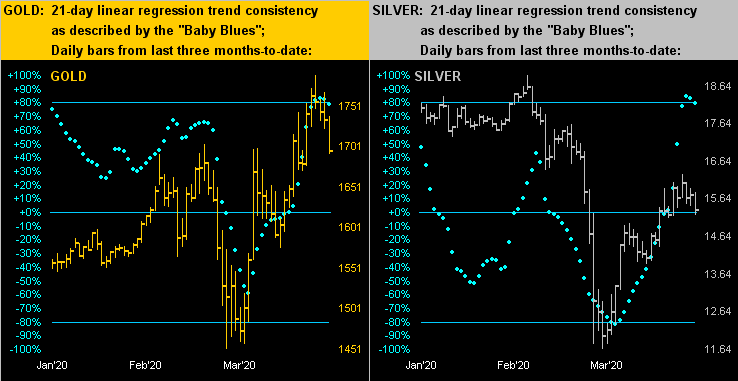
Barring renewed fundamental push to "buy the dip" only to again face the overhead resistance, our computers caught the break by both metals below those respective +80% levels such as to generate the following end-of-day table, (our comprehensive Disclaimer notwithstanding), although we don't sense there'll be that much downside through here, the mid-1600s appearing Gold-supportive and the mid-14s Silver-supportive:

Next let's go to Gold's weekly bars from one year ago-to-date, wherein the parabolic Long trend remains young by the rightmost four ascending blue dots. Still, for Gold's 1,007 trading weeks millennium-to-date, this past week's high-to-low decline by points ranks 19th worst, (putting it in the 98th percentile for bad weeks since 2001). Gold's median price fall for the other 18 worse occurrences over the ensuing four weeks was -78 points, (should you continue to be scoring at home). Note, too, the Gold/Silver ratio at 110.5x. Silver is the real Gold mine:
On to the breaking-down Economic Barometer, which in the ensuing week we don't see taking on too much additional damage if only because a mere five metrics (of better than 50 per month) come due. And whilst the month of March was only marginally into the COVID-driven business closures, as early on as 'tis in Q1 Earnings Season, the negative effects are already being laid bare: specific to the 26 S&P 500 entities having thus far reported their bottom lines, just seven bettered same of a year ago. Indeed, uh-oh:
'Course the bright-eyed and bushy-tailed Big Guy entities ain't gonna miss out on their perception of stock market bargains. You regular readers know that the S&P 500's Moneyflow as regressed into S&P points reached its extreme downside diversion from the Index itself back on 12 March, seven trading days prior to the S&P's actual low on 23 March. Thus on the up move this past month-over-month has been the Moneyflow as measured from 18 March-to-date that we next see here. The red line is the cumulative points change for the S&P (+476) and the blue line is the points change for the Moneyflow (+745). Yes (part un), Bank of America's fund manager survey for April suggests that investors are sticking to cash, however our history shows that 'tis the Index that follows the Flow. Yes (part deux), our "live" price/earnings ratio for the S&P is a far too expensive -- and now climbing -- 36.3x. But in this zero percent-interest rate world, market mavericks don't give a derrière-du-rat:
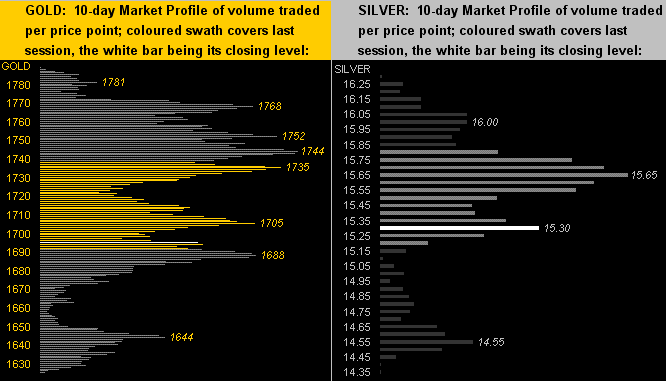
Be it the invasion of the rats or the infection from a bat, the resulting monetary debasing has been fat. And as noted, the precious metals made their obligatory leap higher, but thus far have lacked the en masse muscle to fully win The Northern Front (1750-1800). So per the following two-panel graphic of the 10-day Market Profiles for Gold (below left) and Silver (below right), the fresh overhead trading resistors (mired within the long-standing overhead structural resistance) are as labeled:
In sum, we're only mildly bearish just near-term for Gold. Indeed, this wee dip below the 1700 milestone may be of enough numerical notice in itself to bring buyers back to the fore. But Gold this past week did take quite the points beating as resistance roared down upon it. Yet as is our wont to say, change is an illusion whereas price is the truth. And broadly speaking, despite the week's large down illusion, 'tis the truth that remains ever so attractive. As for the requisite muscle in combating the overhead resistance, all you puppies out there in favour of a Gold group buy say AYE!
Oh good grief... Cheers!
www.deMeadville.com
www.TheGoldUpdate.com
*********

Mark Mead Baillie has had an extensive business career beginning in banking and financial services for two years with Banque Nationale de Paris to corporate research for three years at Barclays Bank and then for six years as an analyst and corporate lender with Société Générale.
For the last 22 years he has expanded his financial expertise by creating his own financial services company, de Meadville International, which comprehensively follows his BEGOS complex of markets (Bond/Euro/Gold/Oil/S&P) and the trading of the futures therein. He is recognized within the financial community of demonstrating creative technical skills that surpass industry standards toward making highly informed market assessments and his work is featured in Merrill Lynch Wealth Management client presentations. He has adapted such skills into becoming the popular author each week of the prolific “The Gold Update” and is known in the financial website community as “mmb” and “deMeadville”.
Mr. Baillie holds a BS in Business from the University of Southern California and an MBA in Finance from Golden Gate University.
More from Gold-Eagle


