Review Of The Current Bear Market In Stocks (Part 2)


No matter who wins next month's presidential election, the next few years should prove to be exciting for market watchers, and miserable for most everyone else. We've had the financial markets dominated by politicians and special-interest groups for decades. There are now unavoidable consequences to be faced. Mr Bear has no intention of going away until he finishes what he began; clearing every balance sheet in the United State of unviable debt, and deflating overvalued stock and bond prices, and real estate valuations well below their fair market values. That includes your home and pension fund too.
So while things are slow in the markets, let's take a few moments and review the Dow Jones fundamentals from 1885 to 2012. The chart below uses weekly closing price data.
Here are two views of the past 127 years of the Dow Jones' price history: the blue plot (left scale) displays the Dow Jones from 1885 in my Bear's Eye View (BEV) format; the red plot displays the same data, as published by Dow Jones in nominal dollars. There is quite a difference in the two views: the blue BEV plot displays valuable market information all the way back to 1885, a 127 year record of past bull and bear markets that is sadly lacking in the red-nominal dollar plot. Why is there such a difference? Because in 1913, Congress passed legislation that created the Federal Reserve, a central bank that has destroyed the value of the US dollar, and distorted the valuation of Dow Jones', and all other asset valuations in the process. In other words, a dollar today doesn't buy what a few pennies did in 1913.
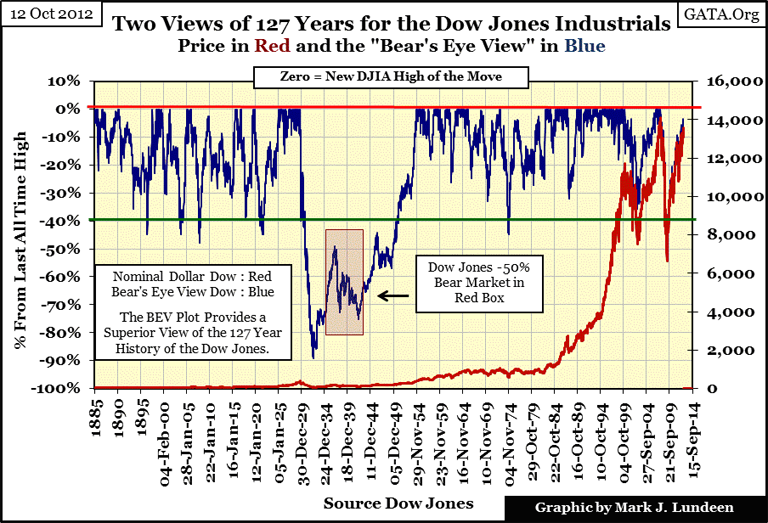
For example, from 1890 to 1896 the Dow Jones declined 45%, but this is only evident in the blue BEV plot. The red nominal dollar plot displays this decline in dollar terms: from $37.63 in April 1890 to $21.64 in August 1896. However, with the Dow Jones now over $13,000, the Dow Jones all-time high of 1890, less than $40, is now just a rounding error for today's Dow Jones. The entire -40% bear market of the 1890s is invisible in the red plot because of what the Federal Reserve has done to the purchasing power of the US dollar.
Plotting the long history of the Dow Jones in Dollar terms is actually pointless, until the start of the 1929-32 Great Depression bear market. If you look really hard at the red-nominal dollar plot, you'll see the largest bear market in the history of the Dow Jones. From September 1929 to July 1932, the Dow Jones declined a massive $339.11 from its Roaring 20s high of $381.17, for a thirty four month loss of 89%. Today, a decline of $339.11 would be a daily move of about 2%, but eighty years ago, this $339.11 decline in the Dow Jones was a reason for suicide. Compare the Great Depression's market crash in dollar terms with the blue BEV plot. The Bear's Eye View places the Dow Jones' Great Depression's decline in its true perspective, as a percentage decline from a previous all-time high. The BEV plot enables us to compare every bull and bear market in the Dow Jones from 1885 to 2012, and corrections in a bull market, confined within a percentage range of only 100%:
- New all-time highs = 0%, (BEV Zeros)
- Percentage declines from all-time highs
In a BEV chart, a decline of -100% (from a BEV Zero to -100%), no matter what the nominal dollar decline may be, is a total wipeout. Converting price movements into percentage terms normalizes the price series no matter how much the price series has been distorted by monetary inflation over time.
For your information, in all my work, I used the previous day's closing price for my daily moves, not the percentage move from a trading day's opening to closing price. Also, in the text that follows, I term any bear market whose bottom declines below -40.00% (from a previous all-time high), as a "Dow Jones 40% bear market", which includes July 1932's -89% bear market bottom.
In the history of the Dow Jones, there are certain percentages that have significance. In the BEV plot above, a decline of -40% is obviously significant. With the exception of the 1929-32 decline, a 40% decline in the Dow Jones was a key insight that Mr Bear had pretty much finished with his cleanup duties of ridding the economy of its inflationary excesses. Was this insight known to market watchers for the past 127 years? Maybe, however I've never seen any mention of this in my extensive reading of past issues of Barron's going back to 1921. No matter; when converting the published values of the Dow Jones into the Bear's Eye View format, it becomes obvious that since 1885, a Dow Jones decline of 40% may * NOT * have signaled the end of the decline, but usually marked a safe re-entry point, the point-in-time when one could begin purchasing those stocks that survived the ordeal at very attractive prices.
In the Dow Jones' 127-year history, the only exception to the Dow Jones' -40% rule was the 1929-32 bear market, when coming back into the market after the initial September- November 1929 Dow Jones decline of -40% (actually 47.87%) proved to be a disaster.
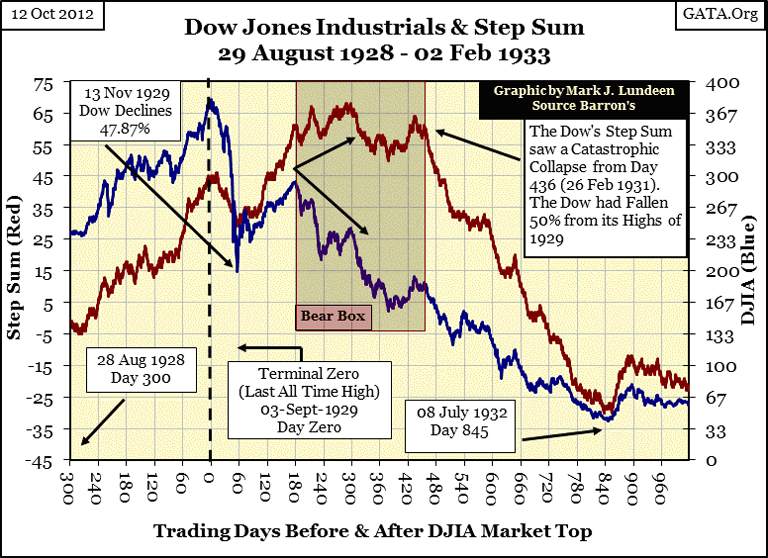
This Dow Jones step sum is an amazing chart. After the 1929 September - November (two months) 47.87% decline, investors had reason to believe the worst was over. In fact, this sharp 47.87%, two month decline was the deepest decline in the Dow Jones since 1885, exceeding the Dow Jones panic lows of 1907 (47.79%). Up to 1929, the Dow Jones had never experienced a 50% decline, but it soon would! (See BEV chart). The Dow Jones' step sum tells us that market sentiment turned bullish, precisely as the Dow bounced off its November bottom, and stayed bullish for the next fifteen months as the Dow Jones first saw an excellent dead-cat bounce (+48% from November to April), and then entered stock market history with a decline of 58% in December 1930. See chart above for details.
But it wasn't for another two months (February 1931) before the bulls realized that they were sinking in quicksand ; the Dow Jones' step sum began collapsing catastrophically as Mr Bear took the Dow Jones to its ultimate -89% decline of July 1932.
I believe our current bear market (2007-2012), like the 1929-32 bear, will prove to be another exception to the Dow Jones' 40% rule, a two tiered drop to its ultimate bottom, and for the same reason; irresponsible credit expansion flowing from the Federal Reserve into the economy.
Just as the Dow Jones 40% decline of November 1929, proved to be inadequate to purge the financial system of the ill-advised debts and inflationary excesses of the Roaring 20s, our 50% decline of March 2009 also has failed to purge the economy of bad debts and illiquid assets.
In fact our current situation is much worse than in 1929, and continues declining with each additional dollar Doctor Bernanke "injects" into the economy. As was the case in 2006-07, I'm again receiving phone calls from banks offering me an opportunity to refinance my mortgage at "today's historic-low interest rates" - but I've never had a mortgage. These annoying interruptions in my life must be cold calls from a desperate banking system attempting to inject additional credit into the economy via the mortgage market.
Another reason I suspect the 2007-12 Credit Crisis bear market has yet to find its ultimate low is because every major Dow Jones bear market sees a significant collapse in its step sum. In a bear market, the collapse in the Dow Jones step sum marks a psychological point where the bulls finally accept their doom. All hope of a market turnaround evaporates with the collapsing step sum, as Mr Bear hammers home his message of asset overvaluation with relentless daily declines in the Dow Jones.
In the chart below, we see a comparison of the 1929-32 (Blue Plot), and the 2007-12 (Red Plot) bear market step sums. Each plot begins at their last all-time, or bear market day zero:
- 03 September 1929
- 09 October 2007.
In the case of the 1929-32 bear market, the Dow Jones step sum (market sentiment) refused to collapse until eighteen months later in February 1931. For the next sixteen months, up days for the Dow Jones were overwhelmed by down days. By July 1932, at the -89% bottom, all hope had evaporated, and despair was universal, just as the Dow Jones entered it best year in history. From July 1932-33, the Dow Jones increased 153%, but by that time, most investors had been permanently scared out of the market.
The Great Depression's step sum tells us the 1930-32 bulls didn't fully grasp their situation until February 1931, when they finally surrendered to the overwhelming deflationary pressures of the Great Depression, as seen in the net 110 day collapse in the Dow's step sum over the next sixteen months.
Looking at this Dow Jones' step-sum chart, I wonder if our 2007-12 bear market, and step sum is fated to play out in a similar way, but over a much longer period of time. I'm not saying anything controversial, reminding you of Doctor Bernanke's well publicized efforts to keep his financial bubble inflated. Remember, the step sum is a sentiment measurement of a market's active traders, those people who trade in volume, each and every trading day.
In today's markets, our current step sum is recording the optimistic sentiment of Doctor Bernanke and the large banks he finances with inflationary funding. They trade with abandon because they believe any market missteps on their part will be made good by the US government. No wonder the bulls during the 2007-09 market crash never turned bearish (as seen in the Dow Jones step sum); their activities (criminal and other wise) were backstopped by the Federal Reserve and the US Treasury, as the US Justice Department (the FBI), and Federal regulators looked the other way for the past four years. Contrary to what the propagandists for President Obama would have us believe, the community organizer from Chicago is Wall Street's greatest supporter.
How sad. There was a time when the world's financial markets were used to raise capital for industry and commerce, creating wealth and general prosperity in the process. But today's markets are now only political props, managed to keep an entrenched political class entrenched. Below are two significant "policy maker" opinions on leaving the "free markets" alone to find their own valuations.
"The primacy of politics over markets must be enforced." -- Angela Merkel, Germany's chancellor during the Greece Debt Debacle, 2011.
"Policies have contributed to a stronger stock market just as they did in March 2009, when we did the last iteration of this. The S&P 500 is up 20% plus and the Russell 2000, which is about small cap stocks, is up 30% plus." -- Doctor Benjamin Bernanke, CNBC Interview with Steve Liesman of 13 Jan 2011 (1:40 PM).
History is filled with examples of people who "couldn't pour piss from a boot if the instructions were written on the heel" (as per President Johnson during the Vietnam War). Historically, politicians and their supporters, bullied, cheated and lied their way to the top, manipulating their society's levers of power to get their way over a nation's population, only to crap on everything, and everybody within reach. The current market is managed to a dangerous degree, and cannot end in any other way but in disaster. A grim future is baked into our cake. The only real support in the bond and stock markets is * CONFIDENCE & GULLIBILITY *; that Washington knows what it's doing when it promises to inflate the supply of US dollars in circulation to infinity, to support asset valuation and employment. Reasonable people know this can't be true.
We'll know when the vermin rigging the financial markets finally realize they can no longer avoid the consequences of their reckless actions, the point in time when * CONFIDENCE * in the financial system turns into * DOUBT *; when the current Dow Jones bear market's step sum finally enters its catastrophic collapse, exactly as it did from February 1931 to July 1932. I note too that the Dow Jones current bear market's step sum topped out at 78 on day 1149 (01 May 2012). Will this prove to be the top in the Credit- Crisis Dow Jones' bear market step sum? I think it will. I'm now waiting for the inescapable catastrophic collapse in the Dow Jones step sum, but not holding my breath waiting for it to begin. Some things just take time.
There are other numbers for us to be aware of:
- 2%, or more, Daily Moves in the Dow Jones (2% moves up or down are Days of Extreme Volatility)
- 70% Of the Issues trading on the NYSE Advanced or Declined (My Days of Extreme Market Breadth are computed as follows; A-D / Total Shares Traded)
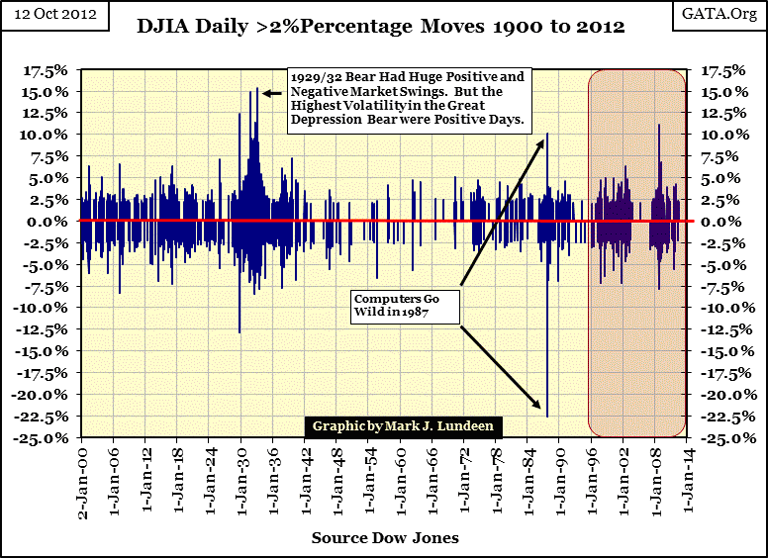
Days of extreme volatility and market breadth are rarely seen in true bull markets, but are regularly occurrences in bear markets. Let's take a look at the Dow Jones 2% days, or days of Extreme Volatility. Below I've plotted every day of extreme volatility since January 1900, in a running 200 day sample. Each spike in the plot below corresponds to periods of distress in the stock market. It's not hard identifying the #1 & #2 Dow Jones Bear Markets in the chart below.
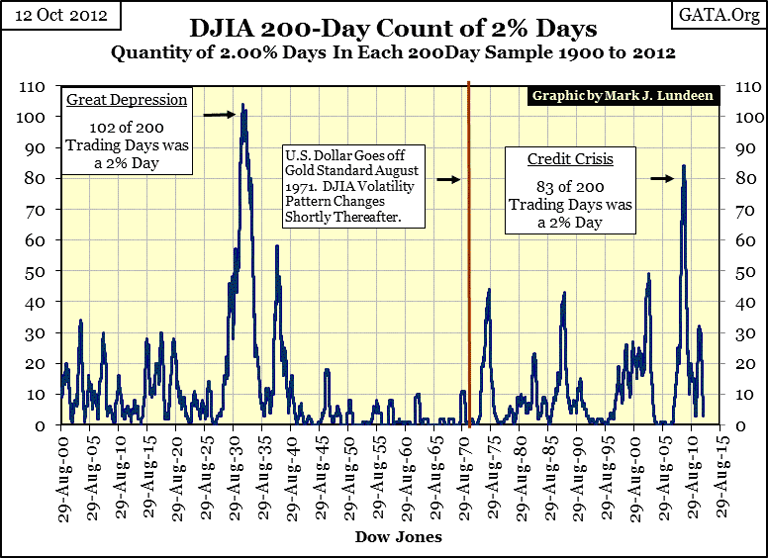
So frequent Dow Jones daily moves of 2% (up or down from a previous days' closing price) are bear-tracks on Wall Street. They are also rare market events. Since 02 January 1900 (112 years), there have been 30,658 trading sessions at the NYSE. However, in the past 112 years, there have only been 1789 days of extreme volatility (5.83% of the total trading sessions) where the Dow Jones moved 2%, or more from a previous day's closing price.
Like my Dow Jones "-40% bear markets", the "2% day" is a generalization, where a 10% daily move is lumped in with all other days of extreme volatility. Here is a chart displaying every 2% day since January 1900. There appears to be many 2% days since 1900, but remember there are actually only 1789. Note how these 2% days occur in clusters that mark bear markets.
These charts for the Dow Jones days of extreme volatility are interesting, but not the best way to observe them. In my daily work, I use a running 8 day sample, or "8 count"(Red Plot), plotted with the Dow Jones in the Bear's Eye View format (Blue Plot) as seen below. Below we see the relationship between low daily volatility and strong markets, and frequent Dow Jones 2% days (high 8 counts) being associated with a stock market in distress.
This relationship between Dow Jones days of extreme volatility and bull and bear markets has existed since January 1900. We are currently in a lull in our bear market. When Mr Bear returns, we'll see the Dow Jones' 8 count registering a count of three, or more days of extreme volatility within the running eight day sample for weeks and months.
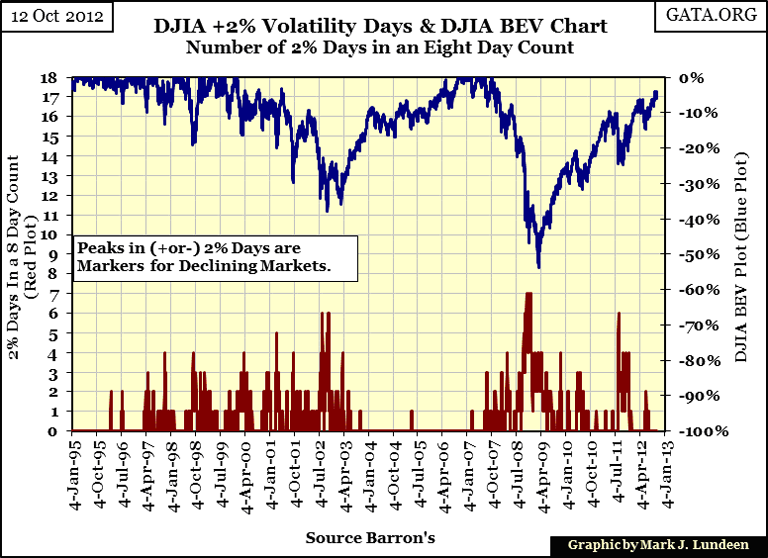
What I like so much about the Dow Jones's step sum and 8 count is that both indicators are derived from the daily price movements of the Dow Jones itself. You might say that using the step sum and 8 count allows the Dow Jones itself to tell us how the stock market is doing.
Let's now look at NYSE Days of Extreme Market Breadth, or NYSE 70% A-D days. In the chart below, the data points are computed as follows:
NYSE Advancing Issues - NYSE Declining Issues / Total Shares Traded on the NYSE
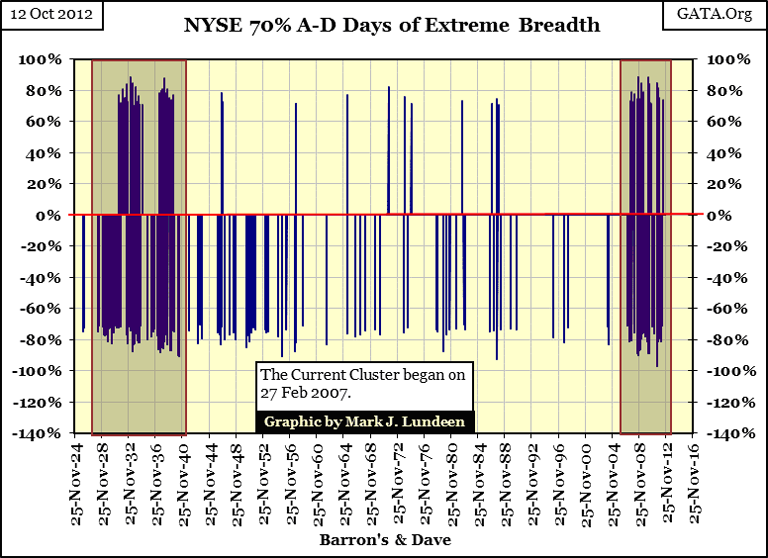
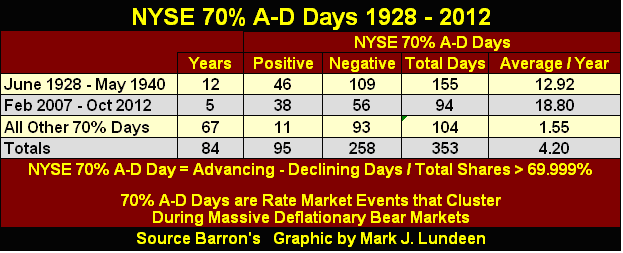
Any day this ratio registers a plus or minus 70%, the NYSE saw a Day of Extreme Breadth. These NYSE 70% A-D days are very rare market events. Since November 1924, the NYSE has seen only 353 days of extreme breadth.
Note how these days of extreme market breadth have clustered during the tail end of the 1929, and 2007 bull markets, and during the Great Depression and our Credit Crisis bear markets. Clusters of negative days of extreme market breadth aren't good, but aren't necessarily bad either. They were regular occurrences from 1942 to 1954. If you go back to my chart of the Dow Jones BEV plot from 1885 to 2012, you will see that during these twelve years, the Dow Jones increased until it exceeded its highs of 1929, even with the negative 70% breadth days seen above.
However, for stock market bulls, there is * ABSOLUTLY NOTHING * good to say about clusters of POSITIVE NYSE 70% A-D Days. Clusters of positive days of extreme market breadth are the hot breath of Mr Bear on the necks of stock-market bulls as they flee for their lives.
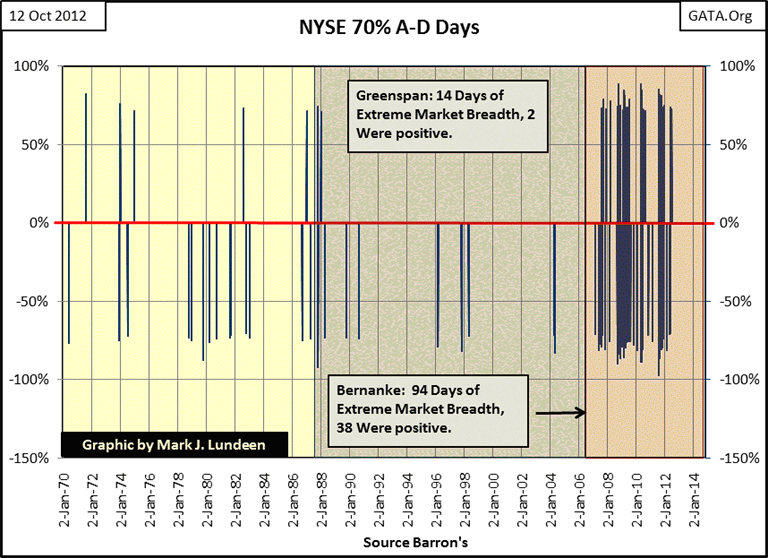
Doctor Greenspan became Fed Chairman in August 1987 and retired in early 2006. During his chairmanship, the stock market was almost free from negative NYSE 70% A-D days, and saw only two positive NYSE 70% A-D days during the market crash of October 1987. In the following nineteen years, the stock market was free from positive days of extreme breadth. It's no wonder Greenspan was a bull market hero. But Doctor Bernanke tenure at the Fed has been plagued with days of extreme market breadth, we can be sure that he will exit from the Federal Reserve as a bull market zero.
Returning to my chart of extreme market breadth from 1924-2012, we all know that the 1930s was a rotten time to be in the stock market, except from July 1932 to March 1937, when the Dow Jones increased 370%. During this bullish phase of the 1930s, we see a gap from December 1934 to July 1937, where days of positive NYSE 70% A-D days didn't occur. I don't believe that is a coincidence. Nor is seeing a cluster of positive days of extreme market breadth, which began in August 2007, two months before the October 2007 top for the Dow Jones, as it began sliding down into the second deepest bear markets since 1885.
This cluster of positive days of extreme market breadth is still growing. In June of this year, we saw two more added to the cluster above, Mr Bear is still thinking of us. When the stock market once again begins to decline, we'll see many more days of extreme market breadth coming our way.
In the table below, I've listed the number of days of extreme market breadth for the Great Depression years, our Credit-Crisis bear market, and all other years. Note how in the past five years, our current bear market has seen almost as many positive NYSE 70% A-D Days as occurred during the 1930s.
So why was the low of March 2009 only 53%, and not something more dramatic? For the same reason the Dow Jones' step sum hasn't begun its catastrophic collapse; Doctor Bernanke and the other stock market bulls in the Federal Government still believe they have a chance to beat Mr Bear, and keep financial asset valuations inflated beyond reason via low interest rates and monetary inflation, while ignoring criminal activities in the financial markets to make this happen. When they realize that they're on a fool's errand, we'll see bear market history being made with:
- The collapse in the Dow Jones' step sum,
- Increasing numbers of Dow Jones' days of extreme volatility
- Increasing numbers of NYSE days of extreme market breadth
During the 2008-09 decline, I was on record predicting the Dow Jones would decline below its Bear's Eye View -60% line. Now with the Dow Jones only 6% points from taking out its last all-time high of October 2007, I'm still holding to this prediction, and I don't rule out that the 2007-12 bear might even become the #1 bear market since 1885 before it's time to seriously consider returning to the stock market.
Mark J. Lundeen
[email protected]
[email protected]
More from Gold-Eagle


