A Review Of The Gold & Silver Markets: Their Bull Markets Are Still Intact


Since 2011 the gold and silver markets have been under pressure. Then in June of this year they appeared to have found their bottom with August delivering some nice price advances off the June lows. Everyone was optimistic that come September and October the prices for old monetary metals were going to finally do what they have historically always done when a central government was grossly over issuing their currency – make major gains in their price! So why in the past few weeks have they been going down, with yesterday’s selling panic in the gold and silver markets being the worst price collapse in a long time?
First of all, yesterday’s selling panic was the fourth time since April 2011 where the precious metals markets endured a selling panic because their futures markets were flooded with paper contracts from politically-connected banks that have zero ability to supply the metal they are contracting to deliver sometime in the future. If the Federal Regulators at the CFTC, key members in the US Congress, President Obama and his Attorney General Eric Holder, were not bought and paid for by the Federal Reserve System, days like 12 September 2013 would result in indictments in a Manhattan Federal court room.
Tyler Durden from Zero Hedge sums it up for us:
Vicious Gold Slamdown Breaks Gold Market For 20 Seconds (Tyler Durden)
“There was a time when, if selling a sizable amount of a security, one tried to get the best execution price and not alert the buyers comprising the bid stack that there is (substantial) volume for sale. Of course, there was and always has been a time when one tried to manipulate prices by slamming the bid until it was fully taken out, usually just before close of trading, an illegal practice known as "banging the close." It appears that when it comes to gold, the former is long gone history, and the latter is perfectly legal. ---, overnight just before 3 am Eastern, a block of just 2000 GC gold futures contracts slammed the price of gold, on no news as usual, sending it lower by $10/oz. However, that is not new: such slam-downs happen every day in the gold market, and the CFTC constantly turns a blind eye. What was different about last night's slam however, is that this time whoever was doing the forced, manipulation selling, just happened to also break the market. Indeed: following the hit, the entire gold market was NASDARKed for 20 seconds after a circuit breaker halted trading!”
* * *
This is the story played over and over again; at key times and prices, the gold and silver markets are overwhelmed with paper from the big Wall Street banks promising to deliver what doesn’t exist. Since April 2011, it’s become a really bad habit. My silver with its step sum chart best illustrates the problem in the gold and silver markets. Look at silver’s price trend (Blue Plot); here are the details for the major market outrages of the past few years:
- April 2011: -27% in 5 days
- Sept 2011: -25% in 3 days
- April 2013: -17% in 2 days
- Sept 2012: -6% in 1 day
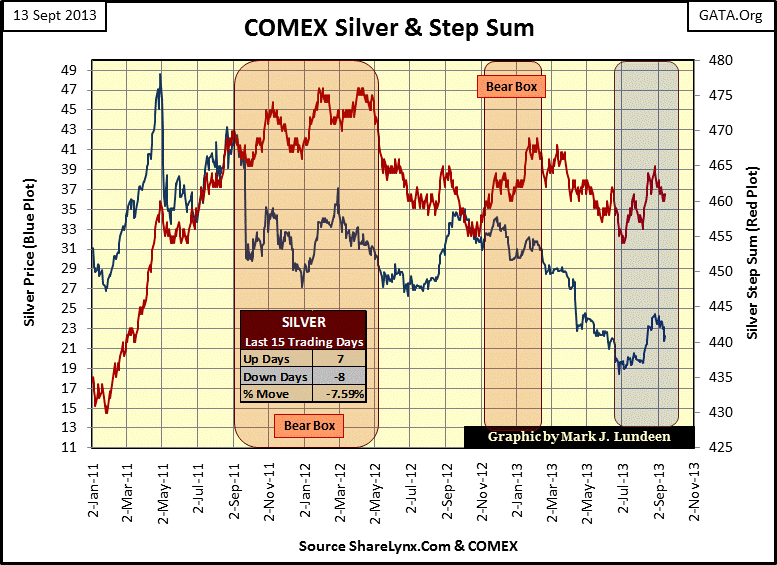
Looking at the other whack jobs on the silver price since April 2011, Thursday’s price decline wasn’t that bad, but it still hurt. And I admit that the gold market hasn’t seen the extremes silver investors have endured in recent years. But the pattern of massive price declines occurring in just days as financial institutions (that don’t mine actual metal for the market), are allowed to issue unlimited paper promises to deliver metal that will never exist into the futures market is a repeating pattern of misconduct seen in both the gold and silver futures markets. If the CFTC was actually interested in enforcing their own regulations in the precious metals markets there is plenty to investigate, and have been for decades. But market regulators’ attitude towards Wall Street is the same as our Attorney General; Eric Holder, who told Congress this year that he isn’t going to investigate Wall Street as it might crash the markets. This is the world we live in.
Currently, Washington and Wall Street power-brokers believe they can pick and choose which law they want to follow. For example the law of supply and demand when it comes to the number of US dollars they issue and the price of precious metals in the public market place. The chart below plots the number of paper dollars in US Currency in Circulation (CinC / Blue Plot) and the US gold reserves (Red Plot) priced in US dollars at $42.10 per ounce for the gold reserves we are told is held by the US Treasury; about 262 million ounces of gold.
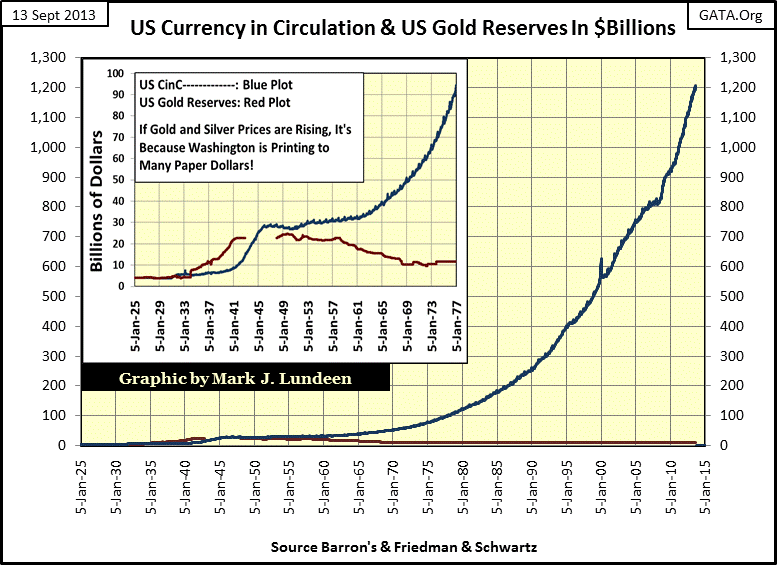
Long before incompetent economic professors were allowed to test their pet theories of money and credit on the real economy we must all make a living in, people could and did go to banks to exchange their paper $20 bills for $20 double eagle coins, or exchange their gold coins for paper money. Why this no longer so can be seen in the chart above; paper money has overwhelmed the supply of monetary gold. That many people believe that gold and silver prices (and everything else) can never roar upwards someday to correct this distortion in the law of supply and demand is amazing to me.
Below is a table listing some specifics for the post WW2 Bretton-Wood Monetary Accords era.
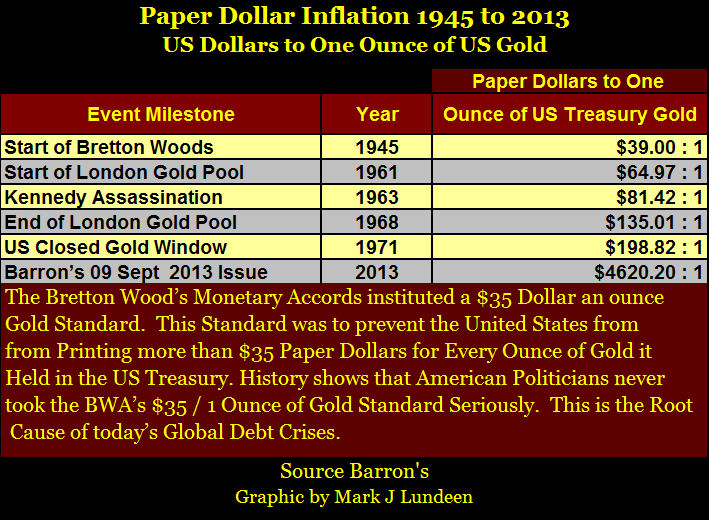
An interesting fact about the Bretton Wood gold standard, as well as the pre-World War One gold standard that was in place before the Federal Reserved was created in 1913, is that global commerce and consumers never demanded that they be terminated. The markets actually liked sound money and the economic stability they brought. What happened to end the gold as money era was that at the start of World War One, governments began printing more paper currency than the global gold reserves could back, and for the past 100 years, they have never stopped. Since 1918, the result has been having the global economy drifting from one monetary crisis to the next; for instance the Roaring 20s boom and the Depressing 30s bust. We need to include the market booms and busts of the Greenspan and Bernanke Feds on this list too!
The “policy makers” have never taken responsibility for their inflationary malfeasants. They don’t have to as their academic colleagues write the financial history and economic text books used in college. They have made the gold standard the villain and managed inflation with debt backed money the hero of “economic growth.” Generations of financial journalists, lawyers and just plain old college students seeking an education have taken notes as economic professors blamed the gold standard for the problems politicians, bankers and academics have created with their expanding money supplies in the past 100 years. But if fair-minded people take a moment to study the chart and table above, they may begin to suspect that what the economists employed by government-funded schools and Wall Street have told them over the past decades may not be exactly as they would have us believe.
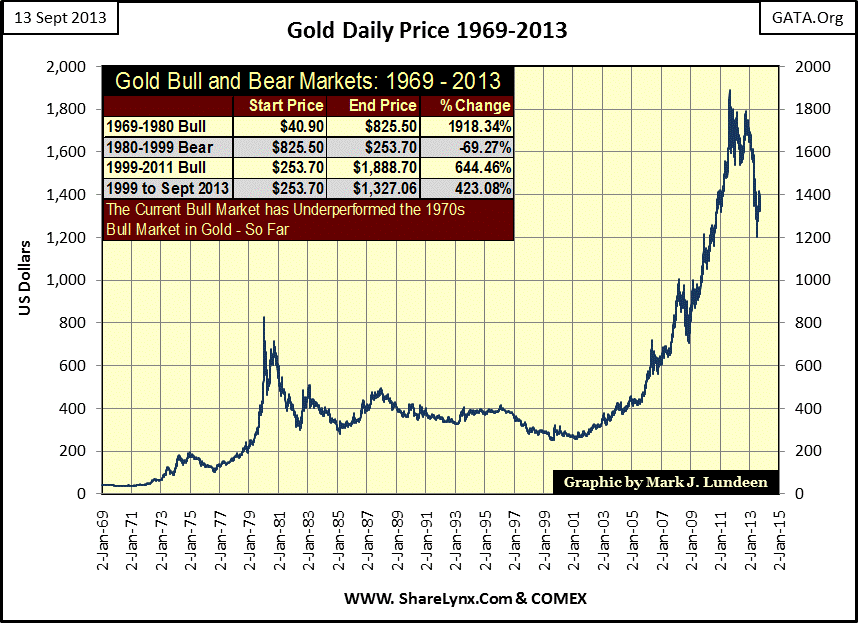
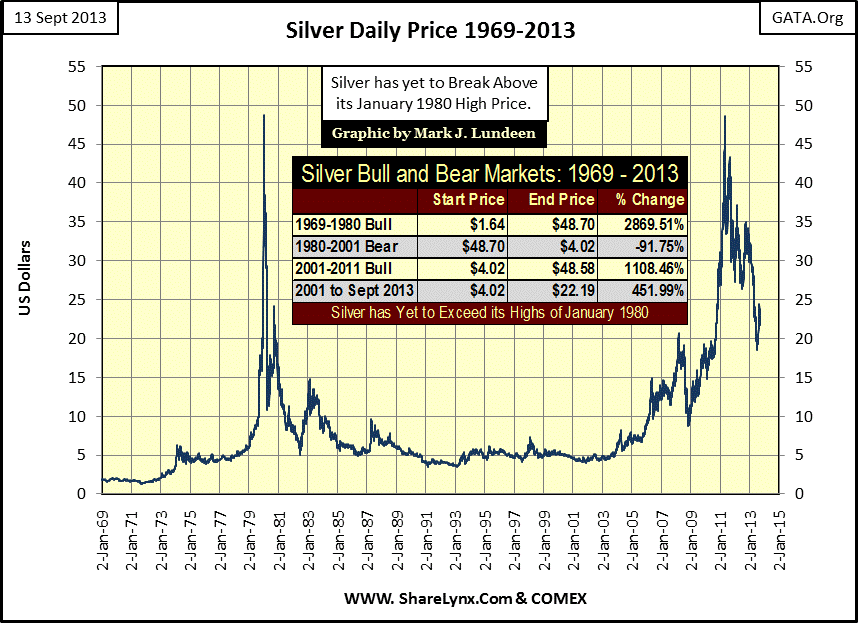
So, after a difficult week the best thing to do is to step back and look at the gold and silver markets for the past forty four years. First gold’s dollar chart with a table listing the bull and bear markets since 1969. Note how inflation distorts market price reality. Looking at the plot below, one could easily believe our current bull market has been more profitable than the 1970s bull, but as seen in the chart’s table that is not the case at all. During the eleven years from 1969 to 1980, gold advanced some 1900%, far exceeding gold’s current bull market gains from its 1999 bottom to its last all-time high of $1888 seen in August 2011: 644%. Currently (September 2013), gold is still in its most significant price correction since 1999, but as we shall see, gold saw a deeper correction during its 1970s bull market than it has since our current bull market began in 1999.
The most interesting fact about our current bull market in silver is that its current all-time high price is still from January 1980! In the chart’s table below, we see the price of silver in April 2011 came close to making a new all-time high. However using daily closing data, silver fell $0.12 short of doing so just before Wall Street whacked it in full view of its regulators and the financial media. As I recall, the COMEX raised the margin requirements three times in just a day or two – but only for the silver longs. These people managing the futures markets are shameless, but the main-stream media never calls them out.
Next are the long-term Bear’s Eye View (BEV) charts for gold and silver. Remember, in a BEV chart decades of inflationary data is compressed within a range of only 100 percentage points. Each BEV Zero % is a new high of the move in the selected range of values, possibly a new all-time high. All data points not a BEV-Zero % are percentage declines from their previous BEV- Zero, or high of the move. The BEV format provides an interesting view of the market highlighting bull markets, with their bull market corrections, and bear markets in percentage terms. Looking at the markets like Mr Bear does is an excellent technique of normalizing market moves in inflated price data that spans decades: all-time highs (BEV Zeros) and declines from those highs, with a -100% being a total wipeout in valuation.
Here is gold’s BEV chart from 1969. Each BEV Zero in this chart is a new all-time high, but in 1969 that only took $43.50 an ounce to accomplish this. In January 1980 when gold reached $825.50, Mr Bear was no more impressed with that lofty valuation than he was with $43.5 in 1969 or $1888 in 2011. Remember, each new all-time high is just a BIG-FAT ZERO to Mr Bear, as he is only interested in how many percentage points he can claw back from the bulls.
During the 1969-80 bull market we see how Mr Bear got away with clawing back 47% from the bulls in 1976, just before the market took off to its ultimate high in January 1980. So far in our bull market, gold has not seen the volatility it suffered in the 1970s. This is a fact Wall Street bears fail to appreciate, that our current percentage decline in price of gold would have been a typical bull market correction several decades ago. If gold’s current $560 nominal dollar decline from its last all-time high of $1888 seen in August 2011 is historic, it’s only because the American dollar has suffered massive losses in purchasing power since 1969. Because of the Federal Reserve management of “monetary policy”, the American dollar has become a wasting asset that will ultimately become worth nothing.
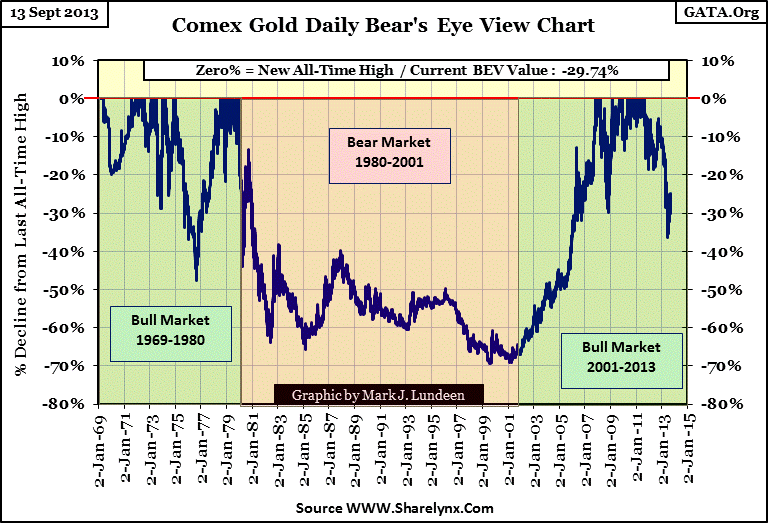
For your information, the 1980-2001 bear market actually saw its absolute low in July 1999. So why don’t I say in the chart above that our gold bull market began in 1999? Because it wasn’t until two years after gold’s 1999 absolute low that the price of gold really began to advance as is obvious in the BEV chart above. Now in 2013, whether one decides to use 1999 or 2001 as the start of the bull market is a moot point. But maybe the most compelling reason for using 2001 as the starting point for our current gold bull market is that beginning in 2001, gold has yet to have a down year. See the following table. Twelve consecutive up years is something the Dow Jones never accomplished during its 1982-2000 bull market, if it ever has since it was first compiled in 1885.
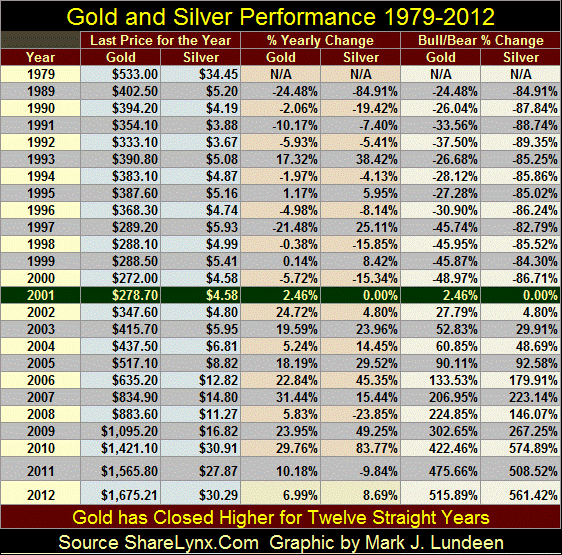
Here is an interesting fact; at the end of this December gold only has to close above $1675.21 (its last closing price for 2012), for it to see thirteen consecutive up years. Assuming a current gold price of $1320, gold has only to advance about 27% at the end of December for 2013 to be gold’s thirteenth up year in the table above. With the better part of four months left in 2013 gold could easily accomplish this. But even if 2013 proves to be the first down year for gold since 2001, this would be no reason to become bearish on gold. After all, in the first twelve years of the Dow Jones’ 1982-2000 bull market it saw three down years: 1984, 1990 & 1992 without Wall Street becoming bearish on the stock market. Predictability, Wall Street has been bearish on gold and silver since Alan Greenspan became Chairman of the fed in the late 1980s, so they would probably make a big deal of gold seeing 2013 as a down year, but we should not.
Gold’s long term BEV chart above is useful, but to accurately judge the gold’s market’s volatility since its July 1999 bottom, it's best to begin gold’s BEV series at its 1999 bear market low. This will transform the -69% bear market bottom seen in the 1969-2013 BEV chart above into a BEV Zero below. Because of the mathematics used, the first data point in every BEV series is always a BEV Zero. Using July 1999 as a starting point provides a more useful view of our current gold market as gold’s old high from 1980 was a long time ago and occurred in a different world.
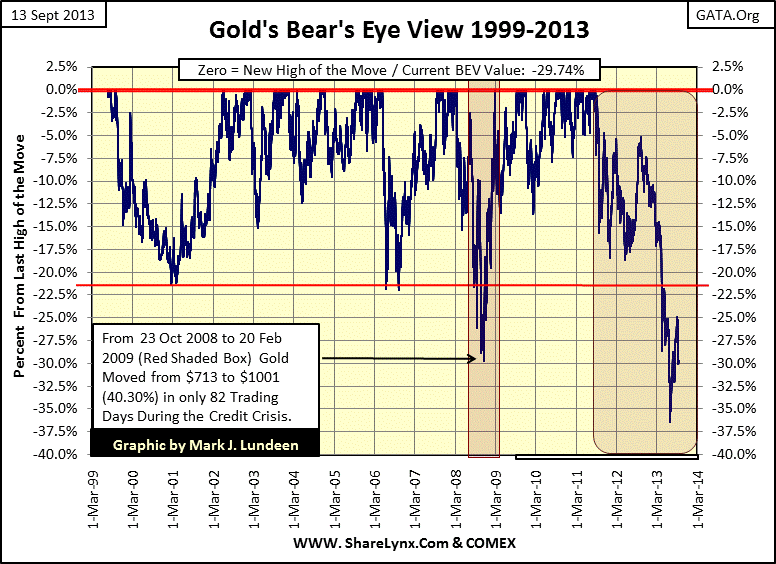
Not obvious in this BEV chart was that soon after July 1999’s low of $253, gold began increasing to $324.50 just two months later. For your information, this $71 increase in the price of gold resulted from the first derivative blow up on Wall Street, nine years before the US mortgage derivatives disaster of 2008. What happened between July and September 1999 is best describe by Eddie George who at the time was a Governor of the Bank of England and a director of the Bank of International Settlements (BIS).
“We looked into the abyss if the gold price rose further. A further rise would have taken down one or several trading houses, which might have taken down all the rest in their wake. Therefore at any price, at any cost, the central banks had to quell the gold price, manage it. It was very difficult to get the gold price under control but we have now succeeded. The U.S. Fed was very active in getting the gold price down. So was the U.K.” http://www.gata.org/node/4258
(Eddie George, Governor of the Bank of England and a director of the BIS (Comments on the Rising Spike in Gold Price in August 1999)
Below is the price action in the gold market just prior to the First Washington Gold Agreement of September 1999. The “policy makers” all flew to Washington where they actually worked over the weekend with Alan Greenspan to save the world from free market prices in the gold market. How often do these guys work over the weekend? Just every time these guys find themselves looking “into the abyss"! Don’t ask me how, but they knew the price of gold was going to rise beginning on Monday, 27 September 1999, and what that increase in the price of gold would have done to their global banking system. This was covered by the media at the time, though few people remember this anymore. However it’s important to remember that after decades of unchecked monetary inflation by central banks, the Mortgage debacle of 2008 wasn’t the first time central bankers had to work over the weekend to save the world from the predictable consequences of their unsound monetary and credit policies.
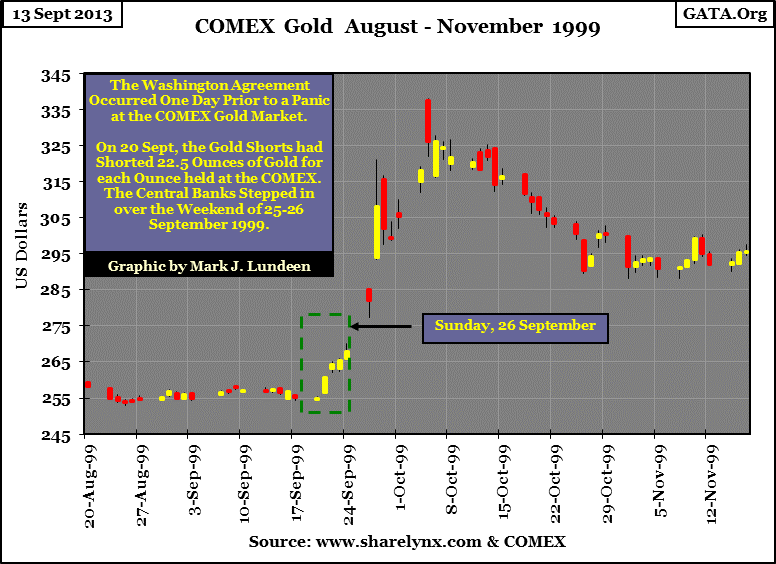
And as seen in the above BEV chart for 1999 to 2013, from September 1999 until February 2001, the central banks were very successful in managing the price of gold back down to its lows of July 1999. But after gold’s February 2001 low ($255.10), the “policy makers” management in the price of gold is best described as a twelve year managed retreat in the face of rising demand for investment gold by investors and yes even fellow central bankers! The problem the western central banks have with containing the price of gold since July 1999 stems from these same central banks’ policy of inflating their money supplies toward infinity in a futile attempt at Keynesian-stability in the stock and debt markets.
In the past decade, bear markets in financial assets have been outlawed. To enforce the current regime of perpetual bull markets in stocks and bonds, the Federal Reserve and other western central banks print vast sums of money to purchase stocks and bonds at prices the free market refuses to pay. This is what Doctor Bernanke’s Quantitative Easings are all about. But the Doctor’s inflationary solution to lower asset prices is only making the structural problem of too much debt burden on the economy worse. In a world where the money supply of every nation is expanding towards infinity, exchanging paper money for gold and silver makes sense in all twenty four time zones.
So, the 1999-2013 Bear’s Eye View (BEV) chart above is very positive as it shows how strong the rise in the price of gold has been for the past fourteen years. We see many new BEV Zeros and orderly price corrections, none which have seen the extreme declines of the 1970s bull market in gold. Gold may not have seen a new BEV Zero since August 2011 (two years); still time wise this correction has been a briefer correction than we see from September 1999 to May 2002. Keep in mind from gold’s all-time high in December 1974, the gold market didn’t see another BEV Zero (new all-time high) until July 1978; 3.5 years. In a bull market, patience is a virtue – damn it!
Here’s silver’s BEV chart from 1969 to the present. Silver is a completely different animal than gold. From 1969 to January 1980, gold actually saw many more BEV Zeros than did silver, and the gaps between silver’s new all-time highs took years to complete. But if you take a moment and review my dollar charts for gold and silver above (this article’s Charts #3&4), in their bull and bear market tables we see that from 1969 to 1980 the price of silver actually outperformed gold by a very large margin. Also note that since 2001, silver again has again outperformed gold as an investment, even though silver has yet to exceed its last all-time high seen in January 1980! How is this possible?
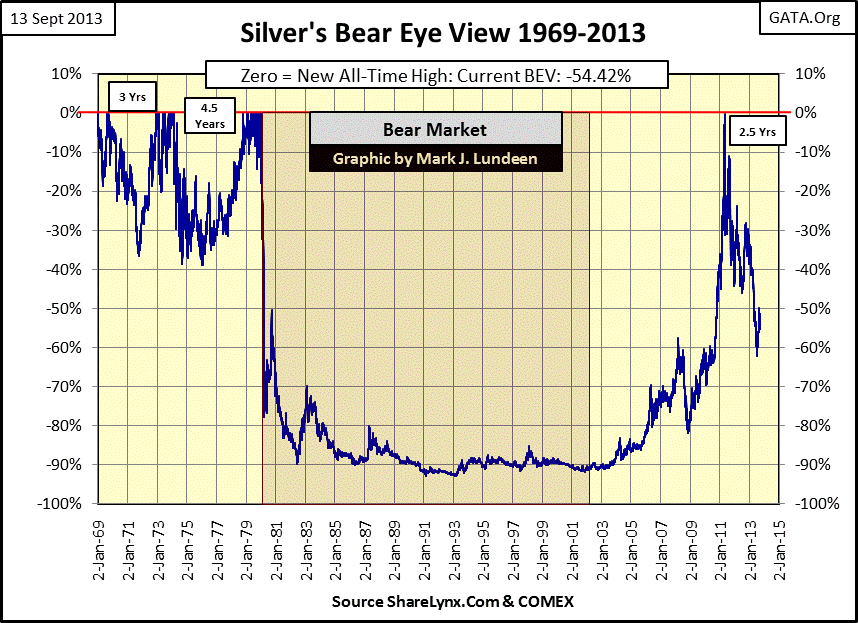
Silver’s 1980-2001 bear market saw a 90% plus decline from its last 1980 bull market high. For silver to dig itself out of that hole from 2001 to April 2011, it took more price appreciation than gold saw when the yellow metal increased $1000 above its high of 1980 in August 2011.
Since silver’s near new all-time high in April 2011, silver has declined 60% in price. I can’t deny it; this is a huge decline. However silver, being the volatility beast that it is, could work itself out of this hole in a few months. After all, this entire 60% decline was not the result of natural market forces seeking a free market price for silver, but a contrived price decline by our political and economic elite, people who have no love for free-market prices in the commodity or financial markets. The silver and gold markets are rigged in favor of lower prices to mask the effects of the massive increases in monetary inflation flowing from the Federal Reserve and the global central banking system. When this rig in the old monetary metals comes apart, the rise in the price of silver and gold could become violent. This is going to happen, just don’t ask me when. So if you are thinking of buying some gold and silver, now is not a bad time to do it.
Like gold, it’s best studying our silver bull market from its bear market bottom. As was the case in the 1970s, silver has seen fewer BEV Zeros than did gold, and since 2001 silver’s corrections have been deeper than gold’s. Note also that gaps between new highs of the move for silver have been more prolonged than has been the case for gold’s corrections.
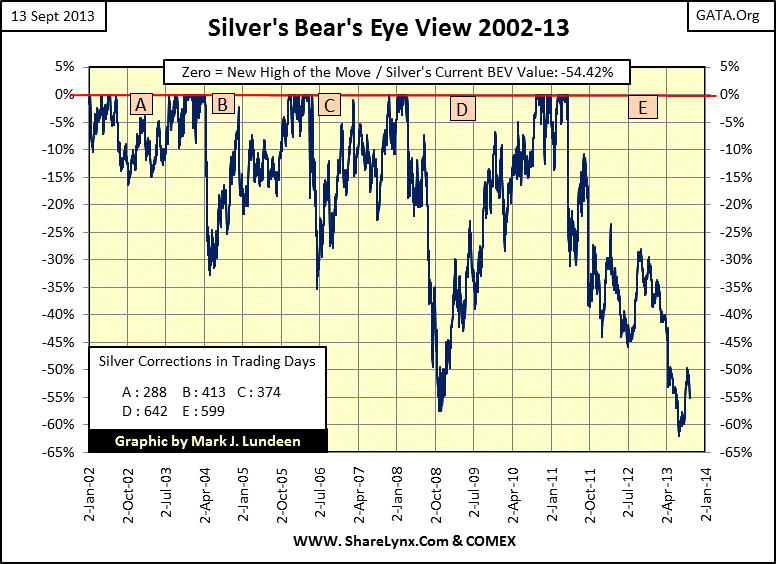
Does this change anything I’ve said about the potential appreciation in the price of silver? I don’t believe so. Look at the March-October 2008 correction. During the mortgage crisis the “policy makers” crashed the price of silver by 57%. In dollar terms, silver fell from $20.69 to $8.79 in just six months; ouch! What silver did in the next 2.5 years is best seen in its price chart (Chart #4) above, where the price of silver increased from $8.79 in October 2008 to $48.59 in April 2011. A silver price that was twice the price silver was at in March 2008. A 452% advance in the price of silver in only two and a half years is damn impressive!
Can silver do this again? With the above ground supply of silver becoming scarcer and the supply of dollars, yen, won, yuan, euro and pounds becoming ever larger; I believe it’s a sure thing that the dollar price of silver will finally rise far above its January 1980 high in the next year or two. Possibly silver will find itself at prices that will shock the world. But like me, you will just have to wait to see what actually happens, and I expect the road to higher prices in the old monetary metals and their mining shares will have a few bumps along the way.


