Rosen Market Timing


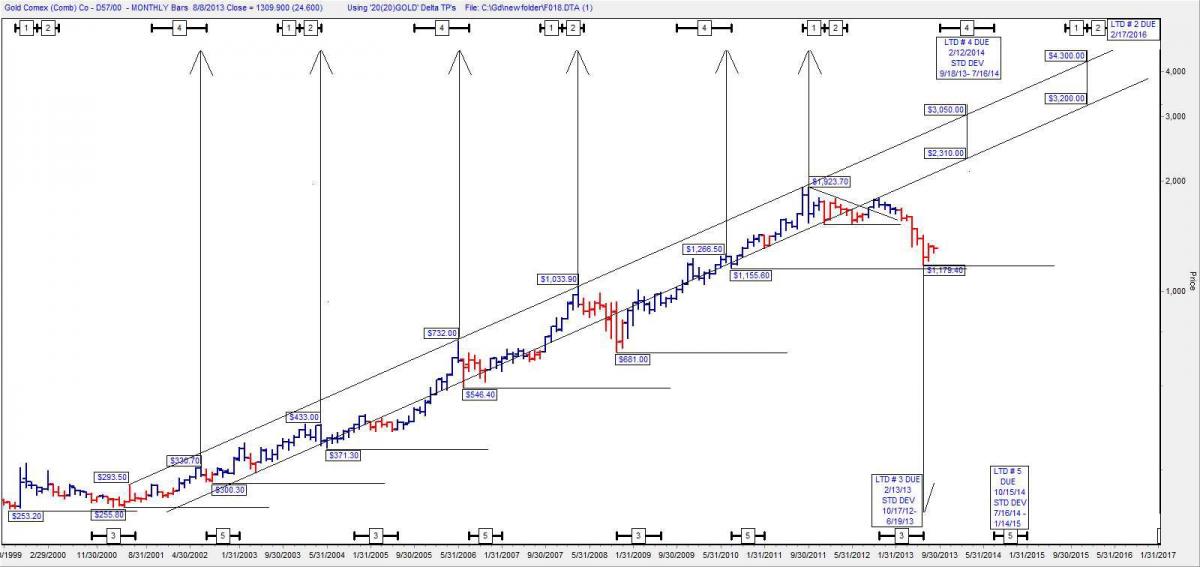
If there was such a thing as a “Holy Grail” of gold charts this chart would have to be it. Gold peaked at every # 4 high and every grouping of # 1 high and # 2 high. Every gold peak was either at the upper trend line or above the lower trend line. Every low took place at # 3 low and # 5 low.
All the lows were higher lows.
All the highs were higher highs.
The next high is due to arrive at # 4 high. I would think that the odds are overwhelming that there will be a new high at # 4 high. The odds should be overwhelming that the peak at # 4 high will occur between the lower trend line and the upper trend line. The # 4 high is due to arrive February 12, 2014 (2/12/2014).
GOLD MONTHLY LOGARITHMIC
The bear market that took place between 1966 and 1974 was minor wave 4. The current bear market is Major Wave IV. The current leg E down should be a total disaster. The S & P 500 and the DJIA should lose 66% from their respective all-time highs.
Elliott Wave - The Rule Of Alternation
Minor wave 4 alternated with minor wave 2. Major Wave IV is alternating with Major Wave II
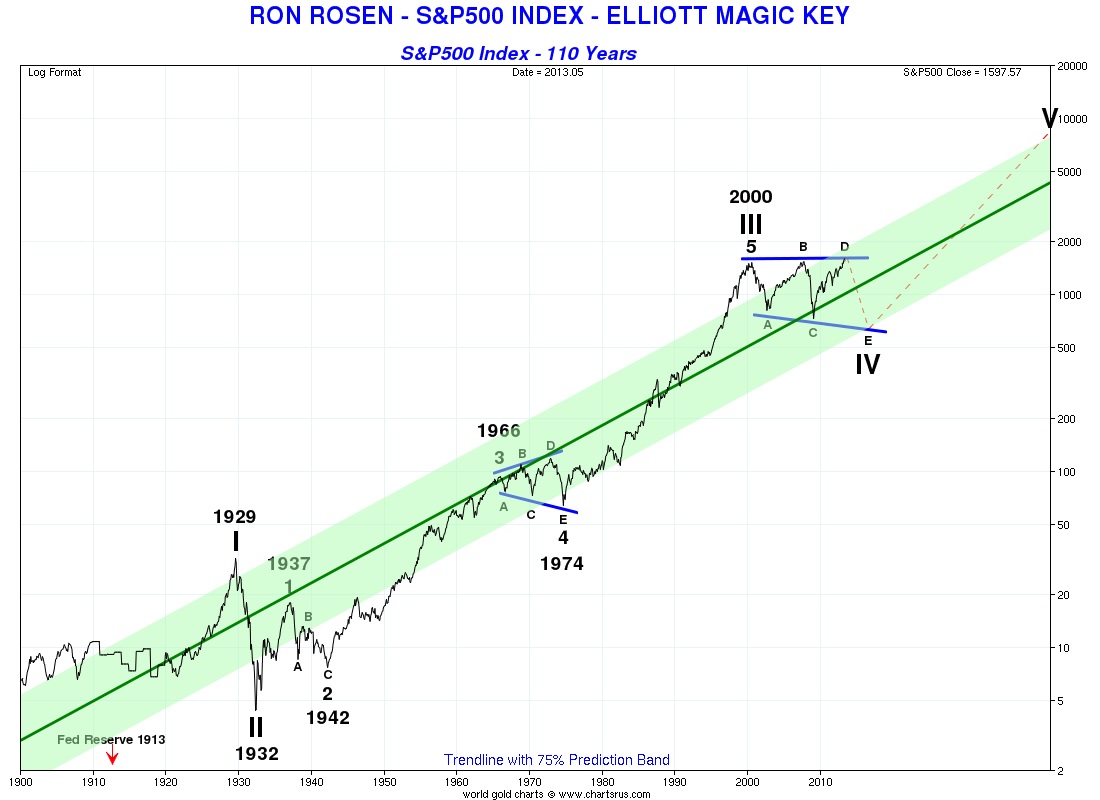
A 66% collapse will bring the S&P500 back to the approximate 550 level. This will be a return to the 1995 level which was pre the tech mania.
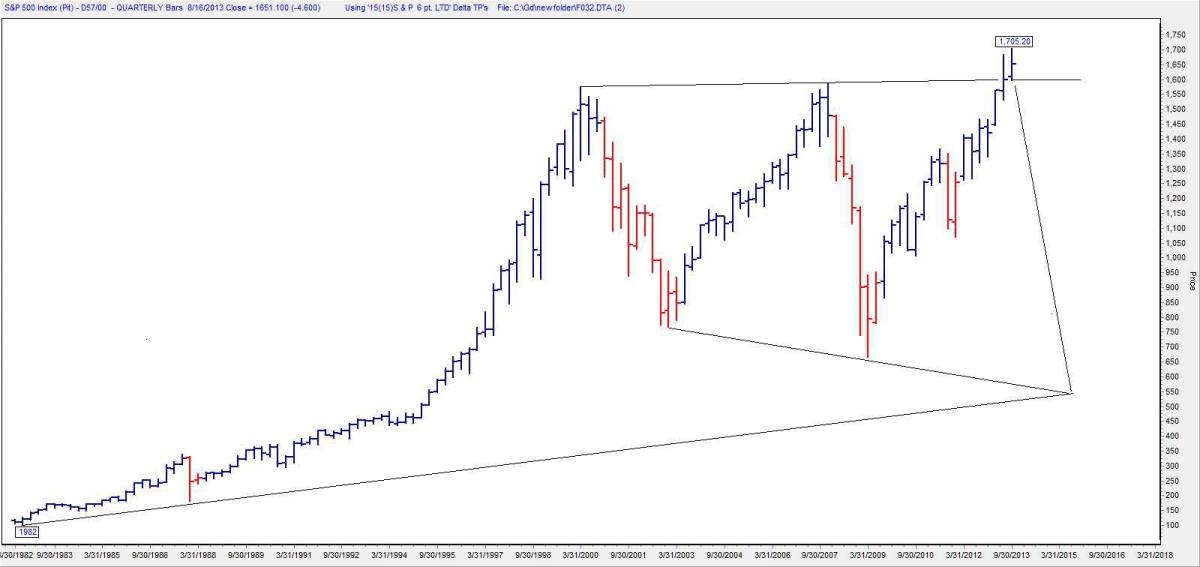
S&P500 QUARTERLY
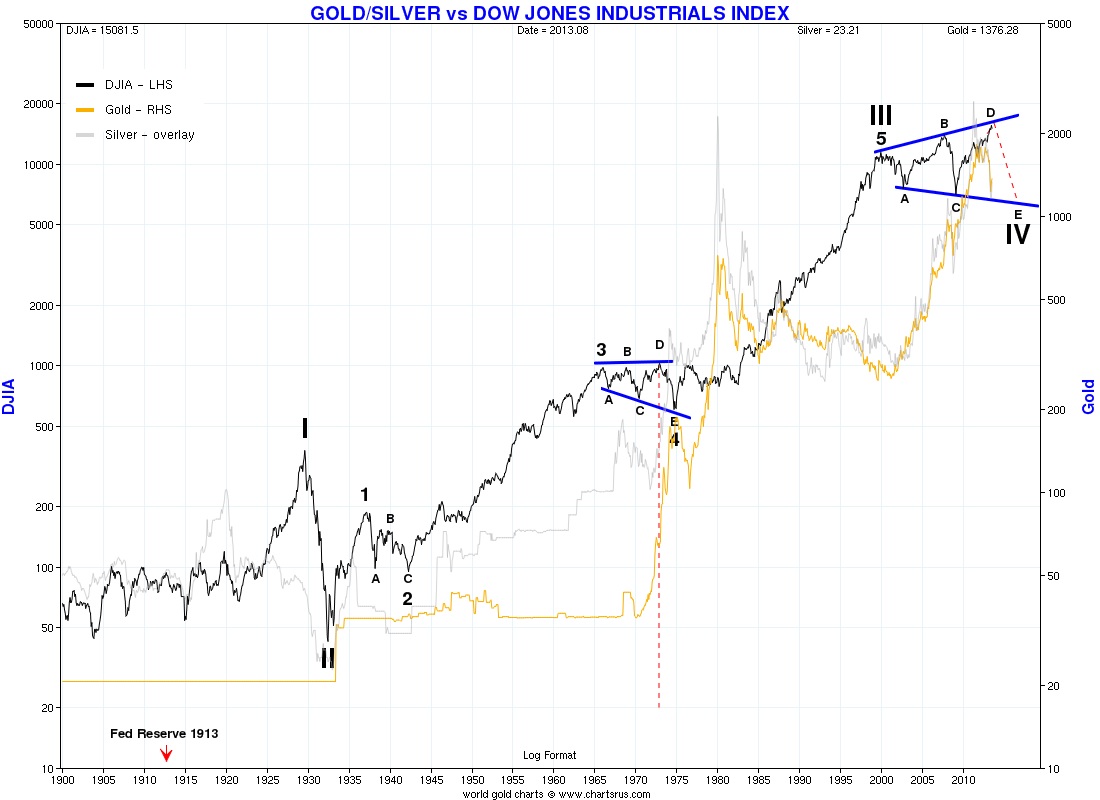
Like clockwork gold and silver are repeating their timing pattern from the past. As leg E in the S&P500 and the DJIA begins a collapse, gold and silver begin a major rise.
More from Gold-Eagle


