Silver Price Breaks Lower…Gold Price And PM Stocks Set To Plunge


 In the latest Gold and Silver Market updates, posted last weekend, the view was expressed that an intermediate top was forming gold and silver, not a bull Flag as some were suggesting. Furthermore, the latest COT data not only confirms this view, but suggests that a severe drop is imminent. Moreover, it already started in silver on Friday. Fortunately we exited most of our long positions in the sector over the past two weeks, many at a handsome profit…having spotted the danger.
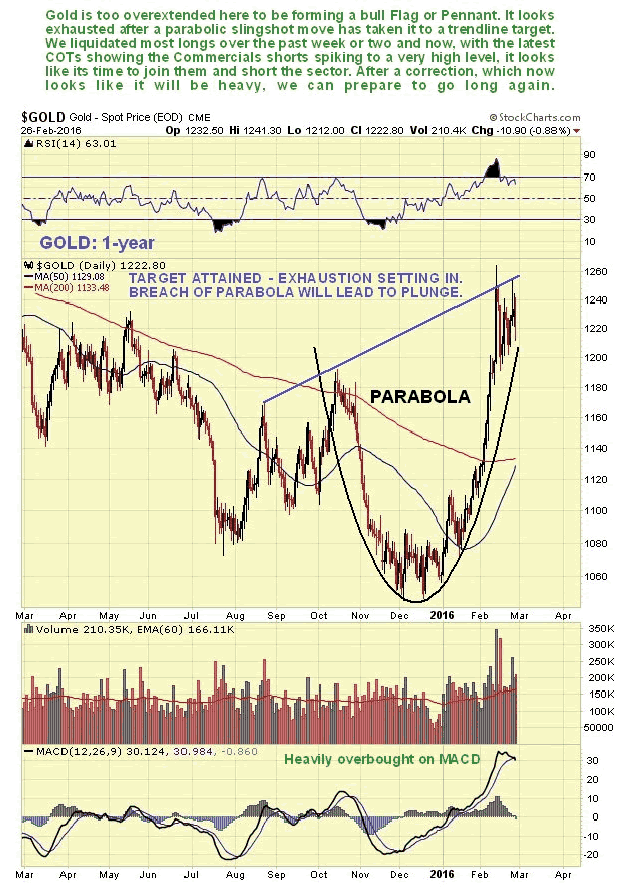
The latest 1-year chart for gold is - or should be - alarming for those still long the sector. It shows gold churning having hit a target after a parabolic slingshot move that resulted in it becoming heavily overbought. Now it is vulnerable to a reaction which the latest COTs suggest will be heavy. Breakdown from the parabola will likely lead to a dramatic plunge.
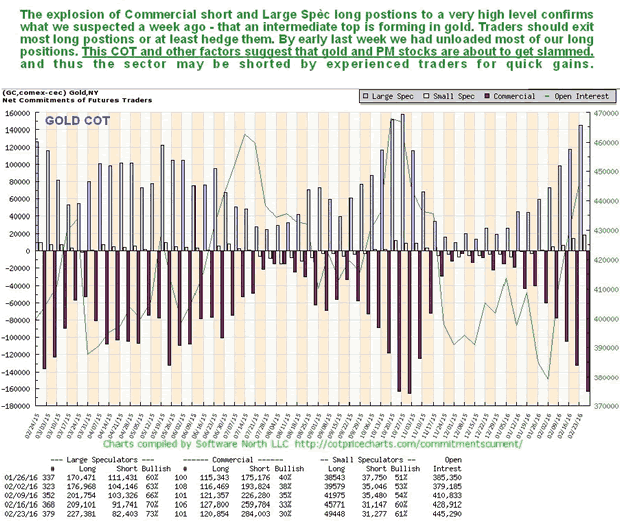
The latest gold COT chart, which may be directly compared to the 1-year gold chart above, because it also goes back a year, shows that Commercial short and Large Spec long positions exploded higher last week, the culmination of a multi-week exponential ramp. As the Commercials are collectively always right and the Large Specs wrong, this means trouble. This is characteristic of an important top, and gold is now expected to plunge, probably immediately.
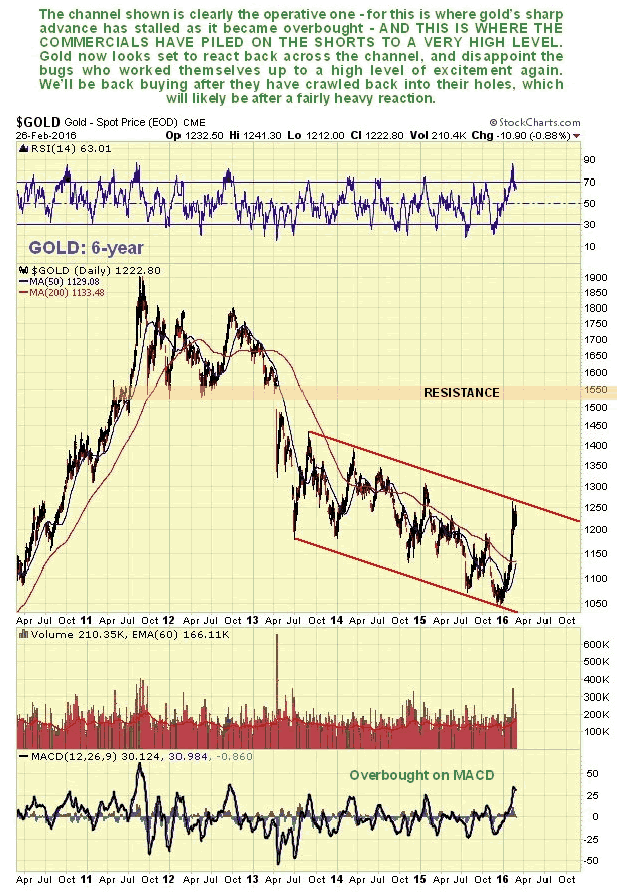
The long-term 6-year chart provides additional clues regarding why gold's sharp advance halted when it did - it had arrived at the upper boundary of the broad downtrend channel shown.
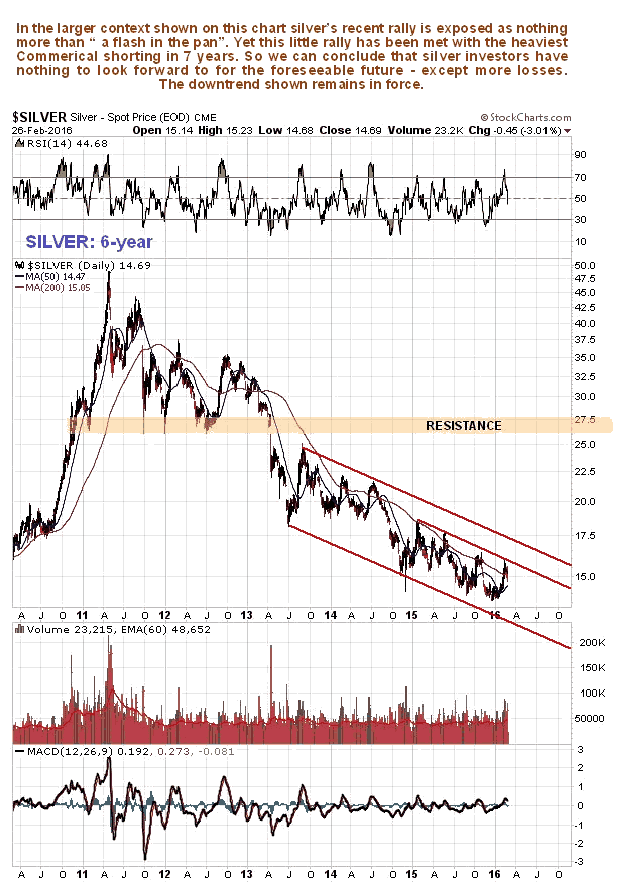
Turning to silver, the picture is considerably weaker, and is in fact dismal, although longer-term this should not be a cause for depression, as silver is normally weak compared to gold at this stage of the cycle. On its 1-year chart we can see that the recent rally was weak compared to the rally in gold - it did not even manage to rise much above its 200-day moving average, which did not turn up, and it failed to break out of the downtrend channel shown. Now it is breaking lower again, and latest COTs, which we will come to in a moment suggest that the reaction now starting will be severe, and take it to the lower boundary of the channel as a minimum downside objective.
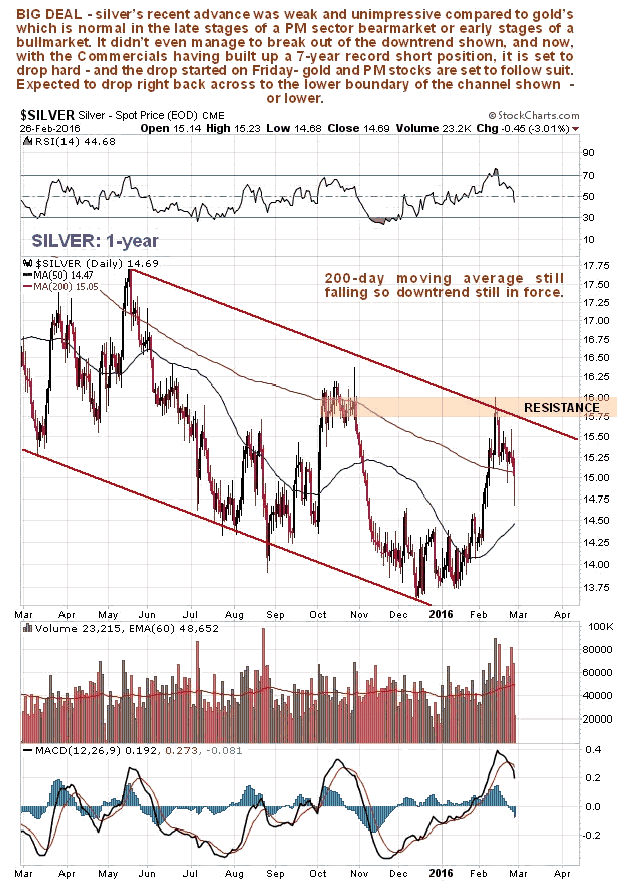
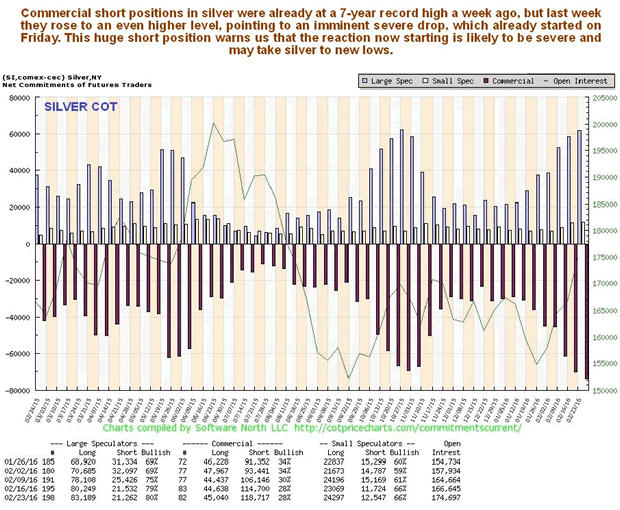
The latest silver COTs are simply frightful, with the Commercials having built up a 7-year record short position. This was already the case last week, and this week it's even worse. These COTs suggest that silver is about to take a severe beating.
The long-term 6-year chart reveals that silver's latest rally was in the end nothing more than "a flash in the pan" within its ongoing long-term downtrend, and the latest COTs point to new lows for silver soon.
Trying to unearth a fundamental explanation or reasons for what we are observing here is, as usual, a waste of time. Normally, by the time you find out, it's too late to do anything about it. Asked to speculate about possible explanations two things come to mind - the possible emergence soon of a coordinated global QE barrage that results in a Happy Days are here again mentality, as systemic stress eases for a while and the stock market rallies on the prospect of improved liquidity, which is what we have already observed as likely in yesterday's update on the site Broad Market update - Belay that Shorting Plan, and a realization by the "mad as hatters" Neocons, who are possessed by a drive to overpower Russia then China and take over the world, that starting a thermonuclear exchange with Russia over Syria is perhaps not such a good idea, since the Nuclear Winter that might result would probably affect them too. There is a tentative ceasefire in Syria at present, and hopefully the tensions will ease somewhat, which would of course be a negative for gold and silver.
********
Courtesy of Courtesy of http://www.clivemaund.com

Clive P. Maund’s interest in markets started when, as an aimless youth searching for direction in his mid-20’s, he inherited some money. Unfortunately it was not enough to live a utopian lifestyle as a playboy or retire very young. Therefore on the advice of his brother, he bought a load of British Petroleum stock, which promptly went up 20% in the space of a few weeks. Clive sold them at the top…which really fired his imagination. The prospect of being able to buy securities and sell them later at a higher price, and make money for doing little or no work was most attractive – and so the quest began, especially as he had been further stoked up by watching from the sidelines with a mixture of fascination and envy as fortunes were made in the roaring gold and silver bull market of the late 70’s.
Clive furthered his education in Technical Analysis or charting by ordering various good books from the US and by applying what he learned at work on an everyday basis. He also obtained the UK Society of Technical Analysts’ Diploma.
The years following 2005 saw the boom phase of the Gold and Silver bull market, until they peaked in late 2011. While there is ongoing debate about whether that was the final high, it is not believed to be because of the continuing global debasement of fiat currency. The bear market since 2011 is viewed as being very similar to the 2-year reaction in the mid-70’s, which was preceded by a powerful advance and was followed by a gigantic parabolic price ramp. Moreover, Precious Metals should come back into their own when the various asset bubbles elsewhere burst, which looks set to happen anytime soon.
Visit Clive at his website: CliveMaund.com
More from Gold-Eagle


