Snippets Of All Markets


Has the DJIA topped out? Is the attack on gold and silver over? Will it be a V or an L or . . .? What is driving the COVID weekly cycle? At the moment these and others are still open-ended questions, to be answered in the course of time. But for some of them there may be early indications of what the answers could be.
The progress of COVID-19 in the US is convoluted in many respects. Direct effects on the health of Americans have see-sawed, complete with the strange short term cycles that have been present right from the beginning; in both the number of new cases and the number of daily deaths. The ratio of cases to deaths have changed as time passed, to display a vast improvement in treating COVID patients, as shown by the two charts, with the daily new cases followed by daily deaths.
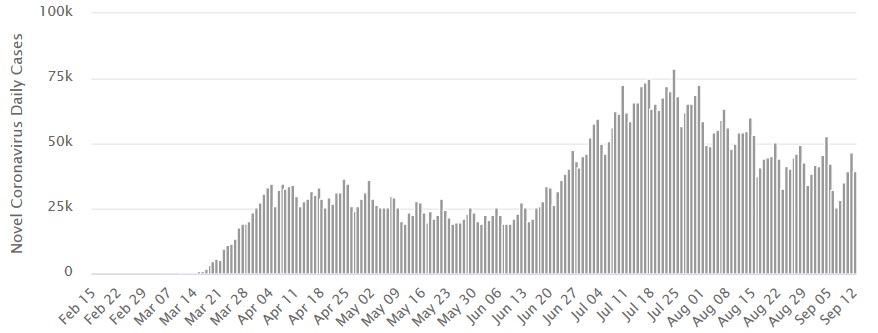
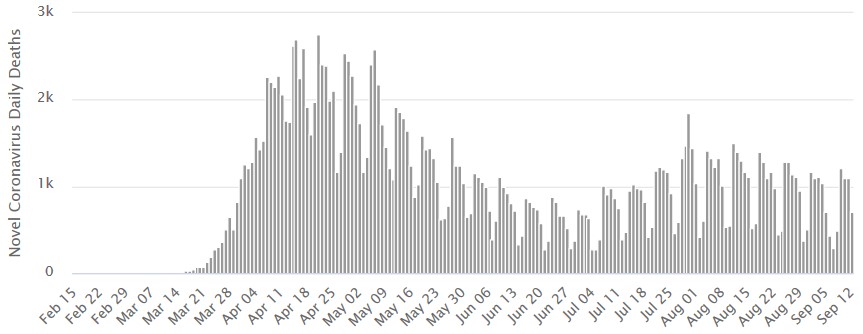
It is interesting that the peak number of new cases is on 24 July, with a subsequent spike high in the number of daily deaths 6 days later on July 30. Would it be equal to the average number of days from diagnosis to death?
There is also no definite explanation for the accurate weekly cycle in new infections and deaths, which is also evident in the global statistics. It surely cannot be due to the diagnosis of COVID cases and treatment of patients in hospitals. More likely as an explanation is the weekly cycle in people’s life style between work and weekend activities coupled to the average time lapse between diagnosis and death.
Fridays are the days that consistently display the highest number of new cases per week in the US, with Tuesdays and Wednesdays when the number of daily deaths peak. This tempts one to believe that more people get infected at work, with a peak in the new infections on Friday. However, if someone who gets infected only shows symptoms after say 5 or 6 days, then the peak of new infections on Friday are due to people’s exposure to the virus on weekends. Whatever the explanation is, the cycle is clearly linked to the days of the week and the cycle differs between new infections and later deaths.
There has long – since late March – been little doubt among neutral observers of Wall Street that the PPT again had been called up to resurrect the stock market – as was done before when Mnuchin met with some major Bank CEO’s late on the day before Christmas in 2018. There is also no doubt among them that the objective is to substantiate Trump’s claim for a booming economy under his Administration. The rally that had started in 2018 began with sustained high volume after Christmas until the Bears realised that there was a real change in the trend (Not shown on the chart below). Volumes then declined while the rally continued until late in March.
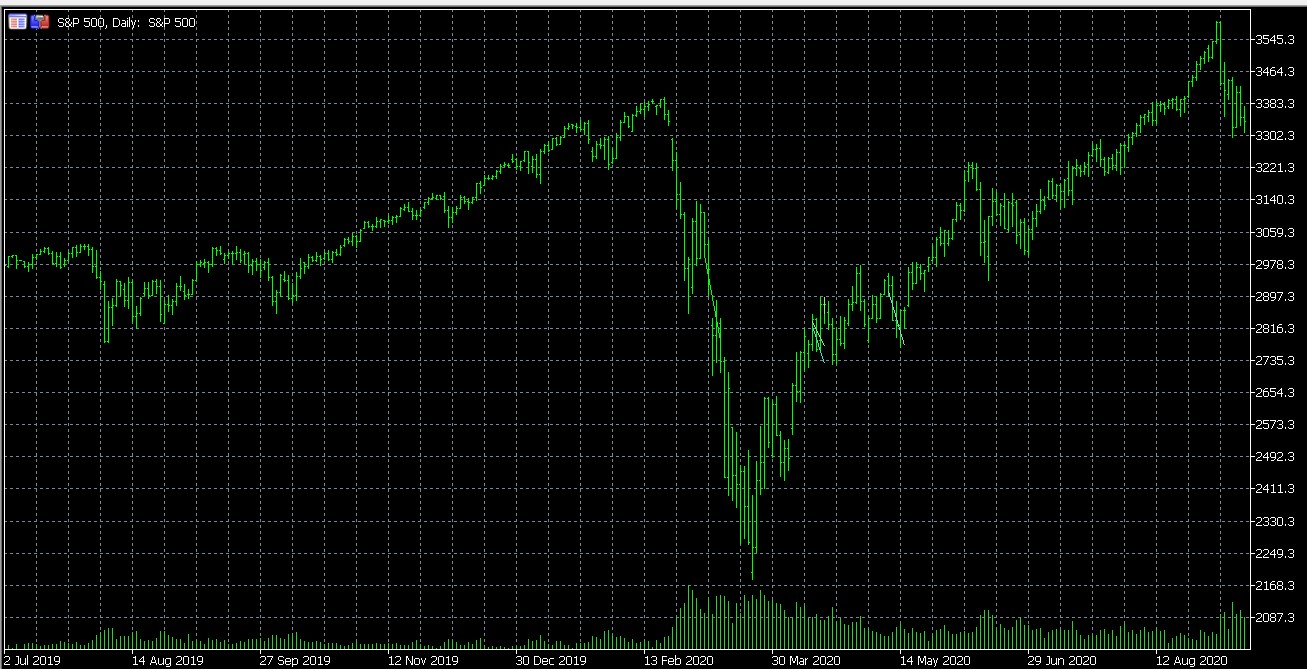
The low volumes lasted until the market peaked on February 20 and started to fall. As in December 2018, the large jump in volume shows the market was supported on the way down and after 23 March the buyers were absorbing the selling and the trend changed again. Sellers soon realised the tide had turned against them – it was no longer necessary to flee the stock market – and the volume declined, but not as much as after the December 2018 recovery.
In early June the volume briefly jumped and the market also corrected a little, but it soon resumed the bull trend. Now it is again reacting to an increase in volume as a sign that increased selling is being met by increased buying. The question is how much of this activity in the stock market is driven purely by financial considerations and to what extend is the selling influenced by political motives?
So far the ongoing campaign to discredit and Trump and hopefully evict him from the White House has not had much success. The political opposition has to be quite desperate by now with less than 8 weeks to go until the November election ?. They are certain to realise that Biden has little chance to win in November and his only chance therefore is to cause Trump to lose it. A collapse of the stock market to reveal the true state of the economy is perhaps a way to accomplish this objective. Is it perhaps Soros en other large investors who are the consistent and concerted sellers trying to kick-start a new bear market?
V or L? Proponents of the post March rally on Wall Street justify its progress to new highs for the Nasdaq and S&P500 on expectations for a V-shaped recovery in the economy. Others expect an L-shaped non-recovery; that the economy will be slow to recover and sluggish for perhaps a number of years. One factor that can make a difference in the recovery is how the Trade War with China develops from now on.
If a solution to the dependence of the US on imports from China is to develop over a period of time, with the US manufacturing base being rebuilt slowly to prevent any undesirable economic and financial shocks, the recovery is more likely to be L-shaped. COVID has added a massive load of debt to the country, at all levels from Federal to households. This has made the country very vulnerable to any increase in interest rates. A slow paced change to what used to be the relations with China, replacing imports with local production, should not trigger too sudden high inflation.
On the other hand, Trump might decide to continue the Trade War to stimulate an increase in patriotism and national unity, or at least attempt to achieve the latter. That would require firm action to re-establish the US manufacturing base as soon as possible – a course of action that will be very hungry for capital at a time when debt is already sky-high and free capital not readily available for the corporations that will have to build the required manufacturing infrastructure.
Pushing too hard to get foreign based factories relocated to the US, while offering the advantages to employ new technologies, more likely than not will result in high inflation and an extended L-shaped economy, still with a sustained down trend for many years. And add the risk of run-away inflation as US consumer prices increase across the board to make local production profitable. It could turn into a repeat of the 1970s, when sustained higher interest changed the nature of the economy.
As the two charts below show, the waterfall attacks to intervene in the markets for gold and silver still continue. The gold chart shows the gamesmanship going on in the battle between the Cabal and the gold bulls. The latter has learnt long ago that there are times during the day when it is profitable to buy the dips orchestrated by the short sellers. The Cartel has countered by often deploying a two pronged attack – an initial limited sell of and then a rebound to entice eager buyers to start buying while the price is still quite low.
Then a second and more severe attack knock out the new stops, which then causes the buyers to sit back and watch. Then the price can be allowed to recover without excessive buying taking place.

As usual, the price of silver displays more near term volatility than gold, but the silver price is also not immune to waterfall attacks. Given that both the silver and gold OI’s have shown recent increases, the Cartel is slowly losing the fight for low prices. This places them before a difficult choice, as discussed later.
Euro–Dollar
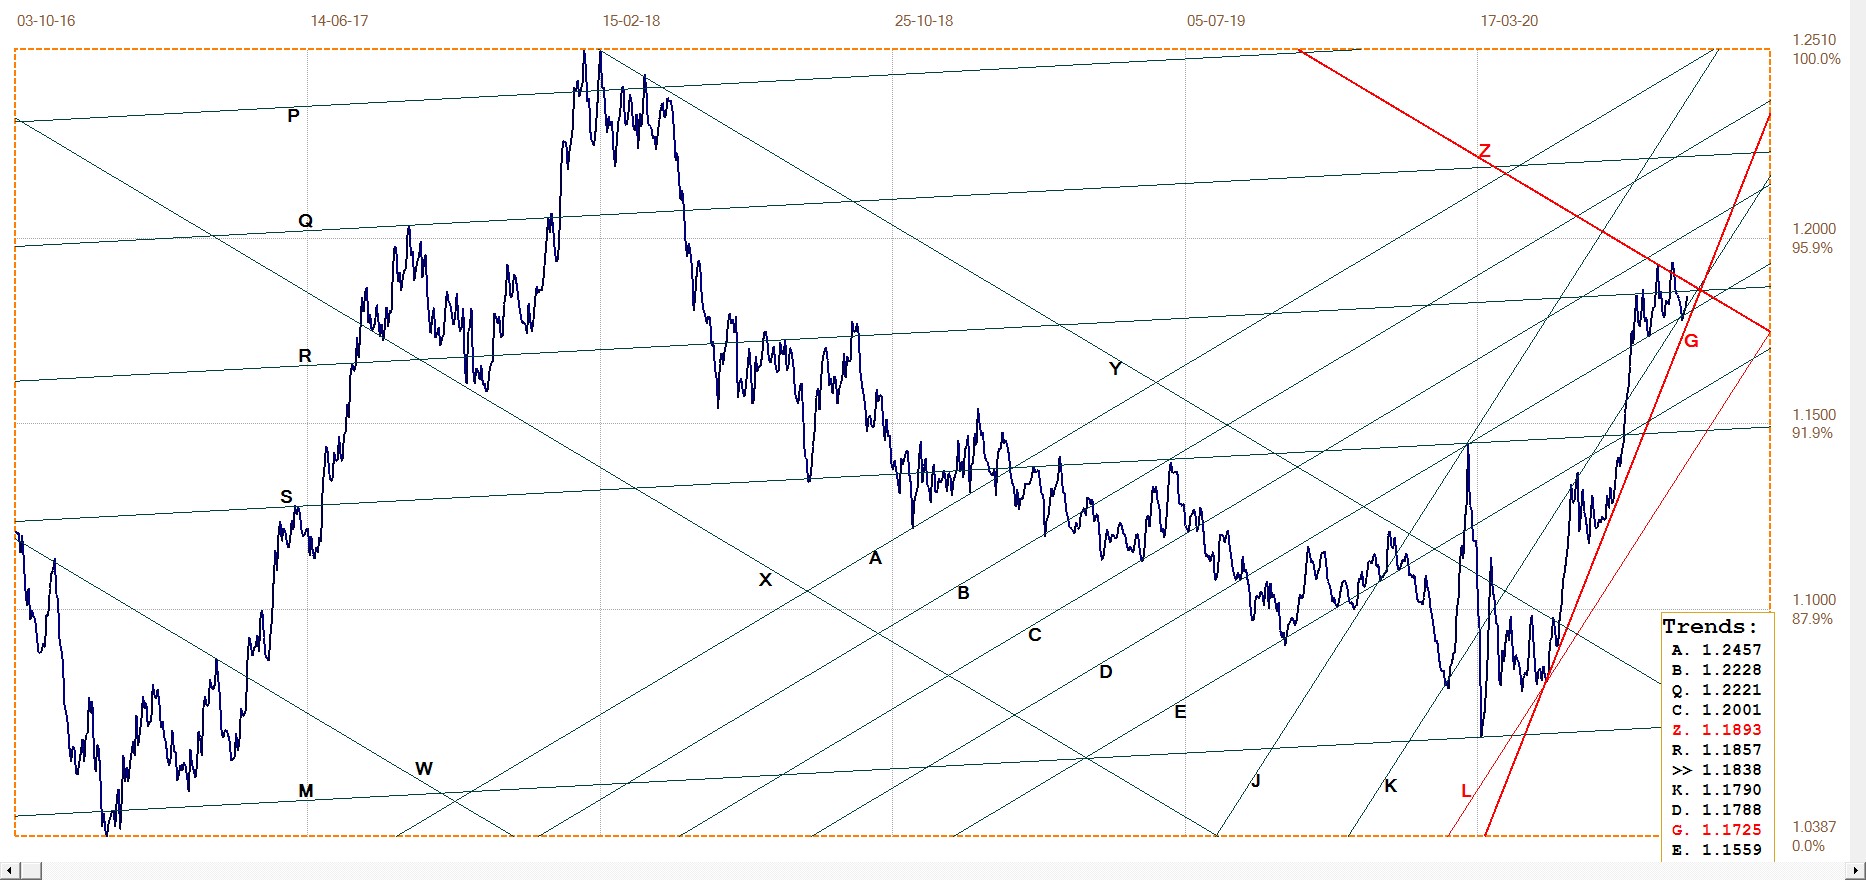
Euro–dollar, last = $1.1845 (www.investing.com)
The euro rally has held above the steep gradient of line G ($1.1725) since the rally took off in mid May at $1.08. After rebounding clear off line G halfway through the rally, the euro built up a cushion for the time when the dollar would strengthen again. This has now happened as the euro reached line Z, the top of channel XYZ with the Fibonacci ratio. As stated earlier, it meant that line Z would be significant resistance, as it has turned out to be.
The euro made a near double top, the second of which marginally and briefly broke above line Z. Now the euro has used up almost all of the cushion above line G that it acquired earlier and will soon have to reveal whether it will rebound higher or break sideways and lower below line G. So far, it is holding to channel JK ($1.1790) – which might hold to delay a test of line G until after a break above line Z and thereby set the euro free to rally further.
With all the talk of the soon $80 trillion of current US debt which ought to prove not possible to repay, many commentators expect the dollar to lose value – to perhaps even do so consistently. Line G could play the role of the canary in the mine, with a break below line G as a signal that the dollar still has intrinsic strength. On the other hand, if line G is to hold firm and compels a break above line Z to again open up a cushion above line G . . . Not that the euro is in such great shape itself.
DJIA Daily close
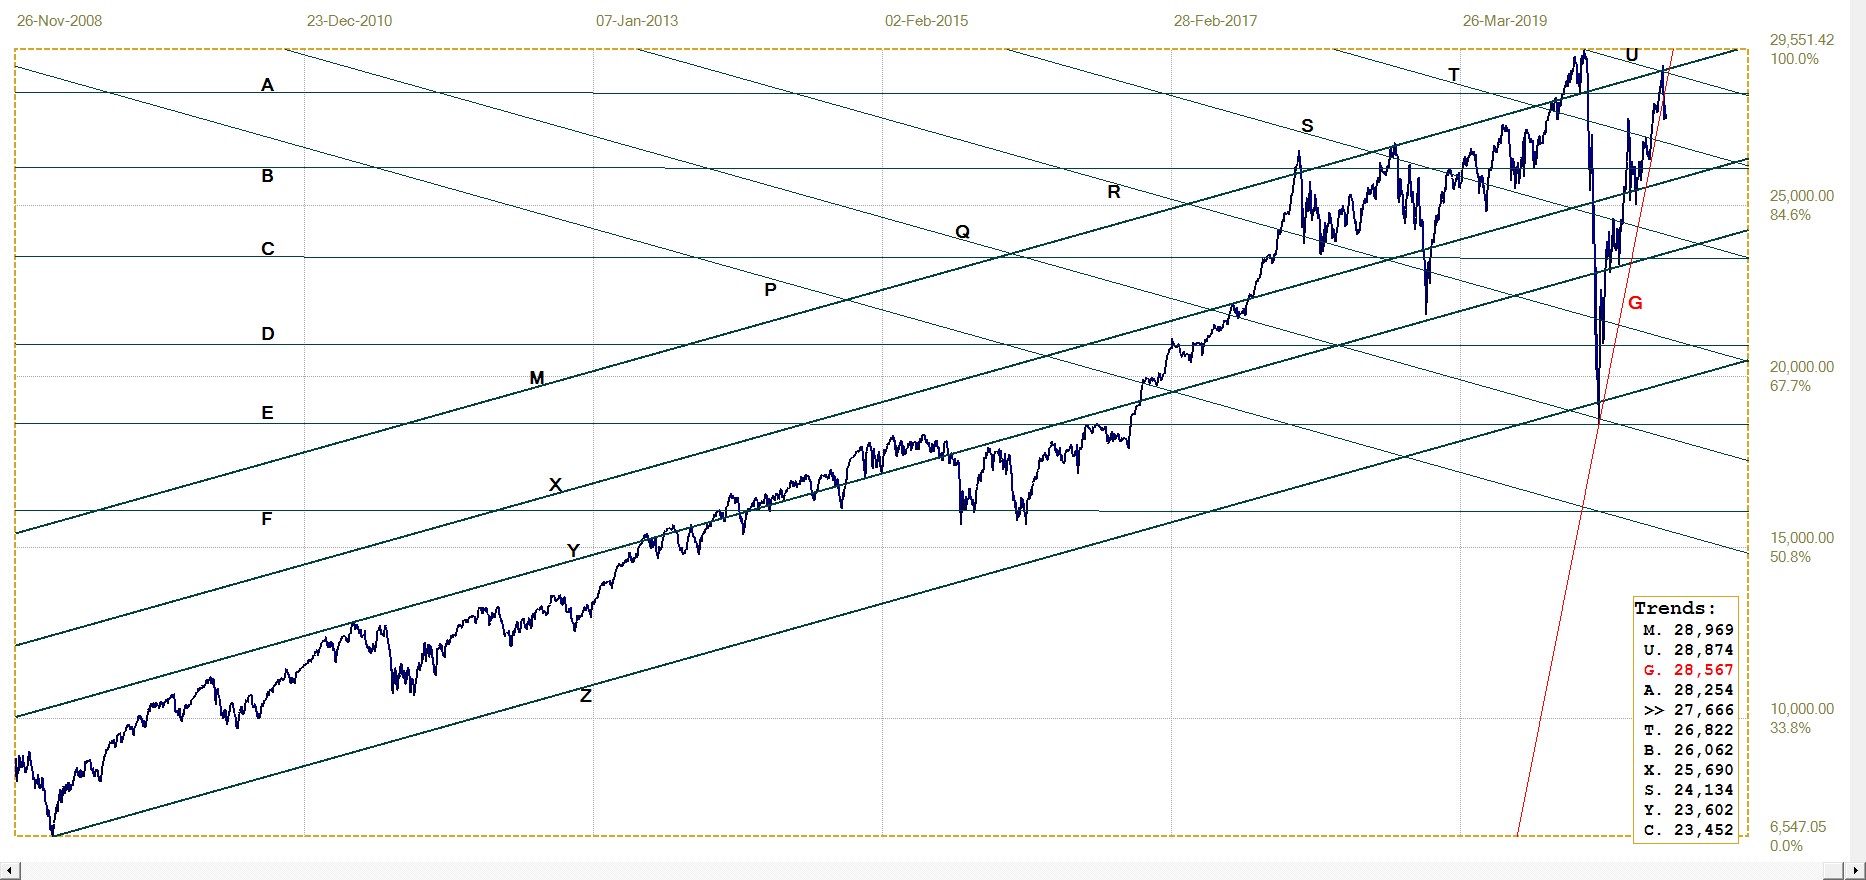
DJIA, last = 27665.64 (money.cnn.com)
The post March 23rd bull market in die Dow 30 stocks is nothing if not consistent and persistent. It also held above e steep gradient since starting the rally, but now, unlike the euro, it has broken bellow line G (28 567). The DJIA came quite close to set a new all time high, as die S&P500 and Nasdaq have quite come time ago done. However, the resistance along lines M (28969) and U (28 874) held firm and caused the DJIA to reverse trend.
The break back below line A is a warning that the new trend could last a while and extend lower for some distance. With still almost 8 weeks to go before the election, there is ample time to put Wall Street under bear pressure should that be in the minds of large fund managers and investors with a preference for Biden as the next president. Recent daily volumes in the Dow 30 stocks have been mostly above the 3 month average, which shows that selling has intensified. Whether this really is part of a political strategy or only because of concerns about the stellar value of the two main market indices is of course mere guesswork.
Gold London PM fix – Dollars
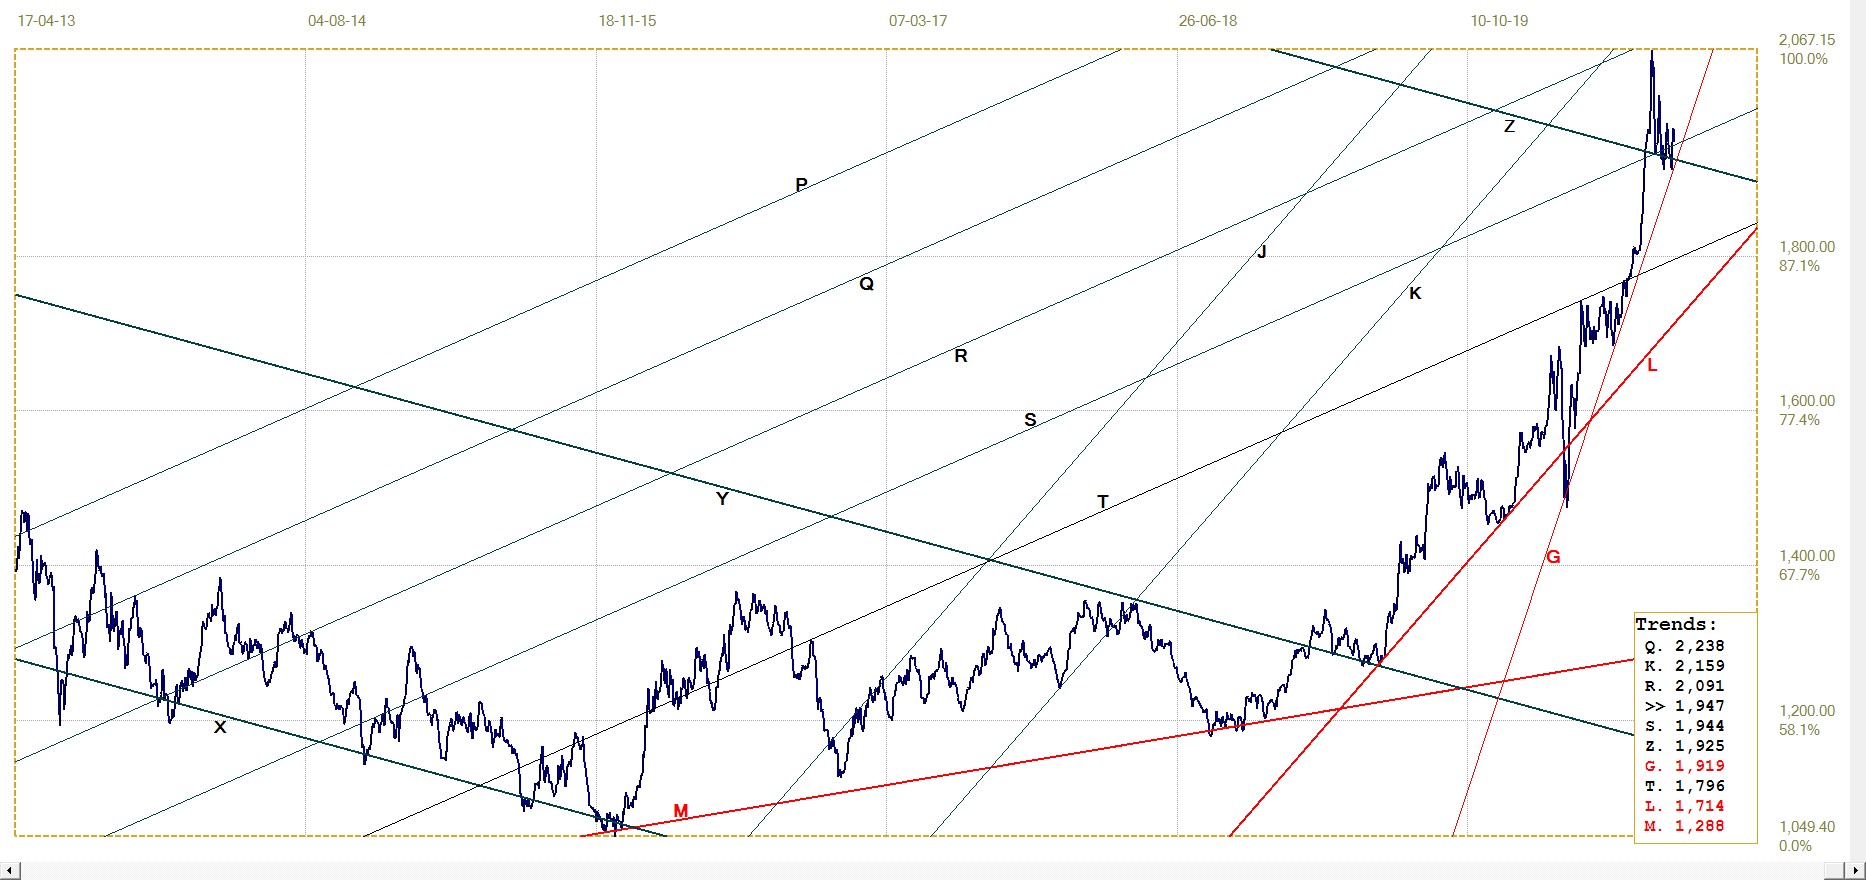
Gold price – London PM fix, last = $1947,40 (www.kitco.com)
A new line G as the reference steep gradient – one step shallower than the previous one that is no longer supporting the rally – was tested when the London PM fix on Wednesday was at $1910.95, but has held so far. The rebound off line G also broke above lines Z ($1925) and S($1944) to add some positive spin to the recovery.
Initially, during the now month-long sell off after the high on Hiroshima Day, the OI of gold futures on Comex decreased, presumably to show that long positions were being closed. The drop was not in large numbers or consistent. This did not last long and then the gold OI started to increase again, on occasion by more than just a few thousand. At first the net short position of the commercials also declined as the price of the metal began to fall, but this trend soon also reversed.
No wonder that the price has been kept low for so long to see whether the black boxes of the large specs would reverse their long positions. This has not happened, or not nearly to the extent that was the purpose of the attack. Trading volume also declined, possibly as the longs began to take a wait and see attitude when the price refused to improve. Now it looks as if the bull is on its way back and that poses a real dilemma for the Cabal.
Do they decide to intensify the attack and run the risk on increasing their short position again, or do they cut their losses and try to cover as many of their short positions they can – which will not be easy or cheap to do in a market where there are no natural sellers in quantity other than themselves. .
Euro–gold PM fix
Last week a steady if volatile euro and stable price of gold at lower levels combined to keep the euro price of gold mostly sideways and unable to recover above the resistance of line R (€1666). The price was holding steady quite close to line R to avoid a test of the support along the bottom of bull channel KL (€1610). Sufficient so to remain with a bullish bias and the possibility that an improving price of gold this week could see a break higher above line R to resume the medium term trend.
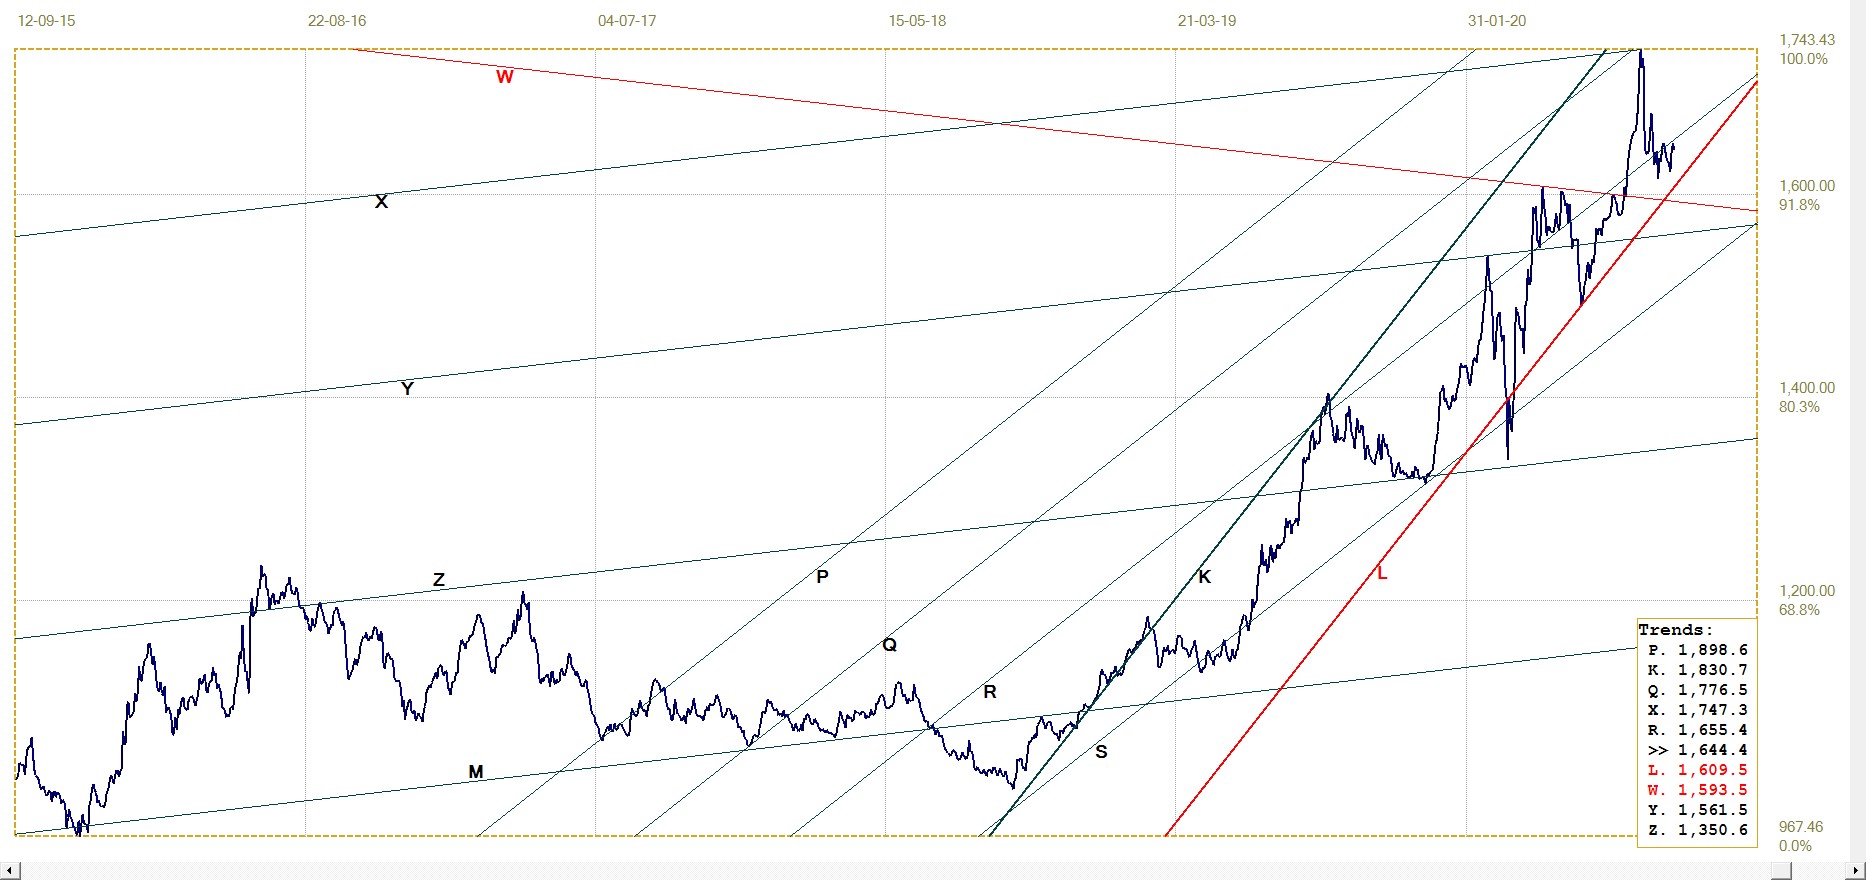
Euro gold price – PM fix in Euro, last = €1644.38 (www.kitco.com)
Silver Daily London Fix
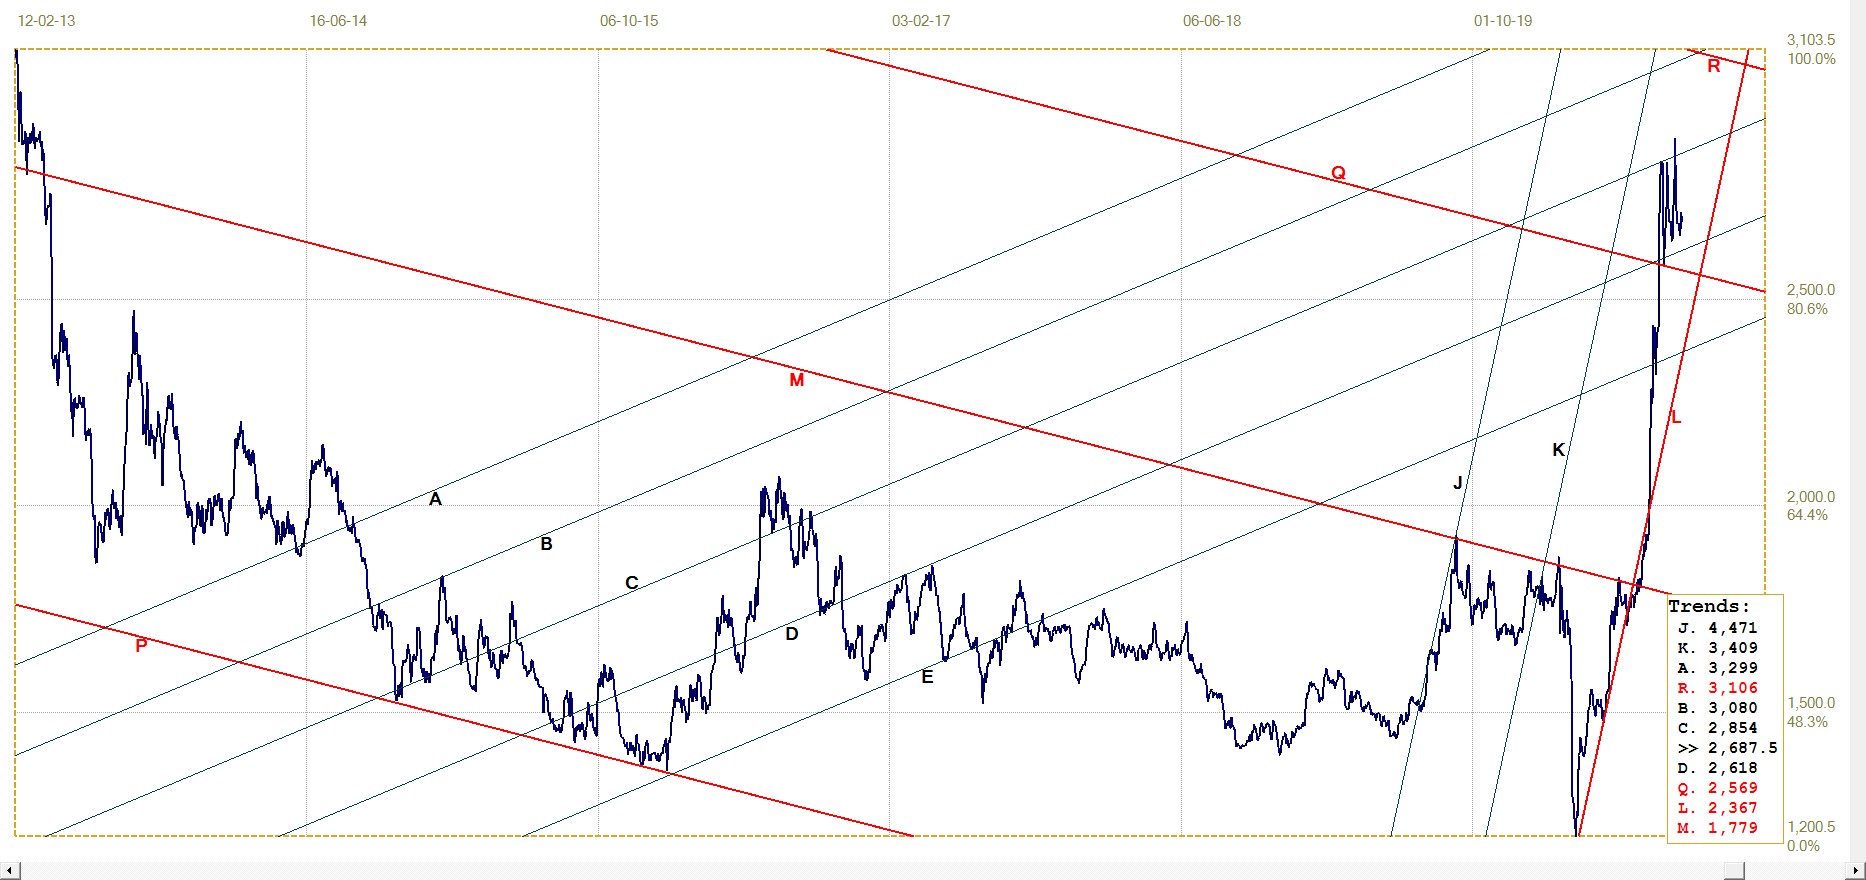
Silver daily London fix, last = $26.875 (www.kitco.com)
Channel PQR has a ratio of 400:600,which is also one of the primary rations, This explains why the price had such a hard time before it could break higher above line M ($17.79) to extend the bull trend. Now it has broken above line Q ($25.69) to consolidate between lines C ($28.54) and D ($26.18) with good volatility. The first spike lower after the break reversed off line R, which had just been broken, is what is known as a ‘goodbye kiss” – provided that the trend then resumes.
In this case it did resume, but the month long attack has kept the price of silver in the sideways volatile range. As long as line D can hold the price clear of line R to avoid a break lower, the bull trend is bound to resume.
While the Commercial net short position in gold on Comex has increased by a less than 5% since early August, their net short position in silver increased by almost 10%. In this respect the month-long attack has failed to deliver the kind of results the Commercials may have been expecting. Does this imply that the reason for the attack was to protect the weakening dollar, rather than to reduce short positions? If so, this would reveal concerns about possible effects of a weaker dollar that extend wider than only the spread than what is generally assumed.
U.S. 10–year Treasury Note
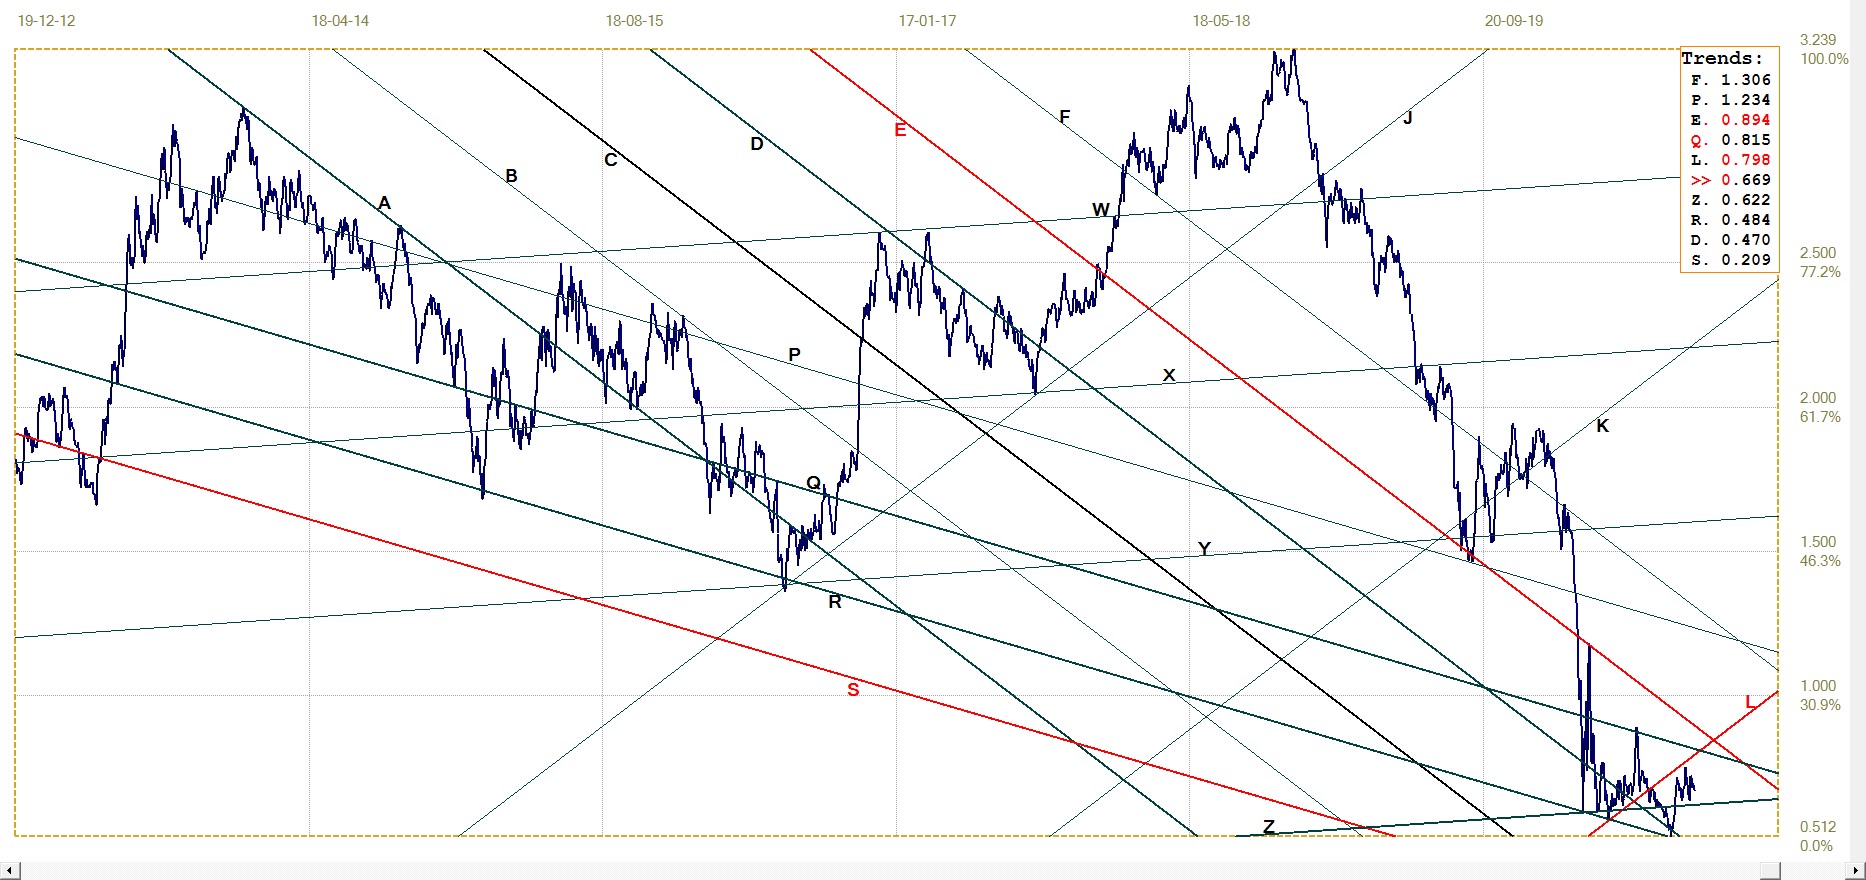
U.S. 10–year Treasury note, last = 0.669% (www.investing.com )
The fact that the yield is holding sideways above line Z (0.622%) means that the possibility of lower yields that could even turn negative is not expected soon, if at any time. Even so, the bond market is heavily over-bought and should the effect of an L-shaped bottom in the economy after COVID coupled with higher inflation place upward pressure on interest rates, it could become a tough scenario for the Fed to manage.
Their standard solution for a problem is limited to of throwing lots of money at it, which might not be the best solution under the changing circumstances.
West Texas Intermediate crude. Daily close
It looks as if he presence of nearby resistance at line L ($43.77) has caused the price of crude to halt its attempt to break and hold above line Q ($42.08). The reversal lower has broken below the support of line C ($38.37) to warn that the trend lower could continue. The price will soon have operators of wells making the by now usual difficult decision whether to operate at a loss to have some cash flow or to halt the pumping until prices are better.
This is said to be not a clear-cut financial decision, since interrupting the pumping from a well has other undesirable effects. Earlier decisions to sink new wells are also going to be reconsidered as the price falls.
********


