SPX's Correction, Gold Shines & Cup of Oil Breaks Out!


The financial markets continue to climb the wall of worry on the back of more Fed Quantitative Easing. Those trying to pick a top in this choppy bull market may prove to be correct for a couple hours but over time the shorts continue to get clobbered.
Quantitative easing was enough to turn gold back up and gave oil just enough of a nudge to breakout of its cup and handle pattern explained later.
The past few weeks the number of emails I receive on a daily basis about what individuals should do about short positions they took on their own has growing quickly. Usually when my inbox starts to fill up with traders holding heavy losses trying to pick a top I know something big is about to happen and its not going to be in the favor of the herd (everyone shorting). In the past couple week there have been some great entry points for the broad market whether its to buy the SP500, Dow, NASDAQ or Russell 2K. I focus on trading with the trend and entering on extreme sentiment readings as shown in the chart below.
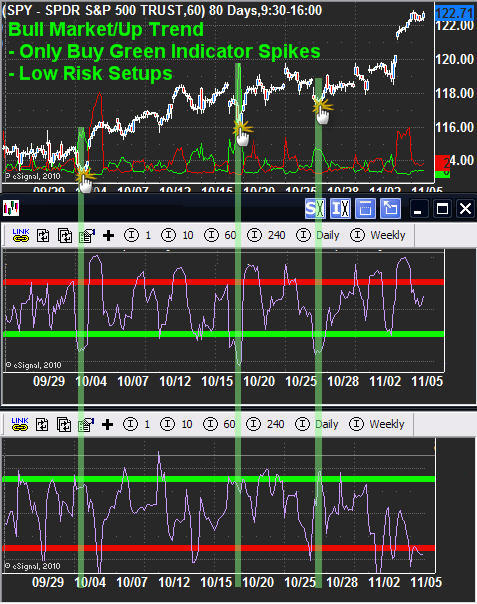
Extreme Trend Trading Analysis
Below are my main market sentiment indicators for helping to time short term tops and bottoms. That being said I don't pick short term tops in hopes to profit on the down side. Rather I wait for a extreme sentiment bottom to be put in place, then enter long with the up trend (Buy Low).
Once there is a 1-2% surge in price and sentiment indicators are showing a short term top I like to pull a little money off the table to lock in some profits while still holding a core position (Sell High). This is exactly what I/subscribers have done over the last couple weeks. This is a simple yet highly effective strategy and works just as well in a down trend except I focus on shorting extreme sentiment bounces. Subscribers know what these indicators are as I cover them each week in my pre-market trading videos as we prepare for the day ahead.
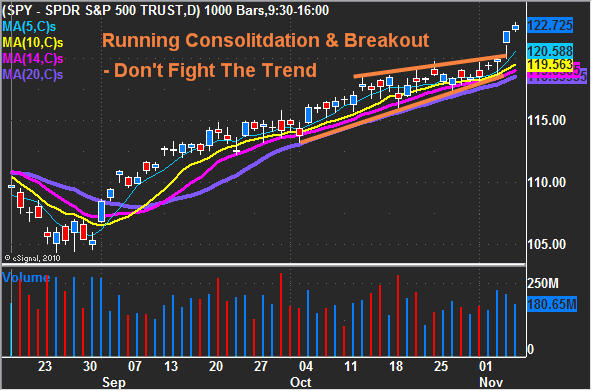
SPX Running Correction
Since early September the equities market has been on fire. In late September the market was extremely toppy looking and trading at key resistance levels from prior highs convincing a lot of traders to take a short position. But instead of a correction the market surged and has since continued to grind its way up week after week.
This rising choppy price action can be seen two ways:
- As a rising wedge with a blow off top (Bearish)
- Or as a Running Consolidation (Bullish)
The running consolidation happens when buyers are abundant picking up more shares on every little dip. Overall looking at the intraday price action you will see market shakeouts as it tries to buck traders out before it continues higher. This choppy looking market action if not read correctly looks extremely bearish to the novice trader and the fact the market is so overbought it easily convinces them to take short positions. This choppy action is just enough to wash the market of weak positions before starting another run up.
All that said, both a blow off rising wedge and a running correction are very bullish patterns for a period of time. Again I cannot state it enough, trade with the trend and the key moving averages.
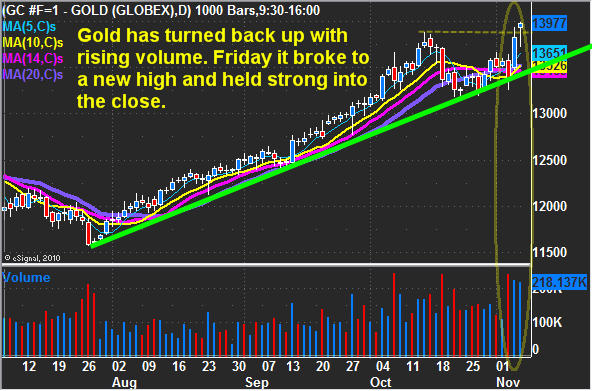
Gold Shines On The Daily Chart
The gold story is straight forward really… Trend is up, quantitative easing is back in action and that is helping to list gold and silver prices. Key moving averages have turned back up and gold closed at a new high which shows strength.
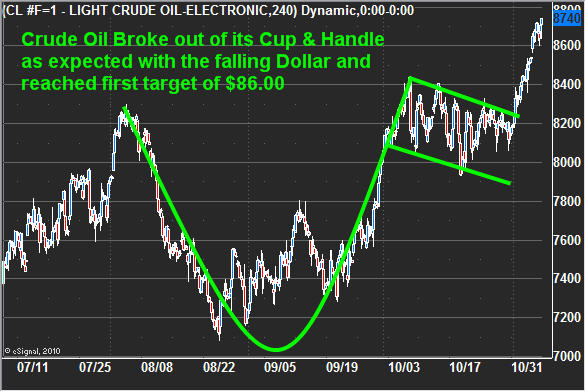
Crude Oil Breaks Out Of Cup & Handle Formation
Crude oil has been dormant the past few weeks even though the US Dollar has plummeted. But last week's news on more QE was enough to send oil higher. The surge took oil prices straight to the 2010 highs as expected and blew past my first target of $86 per barrel. I figure it will consolidate here for a while until we see if the dollar bottomed last week or is just testing the breakdown level.
Weekend Trading Conclusion
In short, the market has played out exactly as we planned and all four of our positions are deep in the money. As we all know the market goes in waves in both price and for trade setups. The past couple weeks were great for getting into trades and now the market is running in our direction. It will take a few days for the market to stabilize (pullback or pause) before we could get anther round of trade setups. Keep position sizes small as the market remains overbought and a sharp correction could happen at any time. Until then, keep trading with the trend.
Disclaimer: I own shares of SPY and MRO.V
********
Get My Daily Pre-Market Trading Videos, Daily Updates & Trade Alerts Here: www.TheGoldAndOilGuy.com
Chris Vermeulen

Chris Vermeulen has been involved in the markets since 1997 and is the founder of Technical Traders Ltd. He is an internationally recognized technical analyst, trader, and is the author of the book: 7 Steps to Win With Logic
Through years of research, trading and helping individual traders around the world. He learned that many traders have great trading ideas, but they lack one thing, they struggle to execute trades in a systematic way for consistent results. Chris helps educate traders with a three-hour video course that can change your trading results for the better.
His mission is to help his clients boost their trading performance while reducing market exposure and portfolio volatility.
He is a regular speaker on HoweStreet.com, and the FinancialSurvivorNetwork radio shows. Chris was also featured on the cover of AmalgaTrader Magazine, and contributes articles to several financial hubs like MoneyShow.com.


