Stage Analysis For Gold Price And USD


This post will use Weinstein’s Stage Analysis to examine where we are in both Gold and the USD. For this analysis, I will use Weekly charts and highlight the Weekly 30ema as a guidepost for our analysis.
https://goldtadise.com/?p=394282
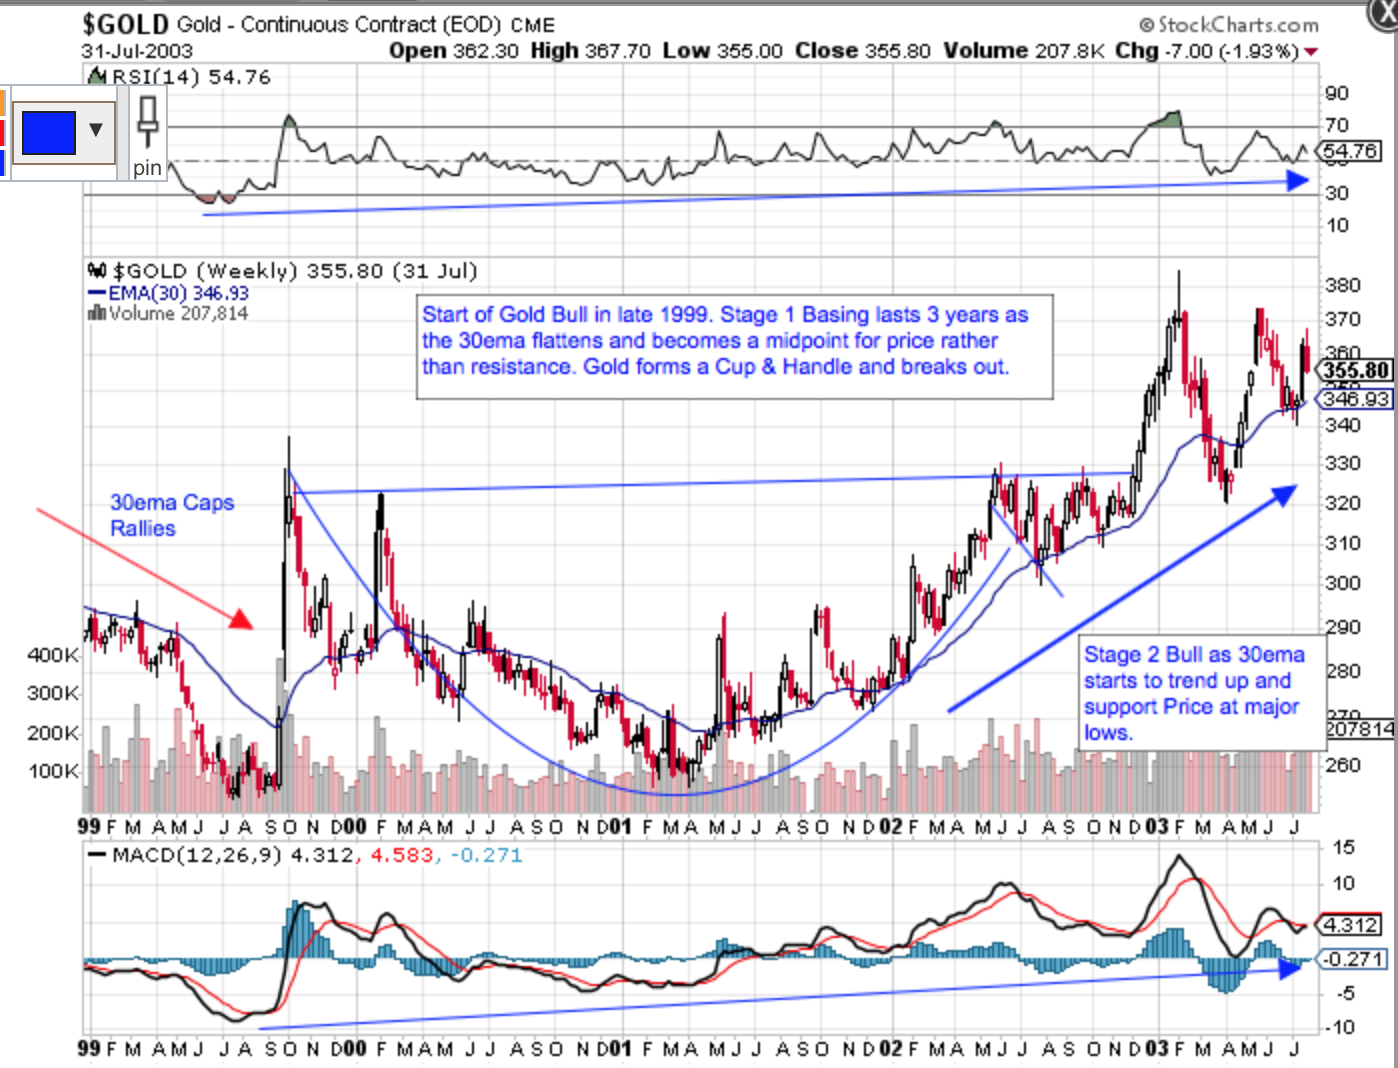
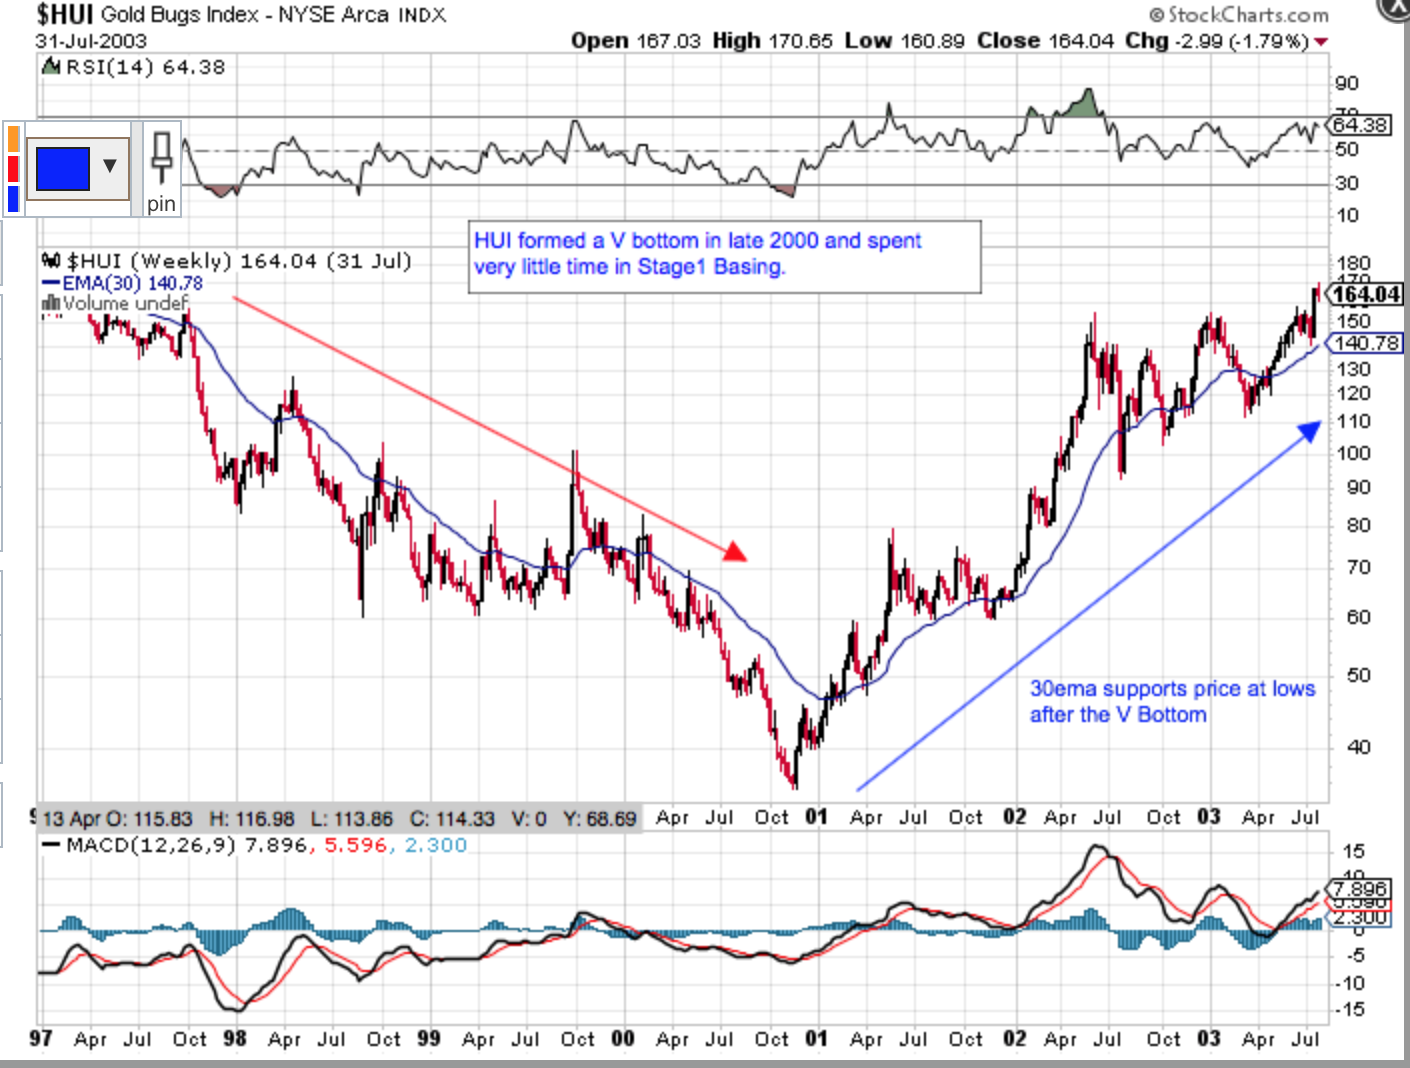
First let’s start with a bit of History and go back to 1998 to 2002 to examine the transition in Gold and the HUI from Stage 4 Bear, to Stage 1 Basing to Stage 2 Bull Market.
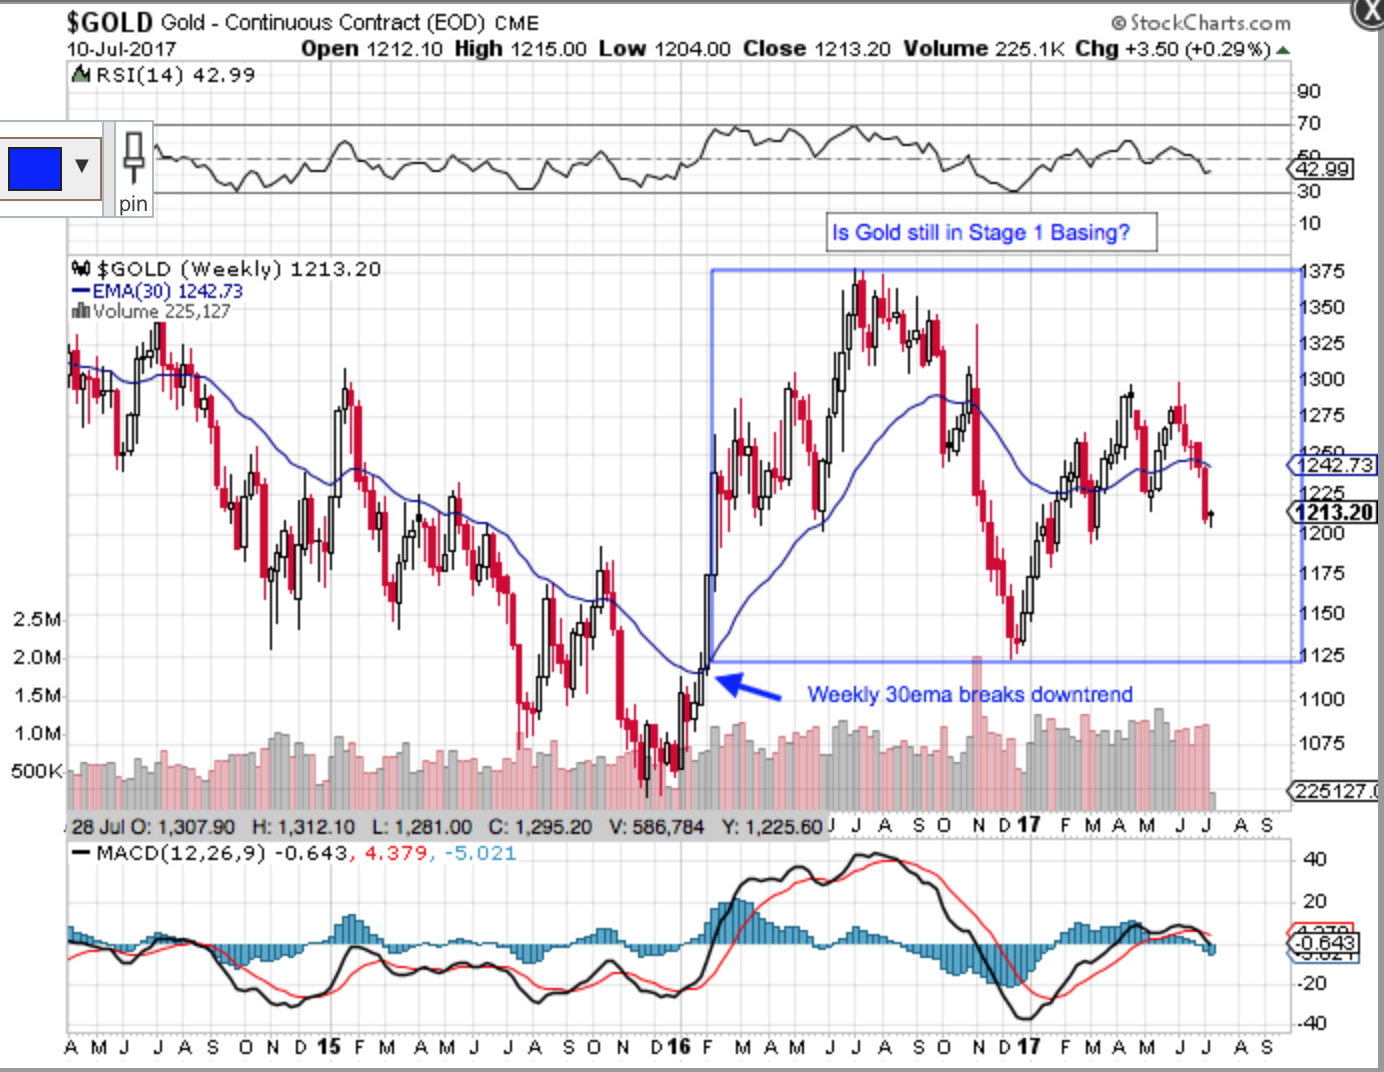
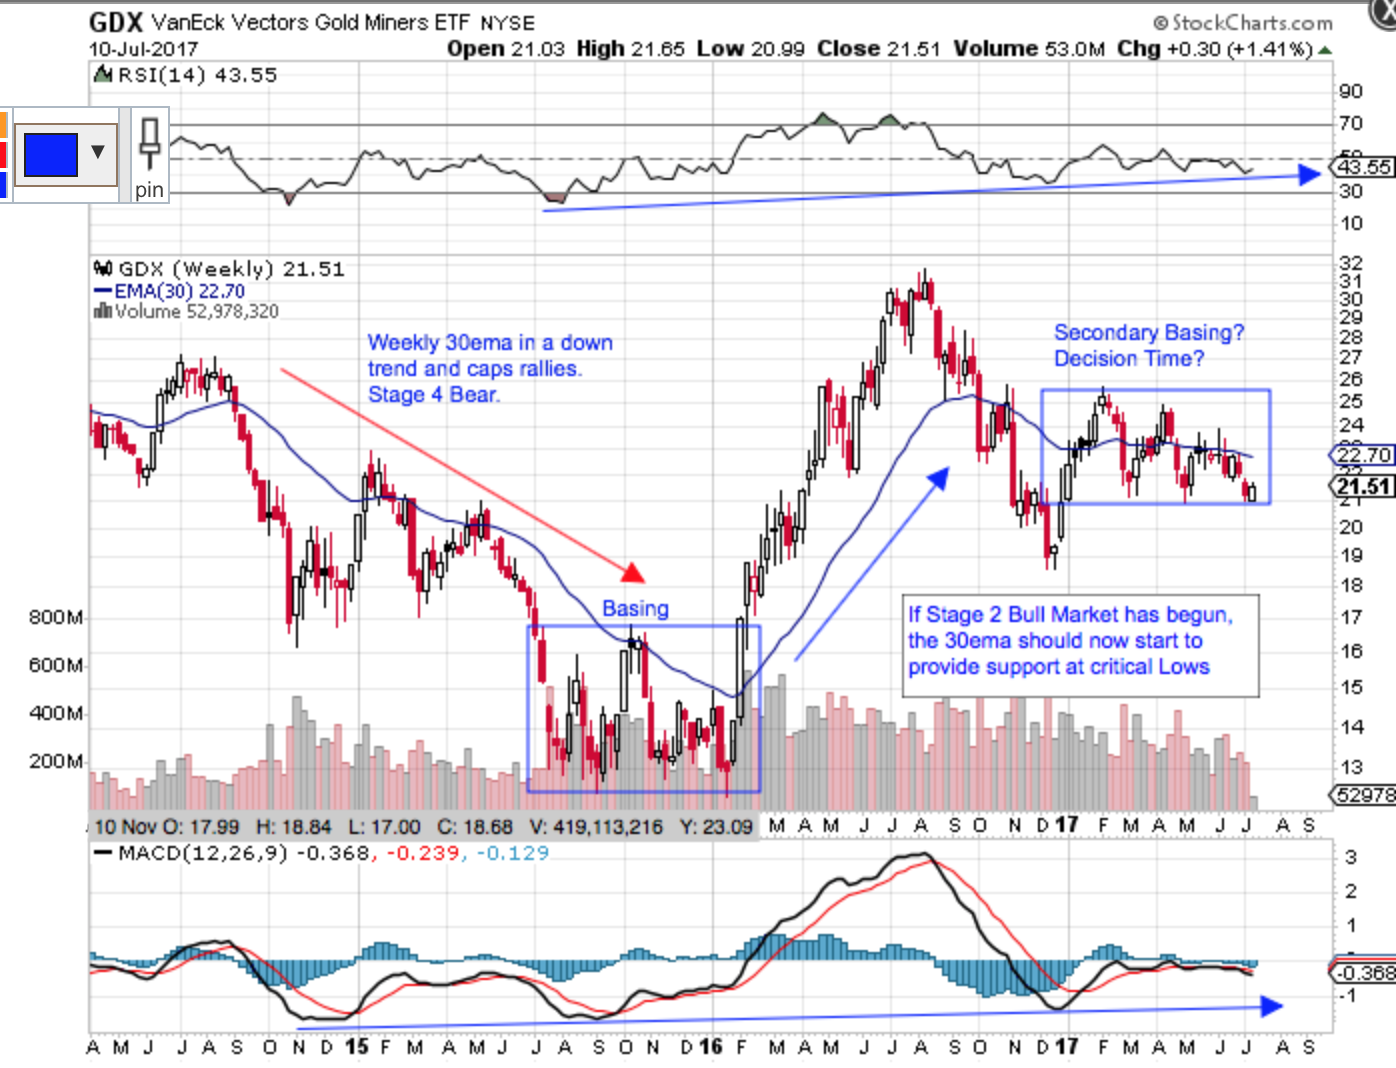
Fast forward to today and we can see that the 30ema seems to have found a bottom but in 2017, it seems to be a midpoint for price and is not yet providing strong support at major lows for either Gold or GDX. My last chart on GDX shows a potential Fractal. Will history repeat? Time will Tell.
My last chart is on the USD. If the USD is close to finding a Yearly Cycle Low (YCL), the 30ema should still continue to provide resistance near Intermediate Cycle Tops if the USD’s 15 Year SuperCycle has topped.
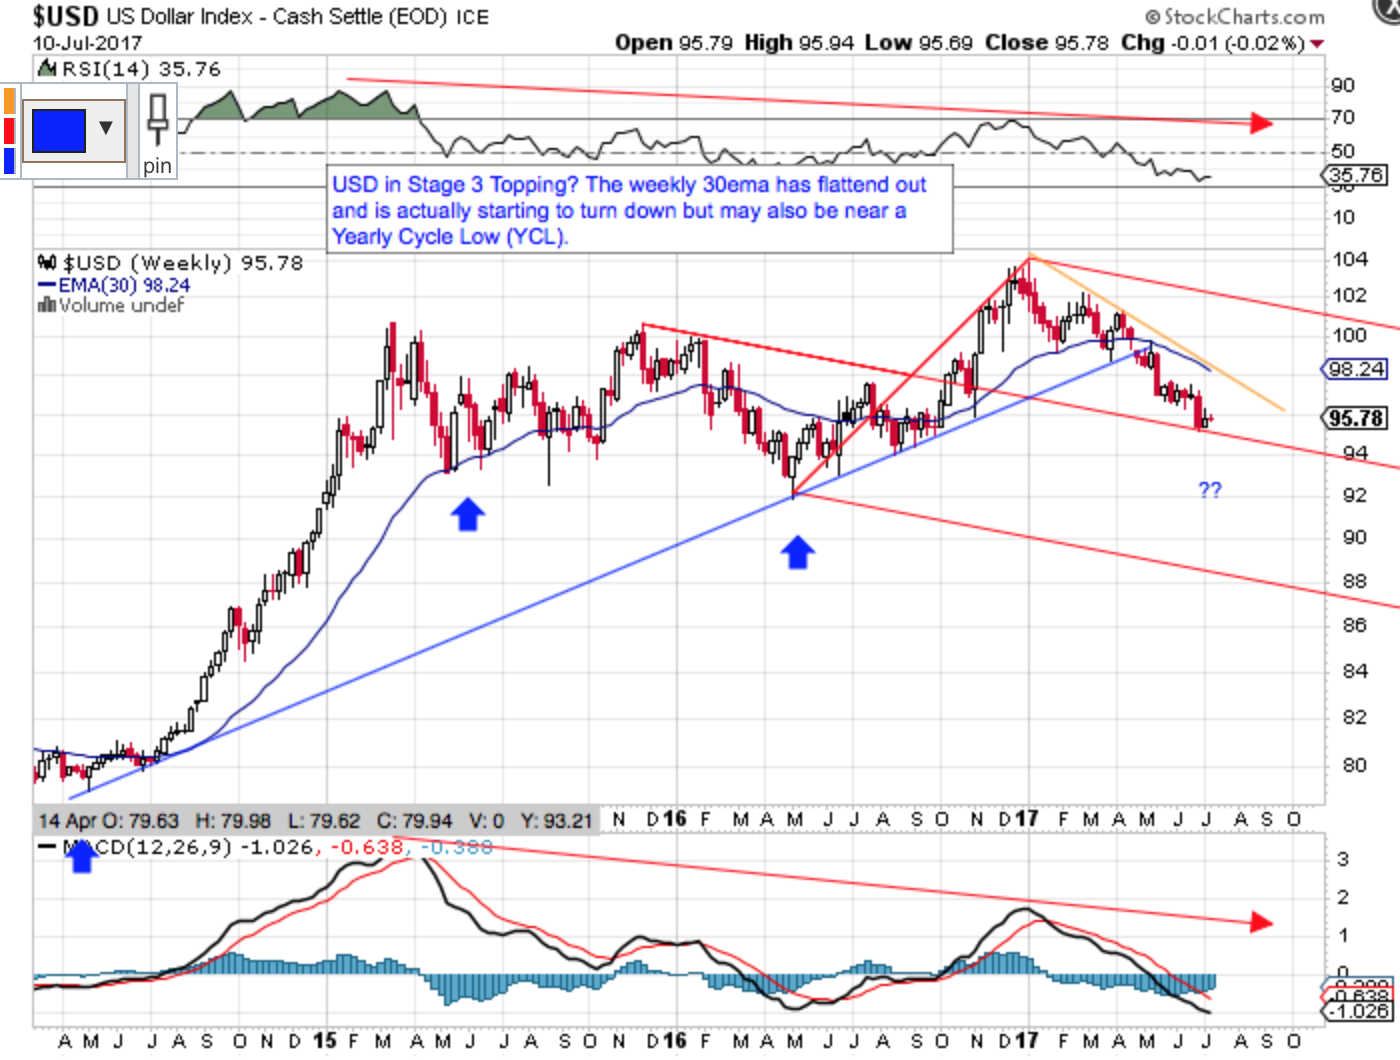
********


