Stock Market: 20% Bear Market In The Works


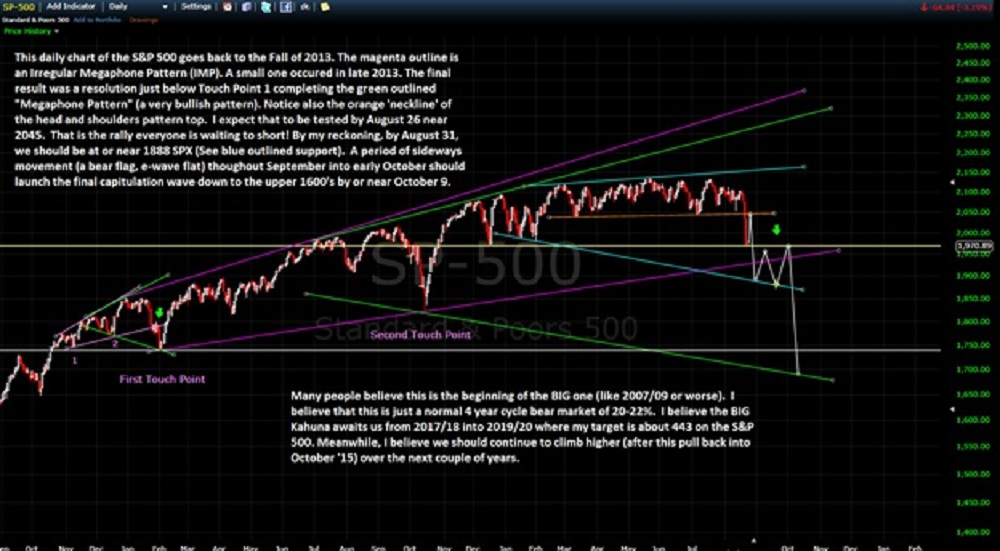
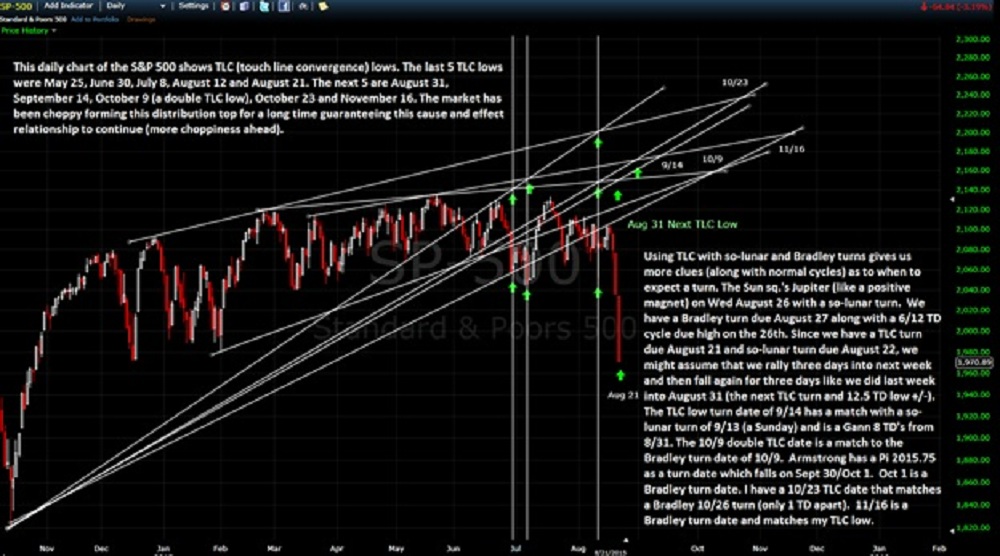
Last week, I wrote that I would share the IMP pattern with you and also more about TLC (Trend Line Convergence) and how it identifies bottoms (or buy points) in the stock market. First, the week in review: the astro Friday was especially bad as the Sun sq.’d Saturn. We also broke below the neckline of the head and shoulders pattern top. In the charts below, I also had noted to my subs that there was a TLC low due August 21. The next one is due on August 31, which also is a very negative astro with the Sun opposing Neptune while the full moon on August 29th reaches perigee. It is my opinion that August 31st will trump August 21st for being a real bad day in the market.
However, first, next week, we have the Sun conj. Jupiter on the 26th, which is like a positive magnet. We have a Bradley turn due August 27th. It is also the 12 TD cycle top (August 26/27). The 12 TD low is due August 28/31. My guess is that we have a reflex rally to test the neckline of the head and shoulders pattern near 2045 SPX or about a 3.8% rally into the 26th. The P/C ratio Friday hit an unheard of 1.69 and the TRIN tagged 2.92, all signs of a bounce coming (too many, getting too beared up, too quickly). From the 26th to the 31st, I believe we fall from around 2045 to near 1888 SPX, over 7% in 3 trading days!
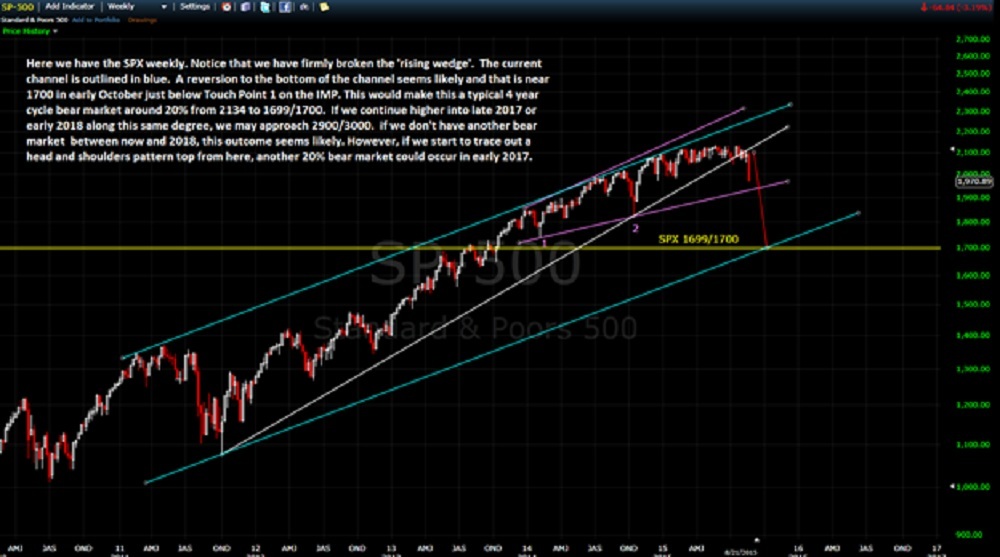
All the choppiness we experienced in the distribution top over the past months will have its effect on the market in this bear drop. That means huge swings coming both up and down into early October (even with the mining stocks). Ultimately, I believe we go as low as 1700 SPX on this drop from the May highs or about 20%. I don’t see anything close to a 2000/2002 or 2007/2009 style drop here, not even close. Actually, it is quite normal to have a 20% bear market every 4 years, so nothing unusual here about that.
In the charts below, I show how the TLC lows are found (geometrically) and how the IMP pattern works. It is interesting to find Bradley turns around some of the TLC lows (October 9th is quite interesting). I also touch on GDX (the mining shares) and where I believe they are headed in the short-term.
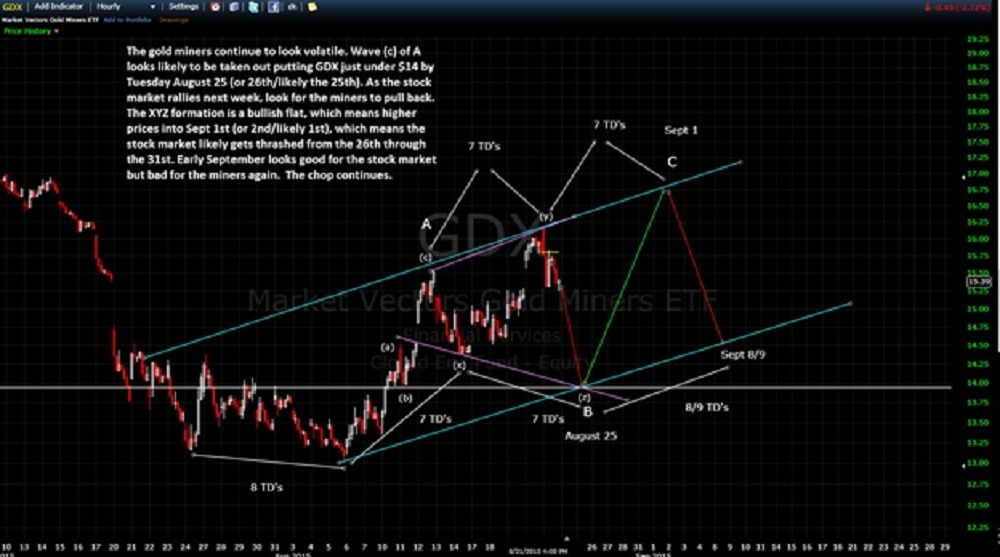
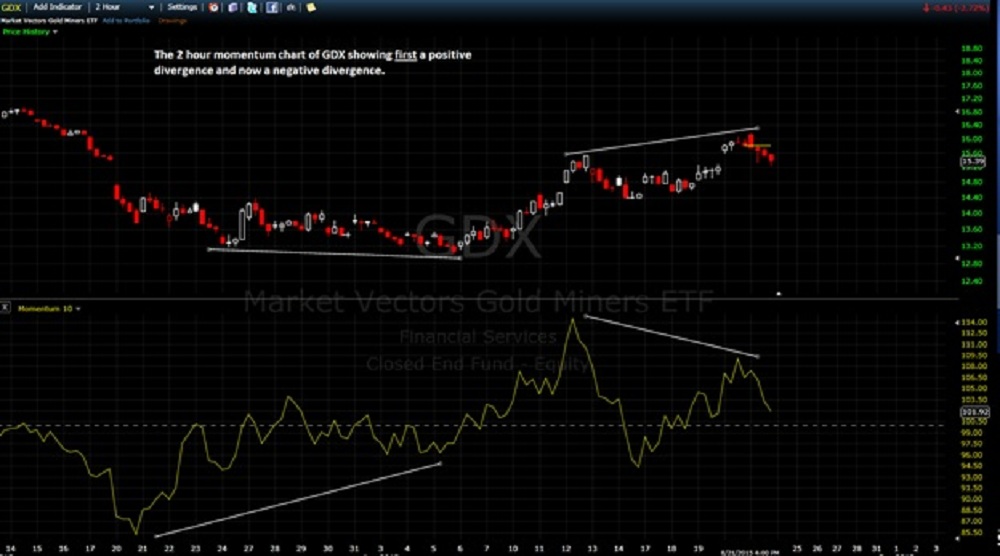
It is interesting to note that while GDX is showing a negative divergence at this juncture, gold, itself, is not doing so. That means there is a partial disassociation or disconnect between the two.
I keep saying that this is a trader’s market, not a buy and hold.
********
Brad Gudgeon, editor and author of the BluStar Market Timer, is a market veteran of over 30 years. The subscription website is www.blustarmarkettimer.info
Our verifiable trading signals are now +79% since mid April 2015. We also offer auto-trading for those who don’t have the time to trade their own accounts.
To view the details more clearly, you may visit our free chart look at http://charts.blustarmarkettimer.com
This web site is sometimes updated periodically as events unfold.
Copyright 2015 BluStar Market Timer


