The Stock Market Cycle In Years Ending In 7
 share
share
 share
share
 share
share
 share
share
 share
share
It has been proven repeatedly by various market experts that stock market cycles exist. Whether you believe in them or not that is up to you, but as a technical trader myself I see price action repeat on virtually all time frames from the intraday charts, to daily, weekly, monthly, quarterly, yearly, and beyond.
In fact, cycles tend to move in series of 3’s, 7’s and 10’s, and multiples of these as well. So, 3 bars, 7 bars, 10 bars no matter the time frame, though I find the 10min, daily, weekly, and monthly charts work best.
Knowing these cycles lengths, let’s review briefly where the markets are situated in terms of a seasonality, volatility, and the 3, 7 and 10 cycle periods. What I am about to show you is very intriguing.
I will let the charts do all the talking as they show the picture clearly.
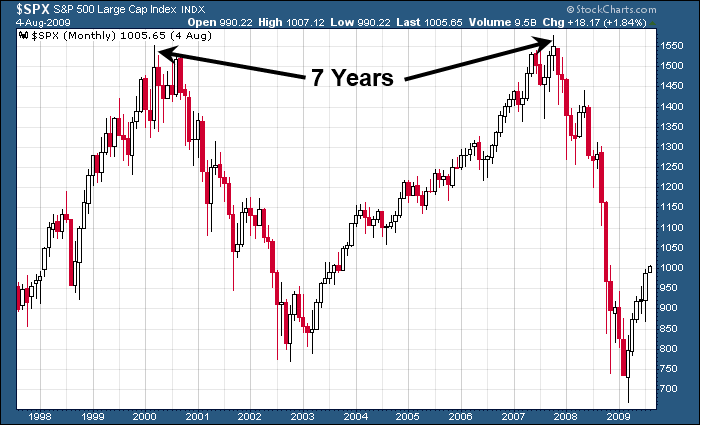
Example of Last 7 Year Stock Market Cycle
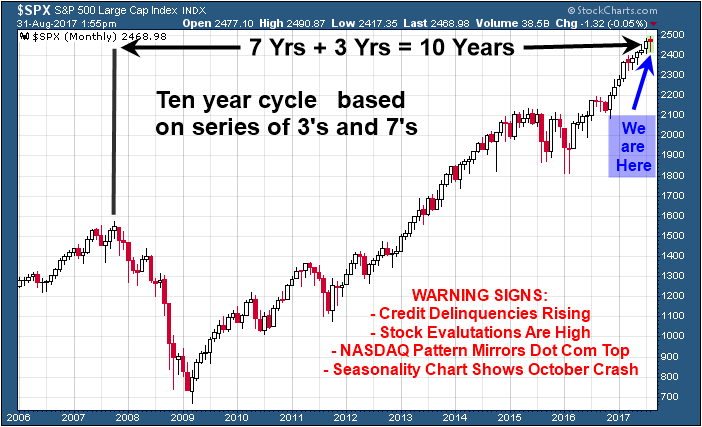
Potential 10 Year Cycle Top Forming
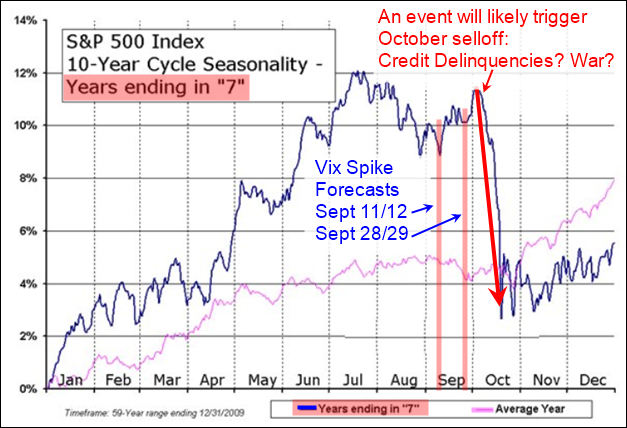
Seasonality Of Monthly Price Action For Years Ending In 7
Concluding Thoughts
In short, this is just a quick snap shot of some angles in which I look at the stock market. There are a lot different things happening (cycles, technical analysis patterns, and fundamentals) which have been painting a bearish picture for the stock market.
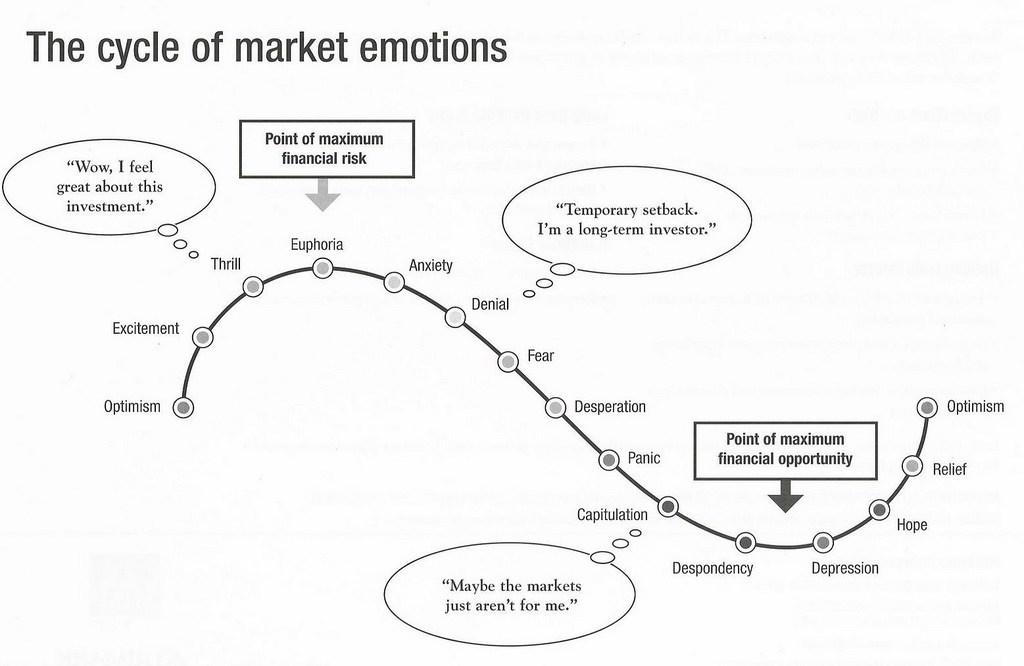
In fact, last year the US equities market were only a couple down days way from trigging a full-blown bear market. But Trump was elected and that triggered a massive rally which I see as being a final exhaustion move (euphoria) just before a major market top.
I have been watching and waiting for what I feel will be the next major market top for just over a year now. Why? Because once a market top looks to be in place we must adjust all our long-term portfolio holdings into different asset classes with CASH being a huge portion of it.
Stock prices typically fall 7 times faster than they rise so just imagine being properly positioned for a bear market with a portion of your position knowing you could make 7 years of slow painful growth in only 8-12 months when the bear market starts. I recently did a seminar talking about his and how one can use inverse ETF’s and short selling to profit from the next financial down turn which will eventually happen.
********
If you want to stay in the loop and be positioned for this massive move over the next two years Bear Market, then back into a Bull Market be sure to join my 2 Year Trading & Investing newsletter plan at http://www.thegoldandoilguy.com/etf-trading-newsletter/
share
share
share
share
share

Chris Vermeulen has been involved in the markets since 1997 and is the founder of Technical Traders Ltd. He is an internationally recognized technical analyst, trader, and is the author of the book: 7 Steps to Win With Logic
Through years of research, trading and helping individual traders around the world. He learned that many traders have great trading ideas, but they lack one thing, they struggle to execute trades in a systematic way for consistent results. Chris helps educate traders with a three-hour video course that can change your trading results for the better.
His mission is to help his clients boost their trading performance while reducing market exposure and portfolio volatility.
He is a regular speaker on HoweStreet.com, and the FinancialSurvivorNetwork radio shows. Chris was also featured on the cover of AmalgaTrader Magazine, and contributes articles to several financial hubs like MoneyShow.com.
More from Gold-Eagle


