Stock Market Has Entered A 25-35year Crisis Cycle Re-evaluation Event


We can only imagine what many of you are thinking and feeling right now. Shock? Concern? Despair? Some of you have already emailed us asking about the US and Global markets to find out what our predictive modeling systems are suggesting. Today, we're going to show you what the longer-term Adaptive Fibonacci Price Modeling system is suggesting for the S&P and NASDAQ.
First, we want to ask you to slow down, take a few seconds to realize we will recover from this virus event and the smart thing to do is protect your family, protect your assets, and prepare for the future. Market crashes happen only 2-3 times in a lifetime and they, not the end of the world or financial system.
This event is different than the 2000 or 2008 market crash events. Each of those past events was somewhat localized events that disrupted a segment or portion of the global economy. Yes, the 2008 event was bigger than the 2000 event, but the localization of the event still presented a similarity that provided a moderately quick recovery process.
Before we continue, be sure to opt-in to our free market trend signals before closing this page, so you don’t miss our next special report!
Next, we want you to attempt to understand this virus event is a bit different than the most recent crash events. A virus pandemic of this nature will likely result in a much broader economic contraction and various collateral damage processes as it transitions across the globe. Currently, our research team is attempting to watch for the early signs of these collateral damage processes to determine if a broader global market collapse is going to take place. At this time, we must all try to prepare for what is unknown and could happen in the future.
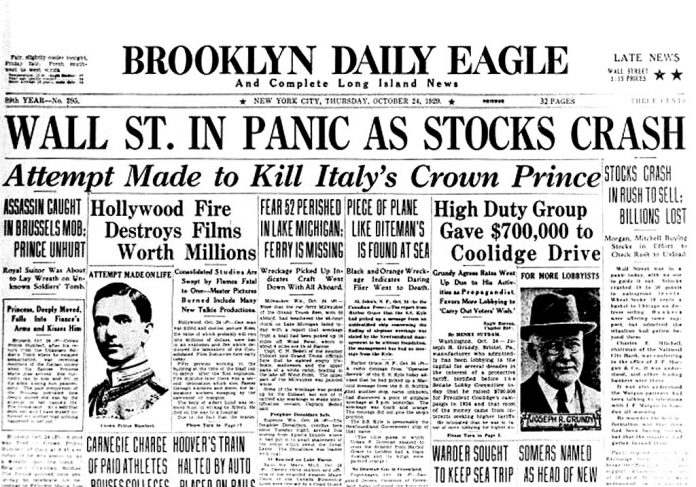
The longer-term generational cycle (the roughly 85-year Strauss-Howe Theory suggests societies navigate a long term cycle that repeats itself, roughly, every 85 years). This societal evolutionary theory centers around the concept that people repeat many of the same failures learned by previous generations – roughly every 85 years. What was learned in the 1920s~1940s will have been forgotten in the 1990s~2020 and many of the same mistakes will be made.
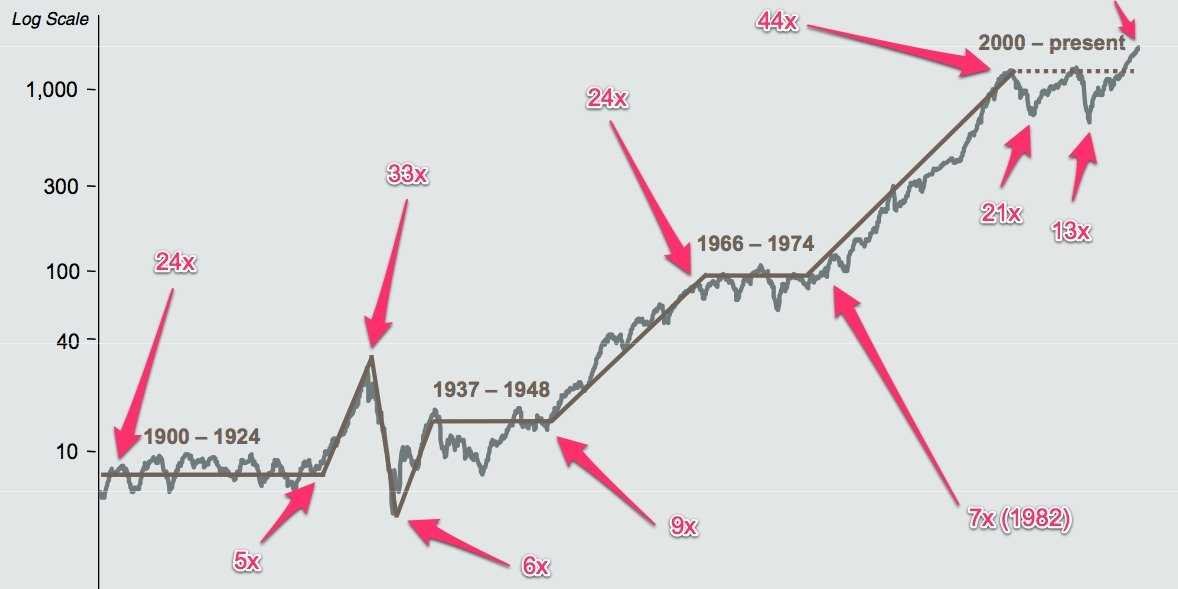
One of our researchers, Brad Matheny, authored a book in March 2019 that analyzed these super-cycles and accurately predicted this market crash could happen as early as August or September 2019. Within this book, Mr. Matheny made great efforts to illustrate how important it is for everyone to become aware of these bigger market cycles and to prepare for what was likely to come near the end of 2019 and into early 2020. You can get your own copy of this book here.
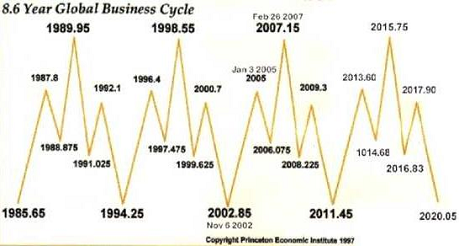
Additionally, smaller market cycles take place within the bigger super-cycles. This example of the 8.6-year business cycle highlights the repetitive nature of these broader market cycles. Think about how 10 of these smaller business cycles equal the much larger 85-year generational cycle. Now, think about how each stage of the roughly 20~21 year generational cycle has played out over the last 85 years.
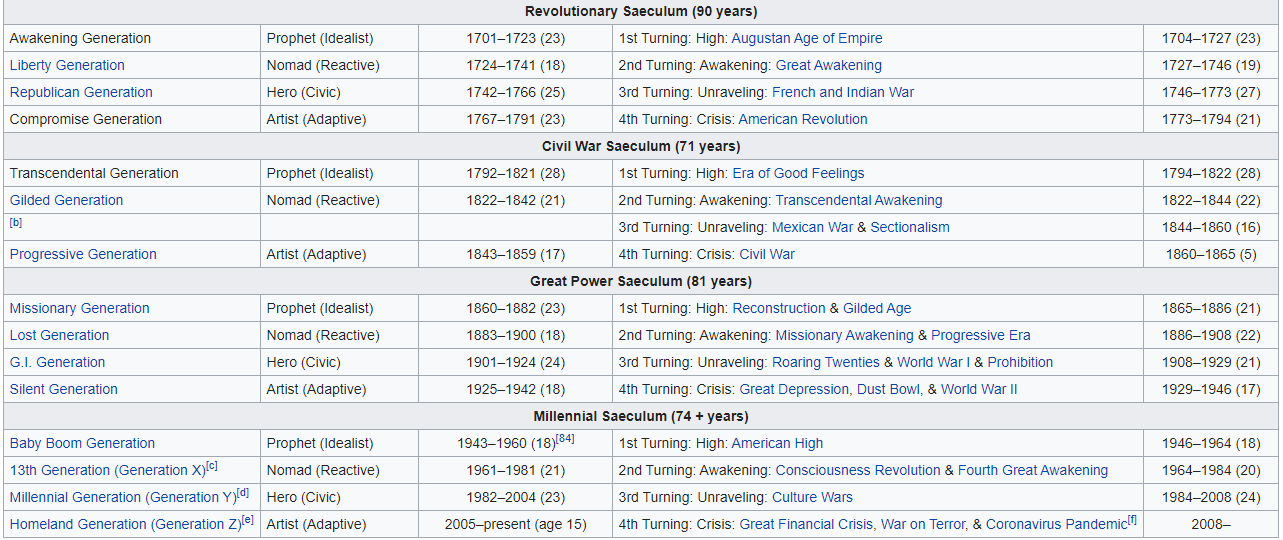
This screen capture highlights the phases and structures of the broader Strauss-Howe generational theory. Pay very close attention to how structured the process is and what to expect in the future. Also, notice that we entered a CRISIS phase in 2005.
Past cycles have lasted more than the average 20~21 years. Longer cycle lengths are not uncommon within the broader 85-year super-cycle when larger societal events take place. Thus, this current CRISIS phase could last 25 to 35 years before a new HIGH phase sets up.
The reason we are bringing all of this together within this article is because we want to clearly stress forward and future expectations as well as to make our longer-term market concerns very clear to all of you. If, as the generational cycles suggest, we have entered a CRISIS phase and are moving toward a HIGH phase, then we are in the midst of a phase that can be very destructive to institutions and society as a whole.
“According to the authors, the Fourth Turning is a Crisis. This is an era of destruction, often involving war or revolution, in which institutional life is destroyed and rebuilt in response to a perceived threat to the nation's survival. After the crisis, civic authority revives, cultural expression redirects towards community purpose, and people begin to locate themselves as members of a larger group.”
These super-cycles and the broader “collateral damage” issue is what leads our researchers to believe the US and Global markets may continue to target much deeper price support levels before finding a bottom. Even though the US and global central banks are doing everything possible to avoid a contagion economic collapse, we believe many people have “forgotten” about these broader market cycles and may be shocked to learn the COVID-19 virus event is happening in the midst of an 85-year generational Super-Cycle that predicts a true price bottom (new HIGH phase) may not set up until 2030~2035.
Let's take a look at where our Adaptive Fibonacci Price Modeling system is suggesting the markets may bottom..
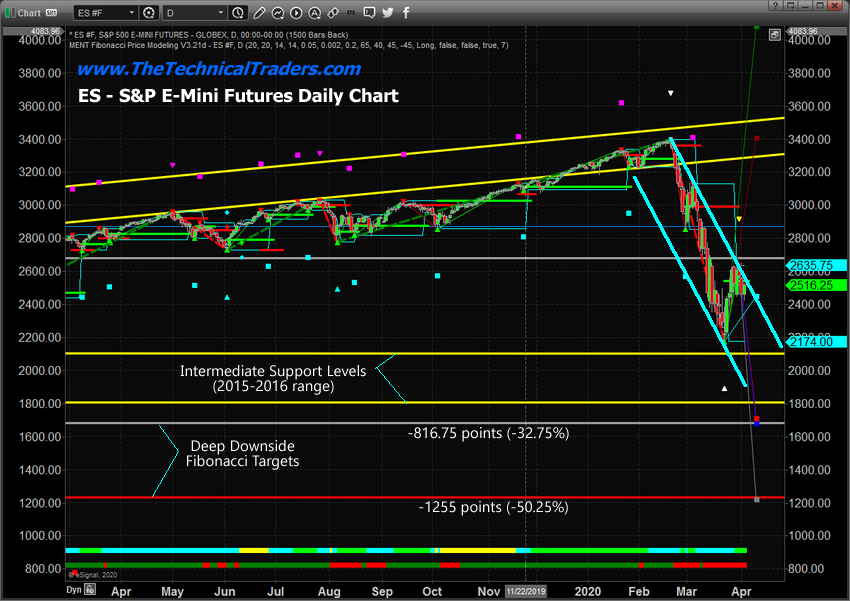
Daily S&P 500 Futures Chart
We'll start by exploring this Daily ES chart which highlights two key Fibonacci downside price targets: 1683 and 1225. Look for the GREY and RED lines near the bottom of this chart and look for the BLUE/RED and GREY SQUARES near the right edge of this chart. These SQUARES are the DAILY Fibonacci downside price targets as calculated by our Adaptive Fibonacci Price Modeling system.
Also, pay attention to the CYAN price channel that we've drawn on this chart highlighting the current downside price channel that has setup. It is our opinion that price will likely attempt to stay within this price channel as it moves deeper to target these support levels – eventually attempting to set up a bottom near either of these deeper Fibonacci support levels.
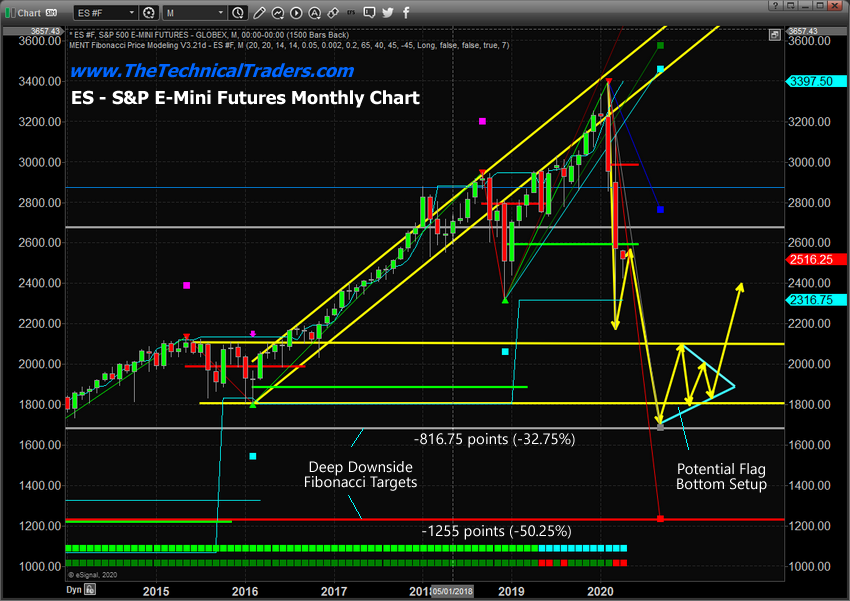
Weekly S&P 500 Futures Chart
This Weekly ES chart highlights the Weekly Adaptive Fibonacci Price Modeling system's results – which are almost exactly the same as the Daily targets. This is very important if you understand that the Fibonacci price structure is supposed to be structured in a universal means throughout all price activity. Thus, if the Daily and Monthly Fibonacci Modeling system is targeting the exact same levels – then this carries much greater importance to us.
The same downside targets in the ES are 1683 and 1225. These represent a continued downside price move of -32.75% or -50.25% from current levels. The YELLOW lines we've drawn on the chart represent what we believe the bottom may look like if the first level of support, 1683, acts at a bottom. We do believe a bottom will set up in a FLAG formation that may take many months to complete before any real rally begins.
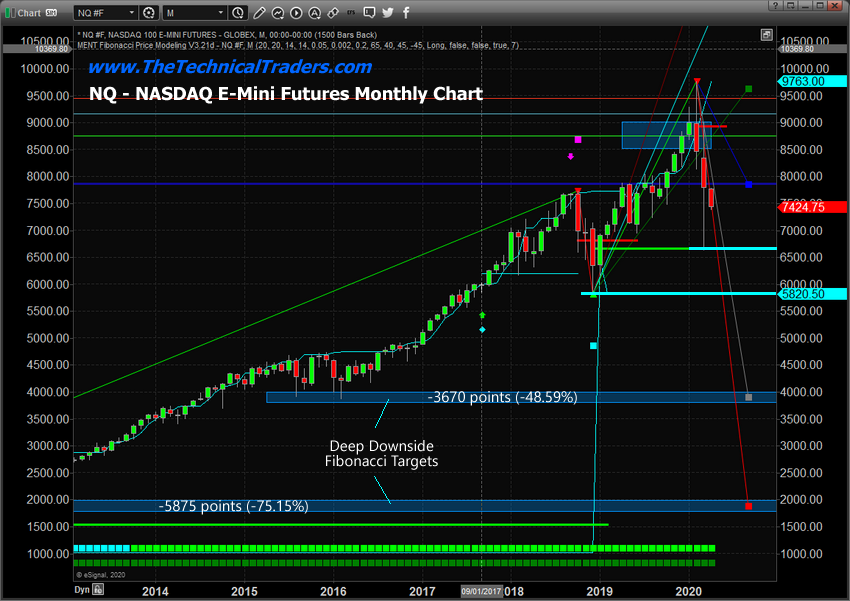
Weekly Nasdaq Futures Chart
This Weekly NQ chart points to an even deeper price bottom. The downside Fibonacci targets are 3900 and 1865 (-48.59% and -75.15% below current price levels). These deeper price targets suggest the NASDAQ market may become unusually volatile over the next 12 to 24+ months. We believe this could become an unforeseen risk for many global investors that believe technology will recover faster than many other market sectors. If our research is correct, the NASDAQ could collapse to far deeper levels than the S&P or the Dow Industrials.
How could the NASDAQ collapse like this? Remember the “collateral damage” aspect and think about what it would take for these technology companies to loose their financial support? Companies like Twitter, Uber and dozens of others operate with negative annual cash-flow – they depend on spending money they can't earn to stay in business. If this cash reserve vanishes – what happens?
The process of getting to these lows can come in many forms – yet the targets are still there for us to understand and prepare for.
On the weekend I wrote an interesting post sharing a trading experience I had during the 2000 bull market and how there are some similarities in price patterns and psychologically with traders as we have right now. It's worth a read.
Watch for the global markets to continue to target recent lows. On the NQ chart, above, we've drawn some CYAN lines near recent lows to illustrate these levels. If the global markets do collapse to the Fibonacci levels we are predicting, then a much bigger contagion event is taking place along with the generational cycles and an unraveling of many institutional processes and functions. Remember, we may continue within the CRISIS phase of the Super-Cycle for another 3 to 10+ years. The COVID-19 virus event may be just the trigger of this collapse – but the writing has been on the wall for many decades.
Be very cautious buying into these dips at the moment. We have been warning about this event for a while. Just last week we published a short guide and our basic trading and investing strategy on how to profit from bear market cycles - explained. Our researchers predicted August/September 2019 as the “critical date” and urged “move to cash” at that time to protect your assets from this event – few listened to us while the markets continued to push higher.
Luckily, on February 23rd we closed out all of our remaining positions for our active ETF trading account with our subscribers. Our trading accounts are sitting at a new high watermark and we avoided the market crash and took advantage of the 20% rally in bonds.
Maybe more people will listen to us after reading this article and prepare for what may come in the near future? Maybe some of you will grasp the idea that these Super-Cycles are real and learn this may become the greatest opportunity of your life with our help.
As a technical analyst and trader since 1997, I have been through a few bull/bear market cycles. I believe I have a good pulse on the market and timing key turning points for short-term swing traders.
I hope you found this informative, and if you would like to get a pre-market video every day before the opening bell, along with my trade alerts visit my Active ETF Trading Newsletter. If you are a long-term investor with any type of retirement account and are looking for signals when to own equities, bonds, or cash, be sure to become a member of my Long-Term Investing Signals.
Ride my coattails as I navigate these financial markets and build wealth while others lose nearly everything they own during the next financial crisis.
Chris Vermeulen
Chief Market Strategies
Founder of Technical Traders Ltd
********

Chris Vermeulen has been involved in the markets since 1997 and is the founder of Technical Traders Ltd. He is an internationally recognized technical analyst, trader, and is the author of the book: 7 Steps to Win With Logic
Through years of research, trading and helping individual traders around the world. He learned that many traders have great trading ideas, but they lack one thing, they struggle to execute trades in a systematic way for consistent results. Chris helps educate traders with a three-hour video course that can change your trading results for the better.
His mission is to help his clients boost their trading performance while reducing market exposure and portfolio volatility.
He is a regular speaker on HoweStreet.com, and the FinancialSurvivorNetwork radio shows. Chris was also featured on the cover of AmalgaTrader Magazine, and contributes articles to several financial hubs like MoneyShow.com.


