Stock Market Performance Two Months Before And After A Presidential Election


The stock market hates uncertainty. That is the worst environment for stocks. Presidential Elections create enormous uncertainty.
First, let’s consider the scenario where an Incumbent President is running for reelection. How did the stock market perform during the two months immediately prior to the election, and then how did it perform immediately after the election? The two charts below show the psychology of the Market leading into the last two elections when an incumbent President was running for reelection, Obama in 2012, and Bush in 2004.
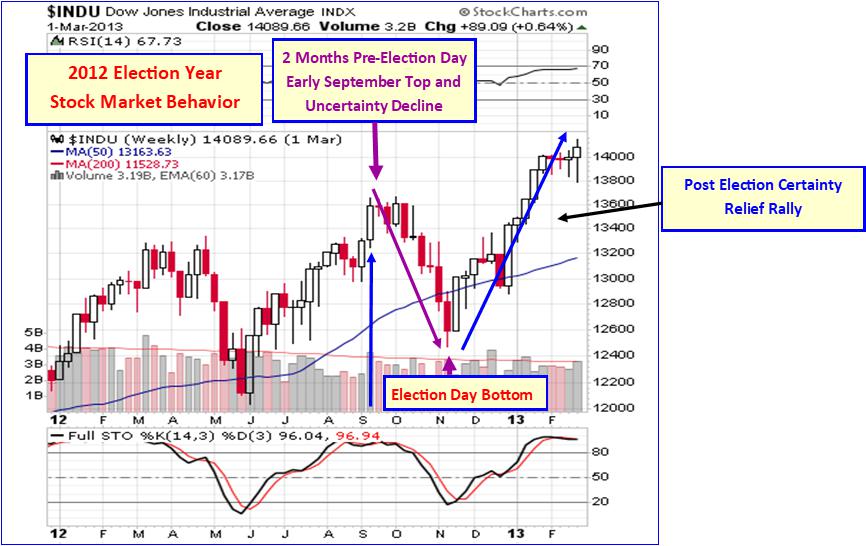
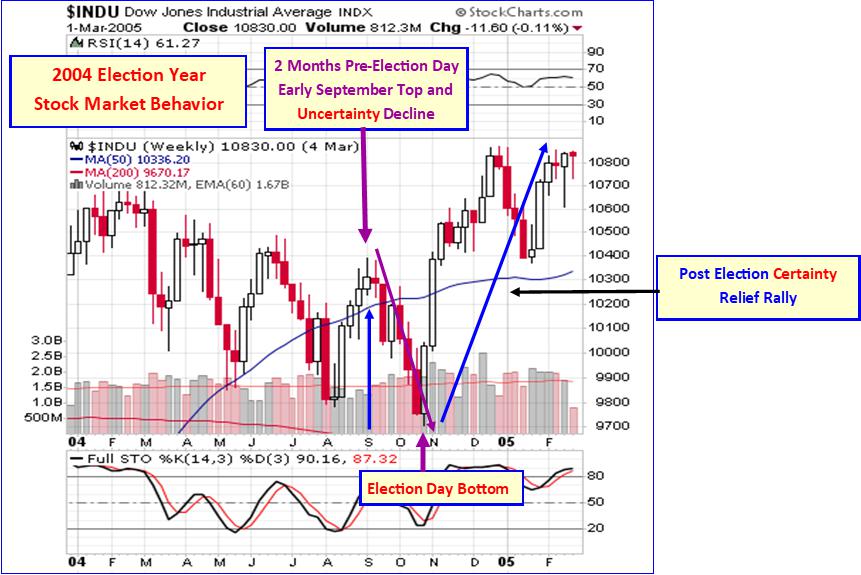
In both instances, market behavior was nearly identical. In 2004 and 2012, stocks rose into early September tops. Then from early September through election day, right up to election day, stocks fell sharply. In both years, stocks bottomed on election day, then rose sharply into the following March.
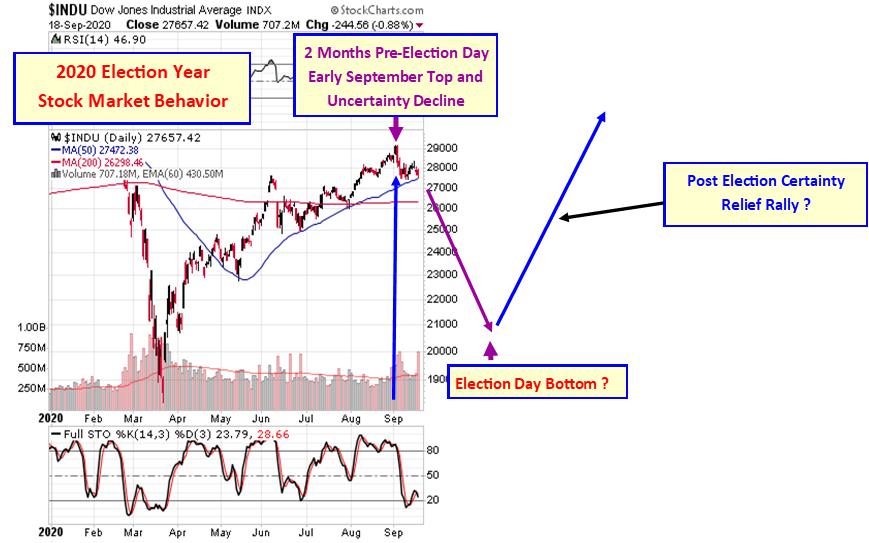
The same pattern appears to be occurring again now, in 2020. Since September 3rd, 2020, we have seen the Industrials drop 1,750 points. Since September 2nd, the NASDAQ 100 has lost 12 percent. Apple, Inc., which has a 13 percent weight within the NASDAQ 100, has crashed 22.5 percent since September 1st.
The next chart shows how the Industrials in 2020 are following the path we saw the last two times an incumbent President was up for reelection, another “Uncertainty” decline in formation:
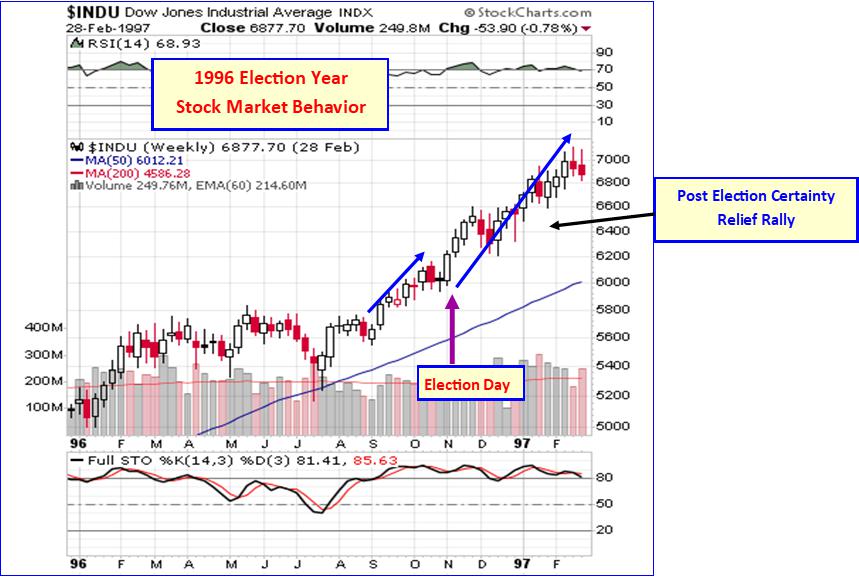
Now let’s consider the 1996 and 1992 elections when an incumbent was running for President. What happened then?
The next chart shows if this pattern occurred in 1996 when Clinton ran for reelection. In this case, the stock market rose into the election and rose out of the election. There was no “Uncertainty” decline from early September 1996 to November’s election day.
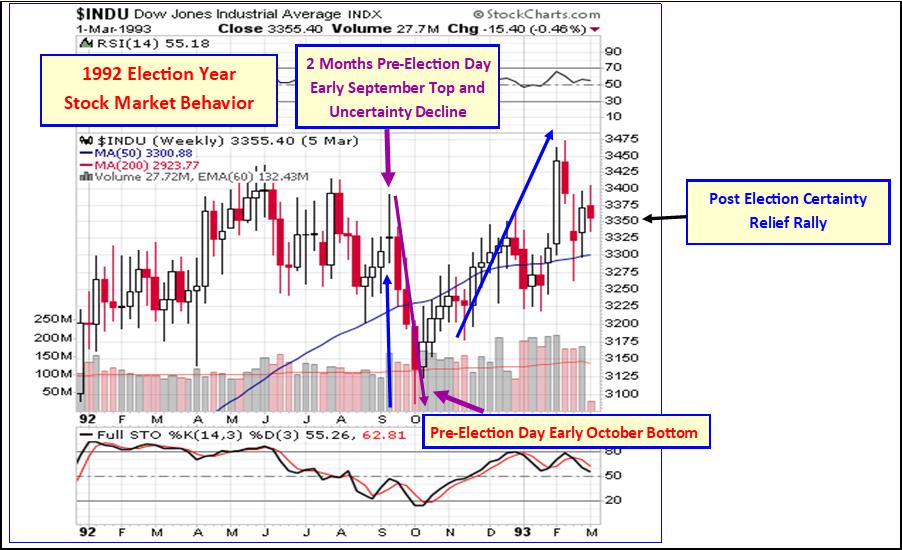
Then in the chart after that, we see that in 1992, when George H. Bush was running for reelection and lost to Clinton, the pattern did appear, but in a slightly different version. That year stocks topped in early September, as we saw in 2004 and 2012, then plunged into early October, but then rallied into the election. Post-election day 1992, we saw the pattern’s typical “Certainty” rally occur as was the case in the elections of 1996, 2004, and 2012.
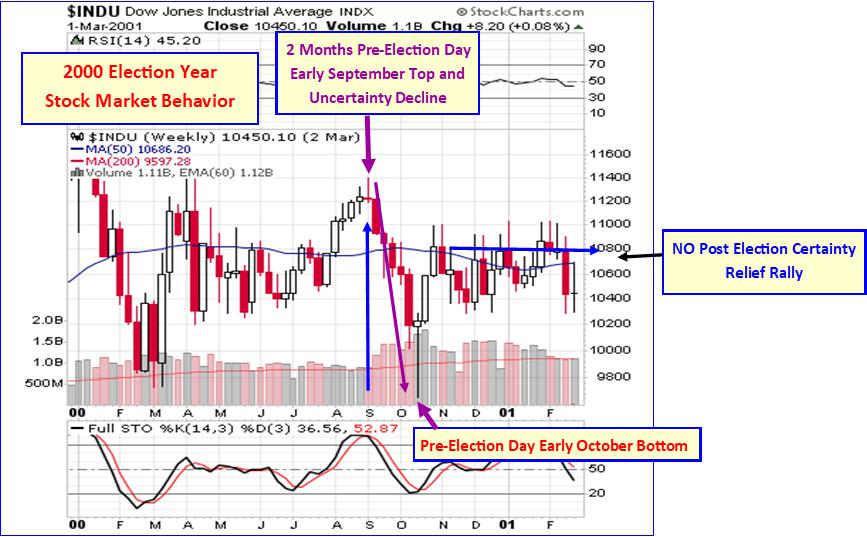
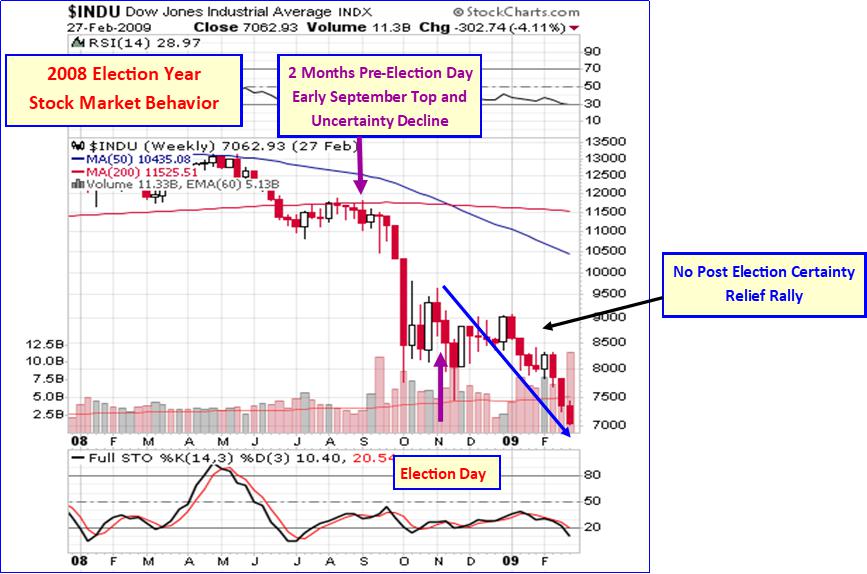
In the past three Presidential election years when there was no incumbent running for office, 2000, 2008, and 2016, there were no clear patterns.
In 2000, George W. Bush beat out Al Gore in a tight race that had an unclear outcome that was too close to call for several weeks while “hanging chads” were recounted in Florida, until Gore eventually conceded. In that year, we saw an early September top, then a stock market crash into mid-October, followed by a dead cat bounce into election day, but there was no post-election certainty rally.
In 2008, when Barack Obama was elected President, stocks plunged from early September highs, bottoming in late October, then bounced into election day. There was no post-election certainty rally, instead, stocks continued to plunge into March 2009 lows.
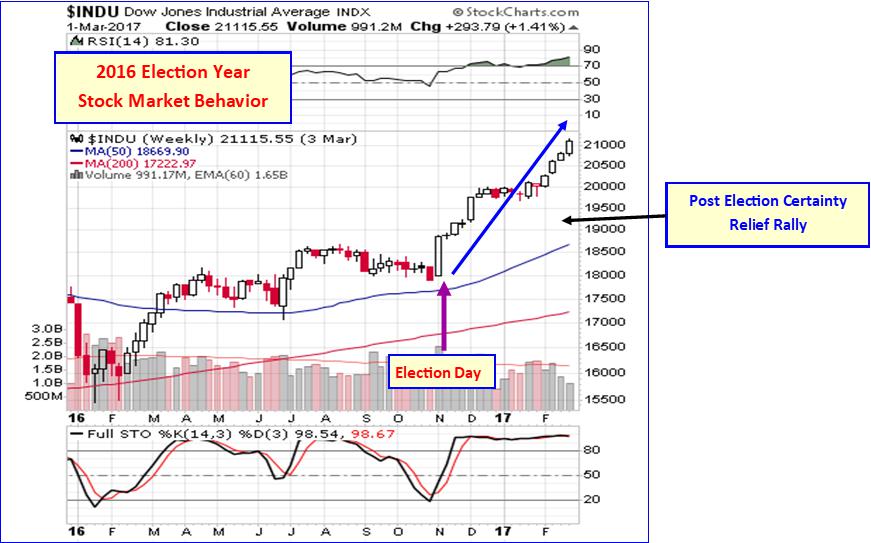
When Trump was elected in 2016. There was no pre-election plunge, instead we saw a modest decline from early September into Election day, but there was a post-election “Certainty” rally.
So, in conclusion, what we know is that of the past seven Presidential elections, we saw pre-election plunges starting in early September five of the seven elections. And we saw post-election “Certainty” rallies five of the seven elections. While there were many other price trend causal factors occurring during these election periods studied, interestingly, 71 percent of the time stocks plunged within the two months preceding a Presidential election, and rallied sharply 71 percent of the time immediately after election day, lasting several weeks.
At McHugh’s www.technicalindicatorindex.com we track the short-term waves that make up these larger degree trends, and chart them in our forecast newsletters, and have developed several proprietary Buy/Sell indicators that help us identify when the next significant move is starting for Gold, Silver and Mining stocks, and in which direction the move will develop. We publish these indicators in every Daily Newsletter to subscribers.
********
More from Gold-Eagle


