With Stocks And Debt Up 50X In 50 Years How Far Will They Collapse?


With stocks, bonds and property in major bear markets, investors are desperately hoping (and praying) that the Fed and other Central banks will come to their rescue. But this time it is different. (You have heard that before). Central banks are determined to kill off inflation and with that the economy. They will of course panic at regular intervals, just like the Bank of England recently did with their £65 billion emergency injection to save the pension funds and the gilt market.
But just like the bull market in stocks is turning into a long term bear market, the 40 year down trend in rates finished in 2021. As inflation rages around the world, the coming rapid rise in interest rates will not just shock investors. It will turn the global $300 trillion debt and the $2 quadrillion derivatives (mainly interest derivatives) into a lethal weapon of mass destruction.
Yes, Central banks will panic occasionally and lower rates. But the heavy weight of the debt will lead to both private and sovereign defaults and sell offs which will put continuous upward pressure on rates.
As the world enters the biggest economic and (geo)-political storm in history, few investors are prepared for the total annihilation of their wealth.
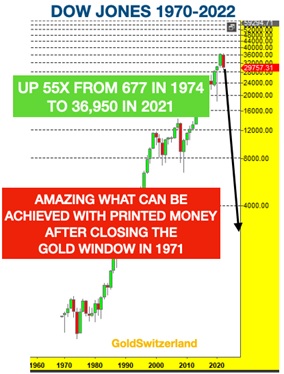
DOW UP 55X
In December 1974, the Dow bottomed at 677 and 47 years later the Dow peaked at 37,000 – an increase of 55X. With a compound annual growth of 9%, the Dow doubled every 8 years during this period.
WILL ALFRED LOSE ALL HIS MONEY
Let’s return to Alfred a US citizen who was born at the end of WWII, I wrote an article about him in February 2019 called “Stock Investors like Alfred to Lose 98% of their Investment”
Well, Alfred was very lucky throughout his investment life. By putting all his savings and excess earnings into the Dow Jones he managed to amass a fortune of $14 million until the end of February 2019. He was even more fortunate to see the US market gain another 45% (including dividends) until the end of 2021. So his wealth had by that time grown another $6 million to $20.3 million.
As I wrote in the 2019 article, Alfred never sold and sat through every vicious correction for 77 years. So until January 2022, buy and hold had worked like a dream.
By the end of the first week of October 2022 Alfred’s portfolio is down from $20.3 in January to $16.2 million which is a loss of $4.1 million in 2022.
Currently Alfred is not the slightest bit worried as he has seen many corrections of 20% to 60% in the last 77 years.
Based on his experience, Alfred is not concerned although $4 million is a big paper loss.
But what if the dream is over for Alfred and turns into a nightmare with all his gains evaporating in a market collapse of 90% or more like in 1929-32?
Well, in my view the odds are very high that we will see a fall of that magnitude.
A DEBT INFESTED WORLD
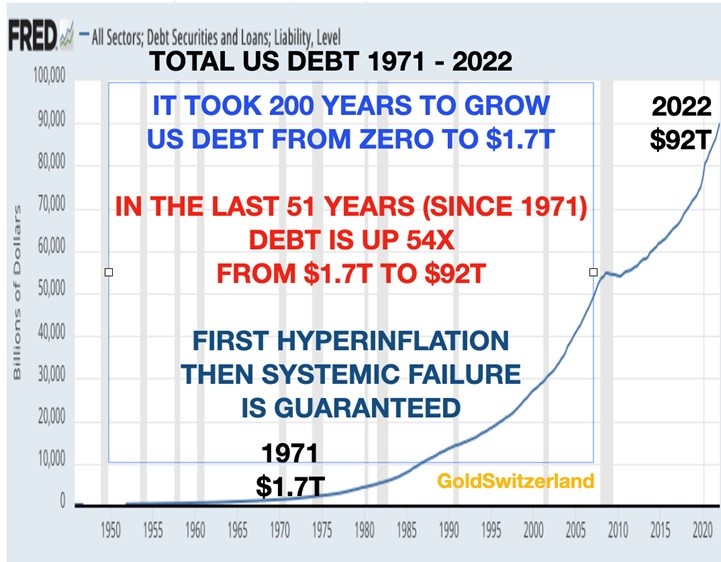
A debt infested world has lived on borrowed time since the debt feast started in 1971 when Nixon took the dollar, and therefore most currencies, off the gold standard.
And what a feast it has been with total US debt going from $1.7 trillion in 1971 to $92 trillion today.
That is a staggering 54X increase in US debt in 52 years!
Just look at the Dow Jones chart at the beginning of the article which shows a 55X increase in the index during the same time period.
It is clearly no coincidence that stocks are up 54X and debt 55X since the early 1970s
Stocks have not risen due to a sound and well managed economy. No, stocks only went up because printed money was handed to investors to inflate the economy and asset prices.
We must remember that during the same period since 1971 when the gold window was closed that the US dollar has lost 98% of its value in real terms.
Thus the debt explosion has created inflated values which will deflate much faster when the debt implodes in the next few years.
So it took 200 years to go from zero debt to $1.7t. But when you remove the shackles of the monetary discipline that the gold standard enforces, irresponsible and incompetent governments and central bankers only have one objective. Their principal policy is to hang on to power for as long as possible.
When money runs out, like it did in 1971, there is only one way to stay in power and that is to buy votes. Thus the creation of $90 trillion debt since 1971 has been the most expensive bribery in history.
We must also remember that US Federal debt has increased every year since 1930 (with only a handful of years with surpluses).
The dilemma of creating money out of thin air of such a magnitude is that it leads to debts that can never be repaid, fake asset values which will implode and false human values resulting in misery and decadence. The inevitable consequences are economic and financial collapse. And that sadly is what the US and the world is facing next.
So what will be the market consequences of the coming (hyper)-inflationary depression followed by a deflationary implosion?
Let’s look at some enlightening charts:
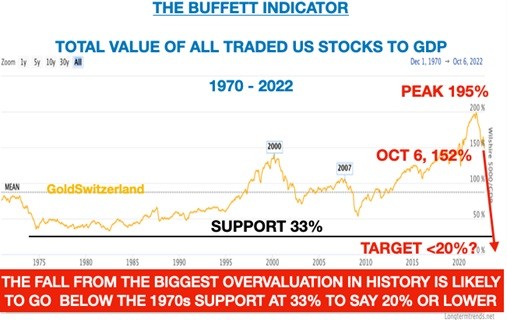
1. THE BUFFETT INDICATOR – VALUE OF STOCK MARKET TO GDP
The total value of US stocks (Wilshire 5000) to GDP is one of Warren Buffett’s favourite indicators. It reached almost 200% in November 2021. The previous record valuations were 140% in 2000 (Dot Com Bubble) and 106% in 2007 (Sub Prime Crisis). A strong support area is the lows in the1970s at around 33%.
I doubt however that the 1970s support will hold after the Epic mega bubble we have just seen totally fuelled by tens of trillions of exploding dollar debt.
Especially since 2009, the debt intoxication of investors has driven stocks to dizzy heights which is likely to result in a hangover that will not only take years but probably decades to recover from.
So poor Alfred, this is not what he needed at the tail end of his investment life. But sadly he like most investors don’t know better since the Fed until now has saved them.
2. PRICE EARNINGS RATIO – BOTH PRICE AND EARNINGS TO DECLINE
I remember well when I moved to the UK in 1972 and worked for Dixons first as Finance Director and later as Vice-Chairman. Dixons was a camera and audio/TV retailer at the time, quoted on the London stock exchange. I received my first options at £1.32.
Two years later after an oil crisis in the Middle East and a coal miners’ strike in the UK (with only 3 days of electricity) stocks crashed across the globe. Dixons’ share price collapsed from 132 English pence to 10 pence. So my options were 93% out of the money!
Dixons had a strong balance sheet and was still profitable. But profits declined by around 75%. (It wasn’t easy to demonstrate TVs and HIFI in candle light.)
So Dixons’ earnings per share of 6.6 pence in 1972 went down by 75% to 1.6 pence and the PE ratio went from 20 to 6. That was the best lesson I ever learnt to as a young man to experience what can happen to markets. Anyway, I then joined the board at 29 and we went on to build the business to the biggest consumer electronics retailer in the UK and a FTSE 100 company.
Most investors today, including Alfred, would not believe that the shares of a successful company can decline as much as 93% but I was fortunate to experience this when I was young and did not have much to lose.
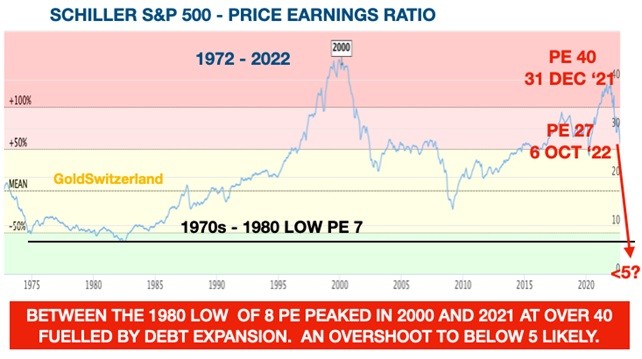
So as the debt bubble fuelled market collapses from a historical and epic uber-valuation, I would would not be surprised to see the S&P PE ratio to undershoot the 7 level in 1980 and go below 5 as shown in the chart above.
3. DOW / GOLD RATIO TO GO TO HISTORICAL LOWS
Since the gold window was closed in 1971, the fluctuations in the Dow/Gold ratio have been dramatic. This is what can be expected when most of the gold trading takes place in a heavily manipulated paper market. The whole false financial system based on worthless paper assets is now under tremendous pressure.
For example, the UK’s mini-budget two weeks ago led to a massive decline in the pound and a near collapse of the UK bond market. The bank of England, at the request of pension funds, had to support the bond market to the extent of 65 billion pounds.
This shows the fragility of markets today when a relatively minor event can lead to a near collapse of the UK financial system and therefore also the global system, since everything is connected.
The problem was as expected in the $2 quadrillion derivative market which had been used to hedge interest risk by the pension funds. Virtually every financial instrument traded today includes a major element of derivatives.
So when we look at the Dow/Gold Chart we must bear in mind that most of the trading in the Dow and Gold is in derivatives and that by a multiple of many 100 times.
The Dow/Gold ratio was at 1 in 1980 which means that the Dow was 850 and gold $850. The ratio then reached a peak in 1999 as gold fell and the Dow was strong. Since then the ratio has gone down to 17 or 62%. This means that gold has strongly outperformed the Dow.
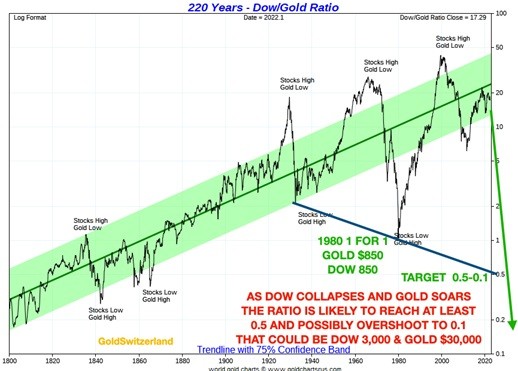
If the Dow goes down by over 90% like in 1932, we would expect the ratio to reach the support of 0.5 which means for example 3500 Dow and $7,000 gold.
But the current massive over valuation of stocks and undervaluation of gold is likely to take the ratio to the 0.2 level of the early 1800s and even overshoot.
As the gold paper market collapses, and gold can trade freely but with massive physical demand and very little gold available, I would not be surprised to see a 0.1 ratio. That could lead to 3,500 Dow and $35,000 gold.
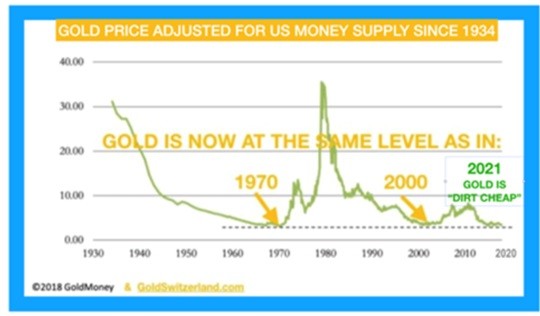
That gold price would also more accurately reflect the massive growth in money supply as gold today is massively under valued in relation to the growth in US money supply as the chart below shows.
FORECASTNG IS A MUG’S GAME
By definition, a forecast will always be wrong. Only future historians will give the world the correct retrospective forecast since hindsight is the most perfect of all sciences.
Thus the above projections are just an indication where the biggest global bubble asset market in history could implode to when things go really wrong – which I fear they will do.
The most important thought I would like to leave investors with is that risk is today at a historical extreme.
Therefore today is not the time for greed, hoping that markets will grow to the sky. Instead, now is the time for wealth preservation and protecting what you have. Otherwise, wealth which has been acquired over several decades could easily evaporate in the next few years.
Physical gold and silver have throughout history acted as the ultimate insurance of wealth. This time will not be different.
Courtesy of Gold Switzerland.
********
 Egon von Greyerz – Founder and Managing Partner of Matterhorn Asset Management (MAM) and GoldSwitzerland based in Zurich. Egon forecasted the present problems in the world economy already in 2002 when he recommended to investors to allocate 50% of assets into physical gold (at $300) stored outside the banking system. Egon began as a banker in Geneva and was thereafter Finance Director and Vice-Chairman of a FTSE 100 company in the UK. He makes regular media appearances on CNBC, BBC and King World News and speaks at investment conferences around the world. MAM (founded in 1999), specialises in wealth preservation. GoldSwitzerland buys, sells, transfers and stores physical precious metals for private investors and institutions outside the banking system. His website is www.goldswitzerland.com.


