T-Bonds Suggest Increased QE


There are numerous measurements of the supply of money, and the Federal Reserve Bank of St. Louis has charts for most of them.
These charts should be of particular interest to gold price enthusiasts, because they can indicate whether deflation or inflation is the major theme in play.
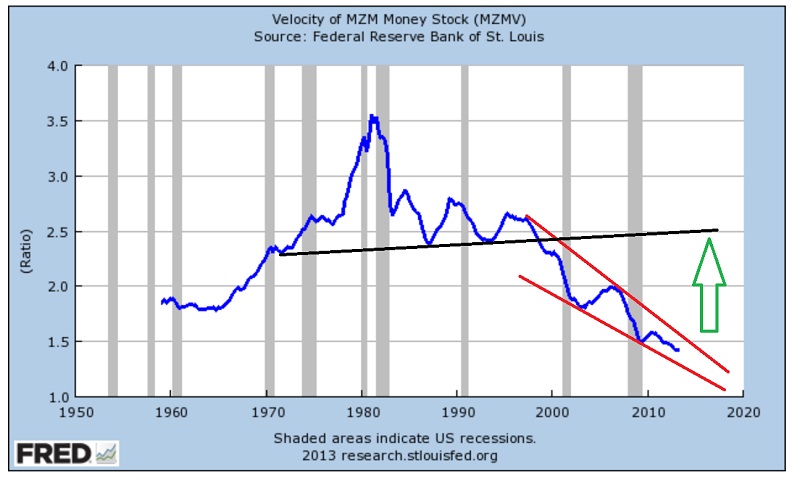
This “MZM” (Money Zero Maturity) chart is especially interesting, because it excludes large time deposits.
MZM is a comprehensive money supply measure designed to represent money that is immediately available for spending by consumers, and it has been declining since gold peaked in 1980.
Please note the red bullish wedge pattern that I've highlighted. I believe it is hinting that three decades of “deflationary rule” may be be coming to an end.
Even with that wedge in place, it's likely going to take some time for the transition from deflation to inflation to occur, mainly because so mainly OTC derivative contracts were marked to “model” during the 2008 – 2009 economic collapse.
It's almost impossible for regular investors to get much accurate information about the quantity of OTC derivatives debt that still exists, and how much has been marked to market, by the Fed and the large commercial banks.
In the meantime, it's very important for gold investors to focus on key intermediate term highs on the gold chart. Gold may or may not have bottomed in the $1180 area, but until it rises above some of these highs, there is no real uptrend in play.
The late August highs in the $1430 area must be exceeded before the current price action can be called a real uptrend.
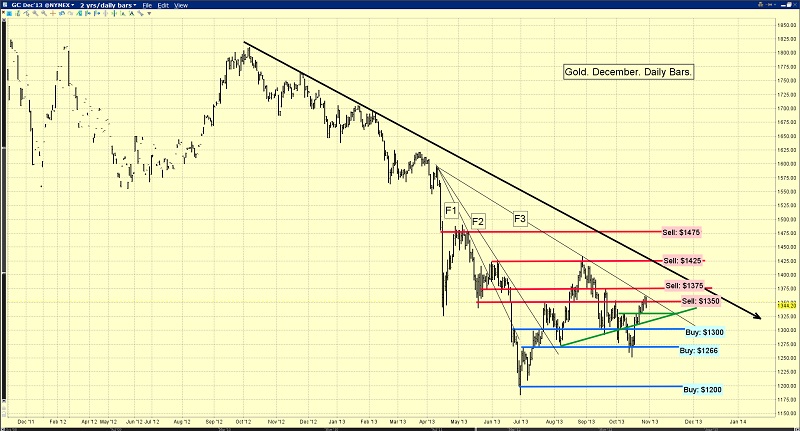
You are viewing the daily gold chart. Note the fan lines marked F1, F2, and F3.
If gold can get above the F3 line, it has a chance of rallying to challenge the key $1430 area highs, and defining the price action as an uptrend.
In terms of short term tactics, I've recommended that investors carry a seller's mindset in the $1350 area, and a buyer's mindset at $1266.
Round number fans should now focus on placing buy orders in the $1300 price zone. The $1375 - $1400 area is where sell orders could be placed.
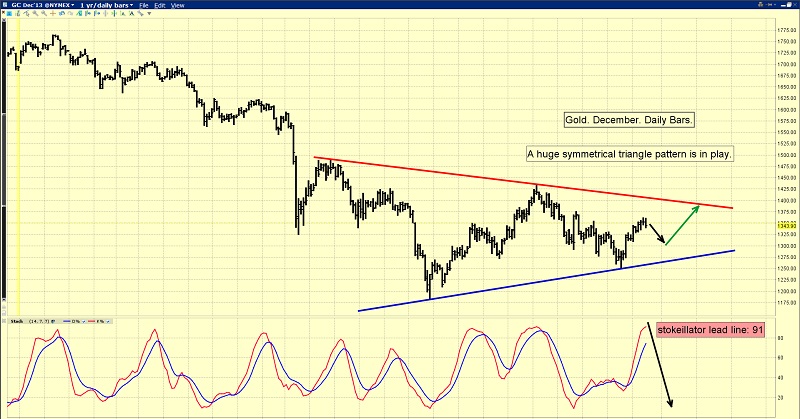
Here's another view of the daily gold chart. A lot of technicians have tried to call “the bottom” for gold, and some of them believe an “inverse head and shoulders” pattern has formed on the chart, which should produce much higher gold prices fairly soon.
Unfortunately, I don't think that pattern exists anymore, and if it does, it's very weak. Instead, what I see on the gold chart is a gigantic symmetrical triangle. These patterns typically consolidate the existing intermediate trend, which in this case is down.
Having said that, charts are created by fundamental events, and tensions between Israel and Iran are increasing again.
I have a very hard time envisioning gold falling very much, given the fundamental backdrop of the Indian Diwali festival and this surge in Mid-East tension.
My stokeillator (14,7,7 Stochastics series) is in “nosebleed” territory, but I use this indicator to predict trends that last for only very short periods of time (1 – 4 weeks).
Any sell-off in gold in the short term should be quite mild. If the symmetrical triangle turns out to be a reversal formation, rather than a consolidation, the upside target is about $1680. That is a number that should put a serious smile on the faces of most gold investors!
Some analysts wonder if falling energy prices could cause gold prices to begin a fresh decline. Oil prices have softened over the past couple of weeks, but there is substantial support in the current price area.
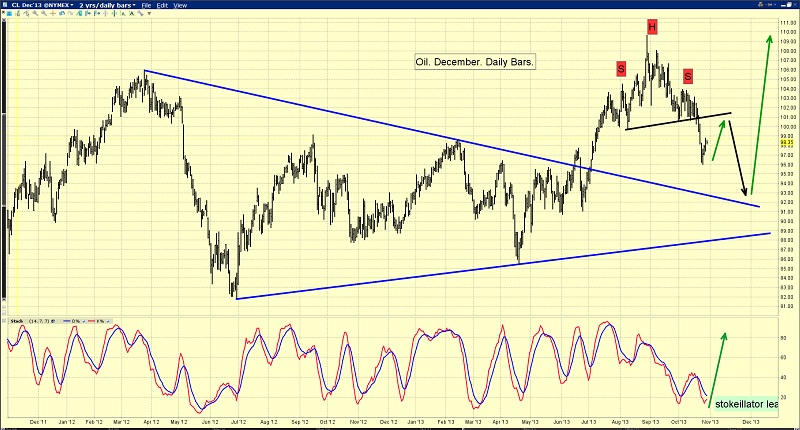
That's the daily oil chart. There is a head and shoulders top pattern in play, but there's a larger symmetrical triangle that should lift prices higher. Also, many large oil market players are probably reluctant to short oil now, because of the important Iran-Israel dispute.
As long as quantitative easing is in place, higher T-bond prices are likely to produce higher gold prices, and the long term T-bond chart is currently flashing many technical buy signals.
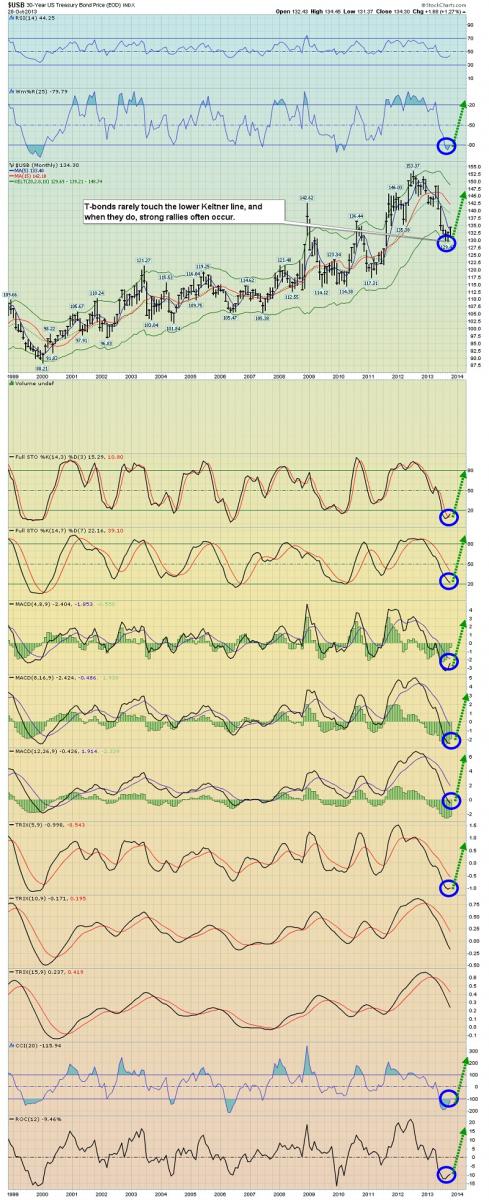
This monthly chart shows that T-bond prices have touched the lower Keltner band, and many oscillators are exhibiting crossover buy signals. Even if there is a very short term sell-off, I think T-bonds are set to drive gold prices higher. I believe there will be an upside breakout from the large symmetrical triangle pattern that I showed you on the gold chart. The T-bond chart is bullish enough to suggest that rather than tapering QE, the Fed may soon increase it.
What effect would increased QE and a higher gold price have on gold stocks?
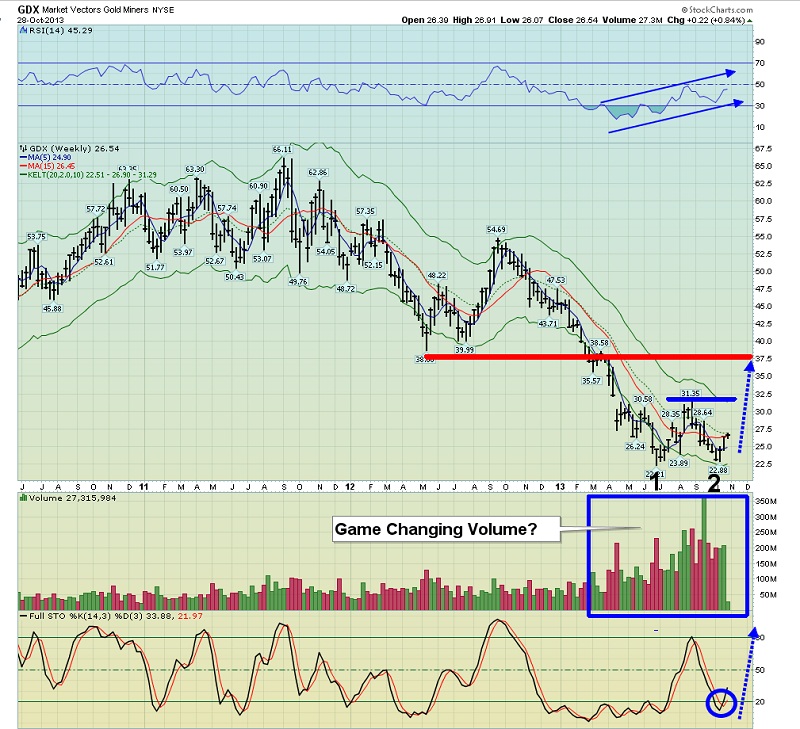
That's the weekly GDX chart, and it looks spectacular. Note the “game changing” volume and the bullish action of the RSI and Stochastics oscillators. There's also a significant double bottom pattern in play, and the technical target is the $38 area!
********
Special Offer For Gold-Eagle Readers: Send an Email to [email protected] and I'll send you my free “Top 3 Takeovers” report! I'll show which 3 junior gold stocks I believe are most likely to be taken over by a larger company, which could create an enormous price surge in these stocks.
Note: We are privacy oriented. We accept cheques. And credit cards thru PayPal only on our website. For your protection. We don’t see your credit card information. Only PayPal does. They pay us. Minus their fee. PayPal is a highly reputable company. Owned by Ebay. With about 160 million accounts worldwide.
Email: [email protected]
Rate Sheet (us funds):
Lifetime: $799
2yr: $269 (over 500 issues)
1yr: $169 (over 250 issues)
6 mths: $99 (over 125 issues)
To pay by cheque, make cheque payable to “Stewart Thomson”
Mail to:
Stewart Thomson / 1276 Lakeview Drive / Oakville, Ontario L6H 2M8 Canada
Stewart Thomson is a retired Merrill Lynch broker. Stewart writes the Graceland Updates daily between 4am-7am. They are sent out around 8am-9am. The newsletter is attractively priced and the format is a unique numbered point form. Giving clarity of each point and saving valuable reading time.
Risks, Disclaimers, Legal
Stewart Thomson is no longer an investment advisor. The information provided by Stewart and Graceland Updates is for general information purposes only. Before taking any action on any investment, it is imperative that you consult with multiple properly licensed, experienced and qualifed investment advisors and get numerous opinions before taking any action. Your minimum risk on any investment in the world is: 100% loss of all your money. You may be taking or preparing to take leveraged positions in investments and not know it, exposing yourself to unlimited risks. This is highly concerning if you are an investor in any derivatives products. There is an approx $700 trillion OTC Derivatives Iceberg with a tiny portion written off officially. The bottom line:
Are You Prepared?
 Stewart Thomson is president of Graceland Investment Management (Cayman) Ltd. Stewart was a very good English literature student, which helped him develop a unique way of communicating his investment ideas. He developed the “PGEN”, which is a unique capital allocation program. It is designed to allow investors of any size to mimic the action of the banks. Stewart owns GU Trader, which is a unique gold futures/ETF trading service, which closes out all trades by 5pm each day. High net worth individuals around the world follow Stewart on a daily basis. Website: www.gracelandupdates.com.


