Take Advantage Of Volatility With Active Management


October was at it again last week. After Wednesday’s close, the S&P 500 Index, Dow Jones Industrial Average and small-cap Russell 2000 Index had all erased their gains for 2018, while the tech-heavy NASDAQ Composite dipped into correction territory.
I don’t believe there’s any single cause for the selloff. Investors are simply nervous, thanks to rising interest rates and the upcoming midterm elections, among other things.
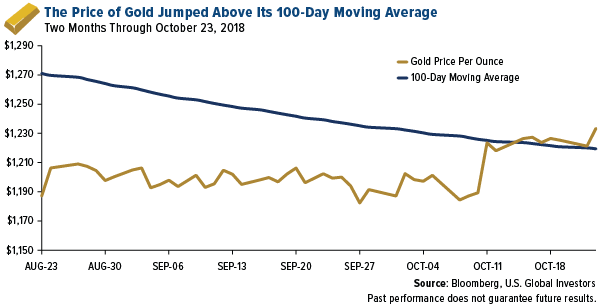
Meanwhile, gold performed precisely as we would expect it to. The price of the yellow metal jumped above its 100-day moving average, a bullish sign that could mean further moves to the upside if market volatility persists. On Friday, gold was trading at a three-month high of $1,246 an ounce.
So can we expect additional volatility going forward? In a recent note to investors, Citibank says it estimates that “some more volatility is likely through December” due to the impact of trade disputes on growth, rise in U.S.-Saudi Arabia tensions and Brexit stalemate. Analysts point out, though, that the present slowdown doesn’t necessarily signal the end of the historic bull market. Compared to the start of the previous two bear markets, in 2000 and 2007, only four out of 18 factors are flashing “sell” right now on Citi’s “bear market checklist.” Among those factors are overinflated global equity valuations, a flattening yield curve and high debt levels.
The bull is “tripping, not dying,” Citi says.
But Is It the End of “Buying the Dip”?
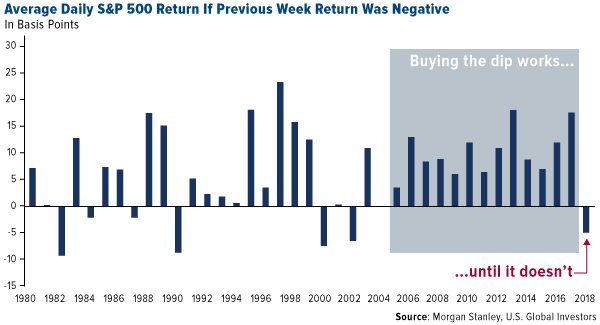
The bull market might not be dead, but we could be facing the end of “buying the dip.” According to a report last week by Morgan Stanley, buying the S&P 500 after a week of negative returns was a profitable strategy from 2005 through 2017. That may no longer be the case, as you can see in the chart below. Buying the dip in 2018 has resulted in an average loss of around 5 basis points.
So what’s changed? I think the most significant difference between now and the past decade or so is that, for the first time since the financial crisis, central banks are finally starting to withdraw liquidity. This means cheap money is no longer as plentiful as it once was, for investors and corporations alike.
Some might disapprove of President Donald Trump’s criticism of Federal Reserve Chairman Jerome Powell for raising rates—Powell “almost looks like he’s happy raising interest rates,” Trump said—but he’s not wrong in expressing concern about the ramifications. I’ve shared with you before that a majority of recessions and bear markets in the past 100 years were preceded by monetary tightening cycles.
And there could be something else roiling markets right now.
Get Ready for $7.4 Trillion in Passive Index Selling
Last month I wrote about what I see as an imminent “passive index meltdown.” Over the past decade, billions of dollars have poured into ETFs and other passive investment products. This has led to a number of unexpected consequences, including price distortion and trading based not on fundamentals but on low fees. I said then that when these multibillion-dollar ETFs automatically rebalance, sometime at the end of this year or the beginning of next year, a correction of between 10 percent and 20 percent could be triggered.
Now, other people are starting to recognize the risk this poses. Speaking to CNBC last week, Goldman Sachs CEO David Solomon said that this month’s selloffs have been prompted by “programmatic trading.”
According to Solomon, “some of the selling is the result of programmatic selling because as volatility goes up, some of these algorithms force people to sell.”
Remember the 2010 Flash Crash? In the days following the May 6 incident, the Securities and Exchange Commission (SEC) and Commodity Futures Trading Commission (CFTC) found that ETFs “suffered a disproportionate number of broken trades relative to other securities.” Of the securities that fell 60 percent or more that day, approximately 70 percent were ETFs.
But that was in 2010. Passive investing accounted for less than 30 percent of the assets under management (AUM) in actively managed funds. Today, that figure falls somewhere between 80 percent and 90 percent, representing some $7.4 trillion in “big selling pressure” concentrated in large- to small-cap equities, according to a report last week by J.P. Morgan.
“This is something worth noting at this late stage of a cycle given that passive investing seems to be trend following, with inflows pushing equities higher during bull markets, and outflows likely to magnify their fall during correction,” J.P. Morgan analysts Eduardo Lecubarri and Nishchay Dayal wrote.
The asset class with the greatest exposure to passive indexing, and therefore “momentum selling during market downturns,” is large-cap stocks, which have 10 times the passive AUM as small- and mid-cap stocks.
So how can investors prepare themselves?
Look at How Much Ultra-Short Treasuries Are Yielding Now
With riskier assets starting to look shaky, it might be time to ensure you have an adequate position in fixed income.
For the first time in over a decade, the three-month Treasury bill—the closest proxy we have for hard cash—is yielding more than the three main measures of U.S. inflation. That includes the headline consumer price index (CPI), which measures volatile food and energy prices. Bond yields and prices move inversely to interest rates, remember.
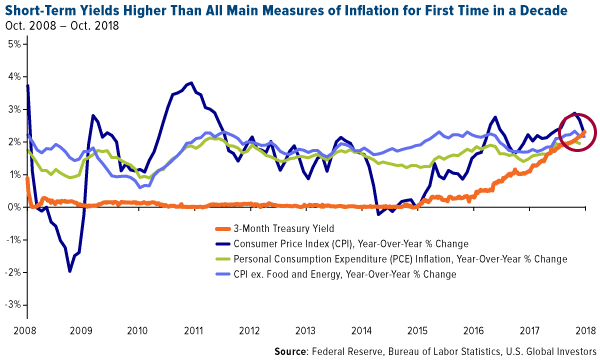
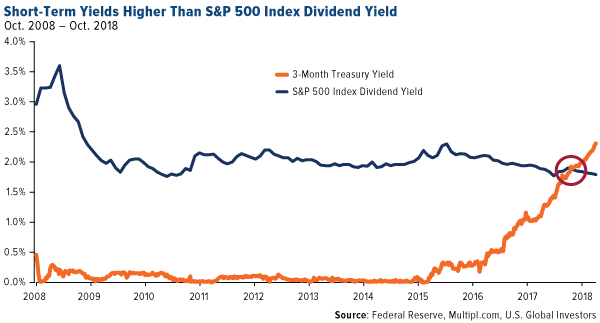
Ultra-short yields stood at 2.34 percent as of Friday, compared to a 2.27 percent change in consumer prices over the same period last year. This means that cash is finally yielding a positive real return for the first time in over 10 years, without inflation having to turn negative.
What’s more, the three-month yield is well above the dividend yield for the much more volatile S&P 500 Index.
With interest rates on the rise, it’s important to stay on the short end of the yield curve. Retail investors seem to agree. Last month, rate-sensitive investors poured more than $4.7 billion into actively managed ultra-short bond funds, which have an average maturity of just six months, according to Morningstar data.
Passive instruments are attractive because of low fees, but it’s important not to discount actively managed funds just yet, and especially now as volatility is spiking. As Wells Fargo put it in the most recent Monthly Market Advisor, “late-cycle market characteristics could present many opportunities for investors who hold quality actively managed funds.”
*********
All opinions expressed and data provided are subject to change without notice. Some of these opinions may not be appropriate to every investor. By clicking the link(s) above, you will be directed to a third-party website(s). U.S. Global Investors does not endorse all information supplied by this/these website(s) and is not responsible for its/their content.
The S&P 500 Index is a widely recognized capitalization-weighted index of 500 common stock prices in U.S. companies. The Dow Jones Industrial Average is a price-weighted average of 30 blue chip stocks that are generally leaders in their industry. The Russell 2000 Index is a U.S. equity index measuring the performance of the 2,000 smallest companies in the Russell 3000. The Russell 3000 Index consists of the 3,000 largest U.S. companies as determined by total market capitalization. The Nasdaq Composite Index is a capitalization-weighted index of all Nasdaq National Market and SmallCap stocks.
The Consumer Price Index (CPI) is one of the most widely recognized price measures for tracking the price of a market basket of goods and services purchased by individuals. The weights of components are based on consumer spending patterns. The personal consumption expenditure measure is the component statistic for consumption in gross domestic product collected by the United States Bureau of Economic Analysis. It consists of the actual and imputed expenditures of households and includes data pertaining to durable and non-durable goods and services.
The dividend yield is a financial ratio that indicates how much a company pays out in dividends each year relative to its share price. There is no guarantee that the issuers of any securities will declare dividends in the future or that, if declared, will remain at current levels or increase over time.
A basis point, or bp, is a common unit of measure for interest rates and other percentages in finance. One basis point is equal to 1/100th of 1%, or 0.01% (0.0001).
*********
U.S. Global Investors, Inc. is an investment adviser registered with the Securities and Exchange Commission ("SEC"). This does not mean that we are sponsored, recommended, or approved by the SEC, or that our abilities or qualifications in any respect have been passed upon by the SEC or any officer of the SEC.
This commentary should not be considered a solicitation or offering of any investment product.
Certain materials in this commentary may contain dated information. The information provided was current at the time of publication.
 Frank Holmes is the CEO and Chief Investment Officer of U.S. Global Investors. Mr. Holmes purchased a controlling interest in U.S. Global Investors in 1989 and became the firm’s chief investment officer in 1999. Under his guidance, the company’s funds have received numerous awards and honors including more than two dozen Lipper Fund Awards and certificates. In 2006, Mr. Holmes was selected mining fund manager of the year by the Mining Journal. He is also the co-author of “The Goldwatcher: Demystifying Gold Investing.” Mr. Holmes is engaged in a number of international philanthropies. He is a member of the President’s Circle and on the investment committee of the International Crisis Group, which works to resolve conflict around the world. He is also an advisor to the William J. Clinton Foundation on sustainable development in countries with resource-based economies. Mr. Holmes is a native of Toronto and is a graduate of the University of Western Ontario with a bachelor’s degree in economics. He is a former president and chairman of the Toronto Society of the Investment Dealers Association. Mr. Holmes is a much-sought-after keynote speaker at national and international investment conferences. He is also a regular commentator on the financial television networks CNBC, Bloomberg and Fox Business, and has been profiled by Fortune, Barron’s, The Financial Times and other publications. Visit the U.S. Global Investors website at http://www.usfunds.com. You can contact Frank at: [email protected].


