Take It To The Bank: Interest Rates Won't Rise


How Not To Predict Interest Rates
We continue our hiatus from capital destruction to look further at interest rates. Last week, our Report was almost prescient. We said:
The first thing we must say about this is that people should pick one: (A) rising stock market or (B) rising interest rates. They both cannot be true (though we could have falling rates and falling stocks).
We write these Reports over the weekend. At the time of last week’s writing session, Friday’s close on the S&P was 2757 (futures). Monday this week saw a crash, with the S&P down to 2529 at the low point in the evening. That is a drop of -8.3%.
We are not stock prognosticators, and we will neither tell you “short the market” nor “buy the dip”. We have a different point to make.
Rising interest rates, by a variety of mechanisms, cause stocks and all asset prices to go down. We have touched on a few in this Report. One is that investors have a choice between the risk-free asset—the Treasury bond—and anything else (note: the Treasury bond is not risk free, but if it defaults then everything else will be wiped out in the collapse). Why would they accept a lower yield on stocks along with the greater risk? Another is that corporations can borrow to buy their own shares. Management may do this if the interest rate is lower than their shares yield. But they can sell shares to pay off debt if the shares have lower yield than the interest rate.
Let’s look at a few more.
Consider home buyers. It is well understood that most people are monthly payment borrowers. That is, they have a budget for the mortgage payment and fit the house to that budget. If the typical middle class family can afford $2,500 a month, that’s it. When the 30-year fixed mortgage rate was 3.4% in 2013, this family could afford to finance $565,000. Today, at 4%, the amount is down to $525,000.
Interestingly, the 30-year mortgage rate illustrates our ongoing theme. Demand for credit is soft. In a time when 12-month LIBOR was under 0.8%, the 30-year mortgage rate was 3.4%. Now that LIBOR has risen to 2.3%, a gain of 1.5%, the 30-year mortgage is going for 4%, or only 0.6% higher. If the mortgage had increased by the same 1.5%, it would be 4.9% and this family would be down to financing $472,000.
And it gets worse. In a falling rates environment, many people take Adjustable Rate Mortgages (ARMs) with a balloon payment at the end, which is another form of duration mismatch. So the relevant 2013 comparison is not 3.4% but 2.6%. At 2.6%, someone willing to use an ARM—we will call him the marginal home buyer—could finance $625,000.
In rising rates environment, we assume that most people will want to fix their mortgage rate. And now there is a consensus, from Fed propagandists to the gold bugs and everyone in between. Everyone thinks that rates are rising. So the relevant comparison for amount financed between 2013 and today is $625,000 to $472,000, a drop of -24%.
Let’s move on to the automakers. At least in the US (we don’t know if this occurs in other countries), they are advertising 0% to finance a new car for 72 months. Of course, the carmakers cannot borrow for free. Let’s assume they are playing the duration mismatch game, and using 1-year maturities, because it’s a lower rate. The disadvantage of financing a 6-year loan with a 1-year liability is that you must roll the liability five times, on each anniversary. The advantage is that the rate is lower.
In any case, their cost of borrowing has increased substantially. In late 2014, 1-year LIBOR was 0.56%. It has risen relentlessly since the end of 2014. Today, it is 2.31%, a gain of +1.8%. This adds $18 million a year of cost, for every billion financed.
Ford sales for the last 12 months are over $150 billion. Even if a quarter of their sales were financed this way, the increase in cost of borrowing over the last three years is $690 million. That covers a year’s worth of sales. But since the company has to carry this debt for up to 6 years, assume annual increase in interest expense is double that (it would be complicated to calculate and we would need more information, but double seems conservative), or $1.38 billion.
Rising interest has added costs which are a big in relation to the automakers’ annual profits, Ford makes around $5 billion a year.
This situation—rising rates to the car companies, but zero interest to consumers—helps proves our case that we are in a falling-rates regime. A falling rates dynamic has soft demand for credit, which increases only when the interest rate ticks down.
The car companies rightly fear what would happen to sales volume if they tried to pass through even just the increase in the cost of borrowing. If they offered 1.8% financing, they would sell fewer cars. Many fewer.
If the rate ticked down enough for them to offer financing at -1%, then that would really boost sales!
This same thing is playing out in all consumer durables, from four-wheelers, to furniture, to boats, to kitchen cabinets.
And likely in commercial real estate. When a landlord finds a creditworthy tenant who is willing to sign a 5-year lease, the landlord may spend some money building out the space to the tenant’s needs. The cost of this has to be amortized in the rent. How much should the landlord be willing to spend, and how does the landlord calculate amortization? A higher interest rate means it’s harder to subsidize the cost of accommodating the tenant’s needs. But if there is a high vacancy rate, the landlord may be caught between a rock and a hard place. Either don’t do it, leave the space empty, and default on the mortgage. Or do it, add to the monthly debt service burden, and risk default—in hopes of increasing the chance of finding other tenants for the other empty spaces in the building.
The rising cost of borrowing is squeezing landlords, making them less willing (and able) to borrow more for new projects.
Now let’s get back to that most people expect rates to rise. Last week, we discussed the causes and effects of the rising cycle (which last occurred 1947-1981) and the present falling cycle since 1981. We said it would take either a miracle or a calamity to reverse and cause a rising cycle. A miracle would be rising productivity and rising profits. A calamity would be rising time preference. And rising rates would cause a calamity—a cascading series of defaults.
However, the idea of rising rates persists. One idea we have seen discussed this week is the effect of rising debt. Massive growth in the national debt is likely coming to America, thanks to a deal between the party of spend more and the party of tax less. This will likely cause an increase in money supply. Because of this, it is argued, interest rates must rise.
Let’s look at that. Here is a graph of the M2 money supply and US government debt along with the interest rate on the 10-year Treasury (all data courtesy of the St Louis Fed).
For this time period, we see that M2 and debt are highly correlated, and anti-correlated with interest. We have indexed debt and M2 as we are only trying to show the correlation.
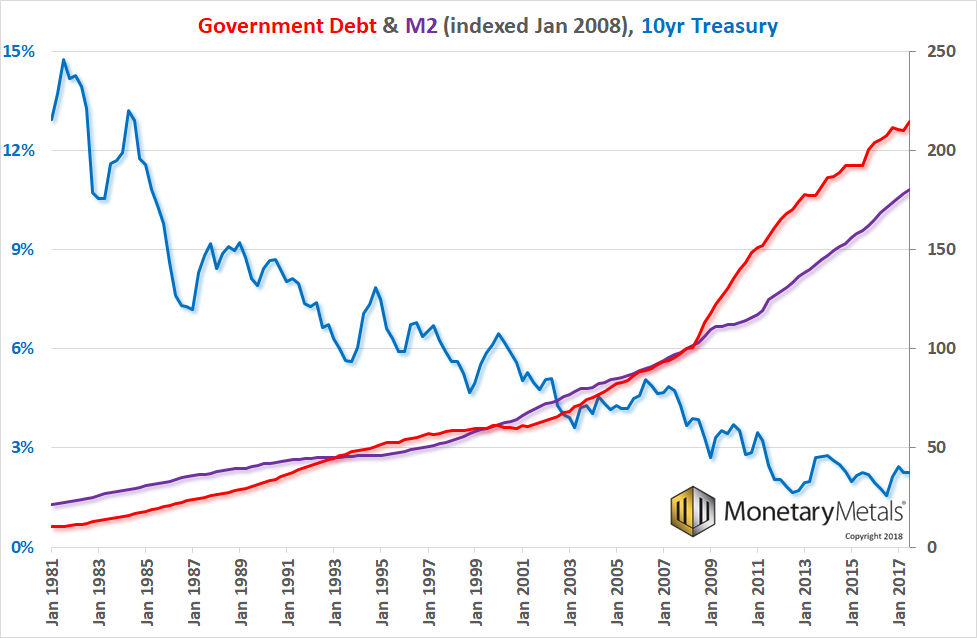
We went back only to 1981, not because it’s the start of the current falling rates cycle, but because the data does not go back farther. If we had looked 1947 to 1981, we would see debt going from $258 billion to $998 billion, an increase of 287%. At the same time, M2 went from $146 billion to $1.8 trillion (courtesy econdataus.com), or 1,133%. Due to a change in sources in this data set, the change could be overstated by perhaps 400%.
The point remains, the rising cycle and the falling cycle both have rising government debt and rising quantity of dollars. That’s just how a centrally banked fiat currency works. It’s a feature, not a bug. But it does not always have rising rates. It can have—and does right now—falling rates.
Therefore, we emphasize our conclusion. You cannot say that rising debt or rising quantity of dollars will cause rising interest rates. Rising debt/M2 has not correlated with interest rates for 37 years.
If you think that as of 2018 a new correlation will begin, we encourage you to describe your theory. And please write to us. We would love to look at a new theory.
The above ideas are an application of Keith's Theory of Interest and Prices in Paper Currency.
Geocentric vs Heliocentric
Before Copernicus, people believed that the sun and planets revolved around the Earth. But it was pretty complicated to explain the retrograde motion of the planets. And it led to a question. What would cause an object to slow down and reverse? Nothing on Earth behaves like this.
The heliocentric model of Copernicus is much simpler. Each planet goes around the sun in a circle (later they realized the orbits are actually not circles but ellipses).
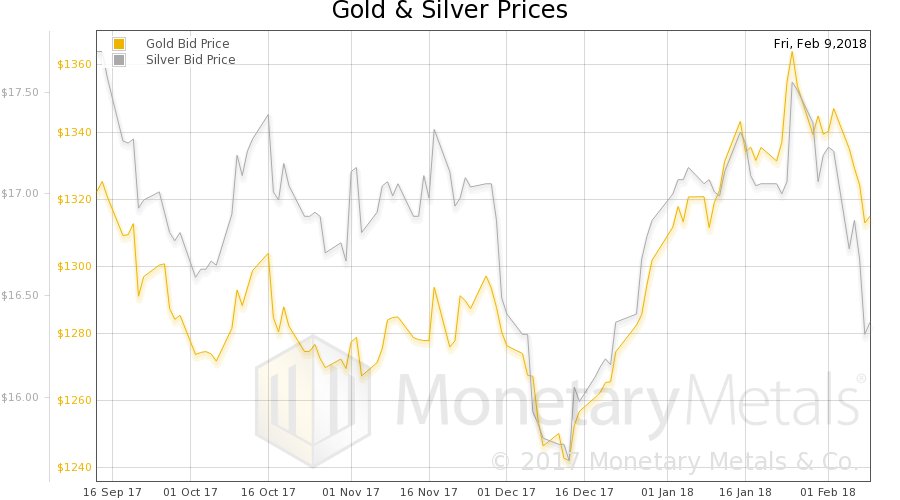
Today, we have a dollarcentric view analogous to the geocentric view of the Medievals. Analogous to retrograde motion of planets, is the question of whether gold or stocks are outperforming. According to the dollarcentric view, the S&P stock index fell from 2,757 to 2,619, or -5% this week. And gold fell from $1,333 to $1,316, or -1.28%. So most people say stocks underperformed. And most gold bugs are excited, because this (supposedly) supports a case that gold is going back into a bull market. For reference, silver fell from $16.56 to $16.32, or -1.45%. So silver underperformed gold. Which would not be supportive of the gold bull market thesis.
When the markets realize that the dollarcentric view is wrong, we will have a revolution in monetary science, just as Copernicus ushered in a revolution in physical science.
We should be saying that the dollar went up, from 23.3mg gold to 23.6mg. And stocks fell from 2.07oz to 1.99oz gold.
This should not be a radical idea. Even dollar advocates admit that the dollar goes down—indeed the stated goal of the Fed is 2% decline per annum. And they also admit that there can be long leads and lags, years or decades. So this unit, which is an ever-stretching rubber band subject to unpredictable volatility is supposed to be the unit of measure.
And gold, which is not subject to central planning, is just one alternative of many investments—all to be measured in centrally planned rubber bands.
You cannot understand the solar system, if you are trying to measure the backward motion of Venus against the forward travel of Mars, using the Earth as the center. And you cannot understand the markets if you try to measure the upward motion of gold against the downward motion of stocks, using the dollar as the center.
Gold standard aside, this revolution is necessary, and we believe that it’s coming. It will have to, as our currency becomes more volatile. Those stuck believing that our gyrating, failing currency is the center, while it goes off the rails, will not be able to grasp what happens.
Supply and Demand Fundamentals
Let’s take a look at the only true picture of the supply and demand fundamentals for the metals. But first, here is the chart of the prices of gold and silver.
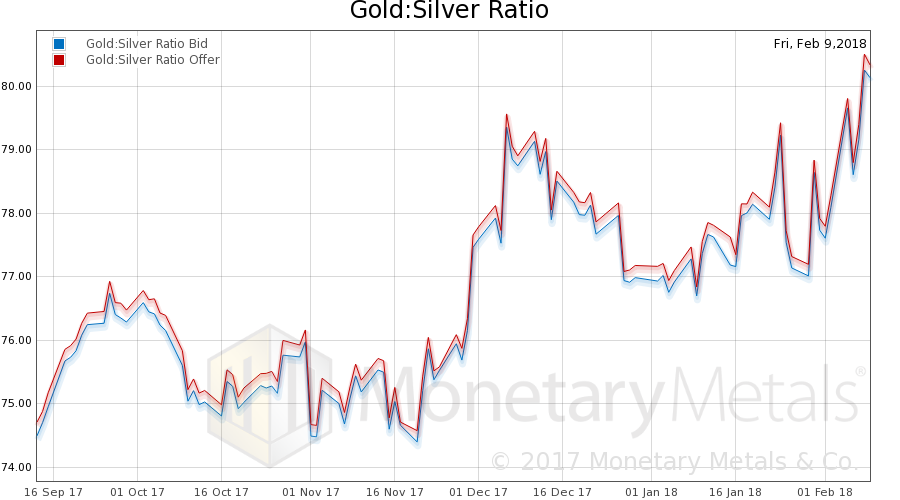
Next, this is a graph of the gold price measured in silver, otherwise known as the gold to silver ratio (see here for an explanation of bid and offer prices for the ratio). The ratio rose.
Here is the gold graph showing gold basis, cobasis and the price of the dollar in terms of gold price.
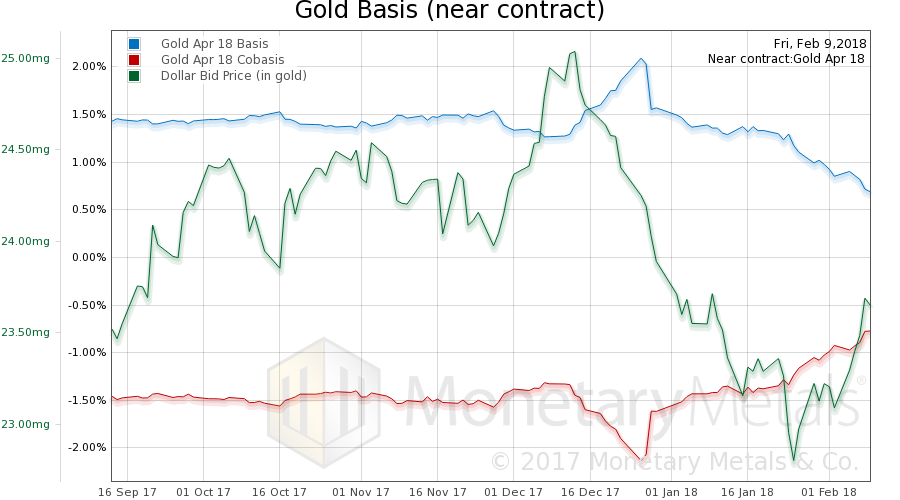
The uptrend of the cobasis (scarcity) continued this week. Not surprising with falling price.
The Monetary Metals Gold Fundamental Price rose $14 this week, to $1,386.
Now let’s look at silver.
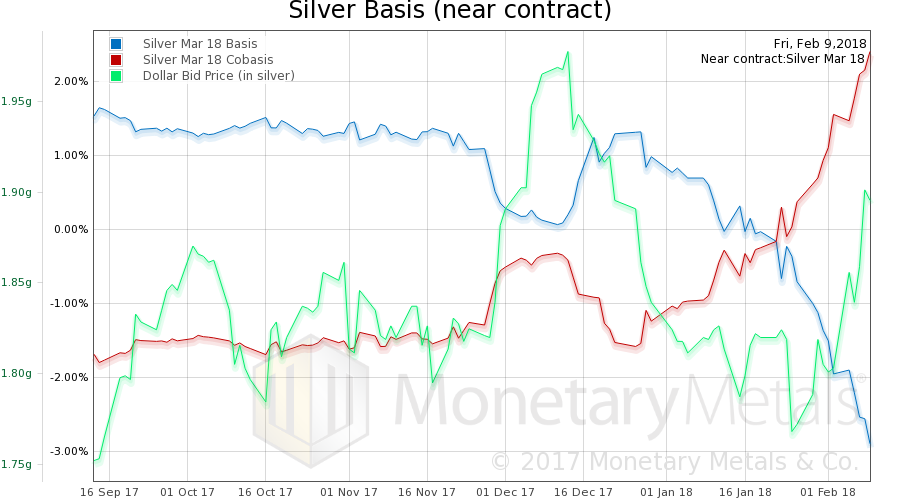
The same thing is happening in silver (though beware the effect of the control roll, this is the March contract which hits First Notice day in a few short weeks).
The Monetary Metals Silver Fundamental Price fell 30 cents to $16.93.
We promised to write an article about the silver price and basis action of Friday last week (Feb 2). We did not do that, so please see the chart below.
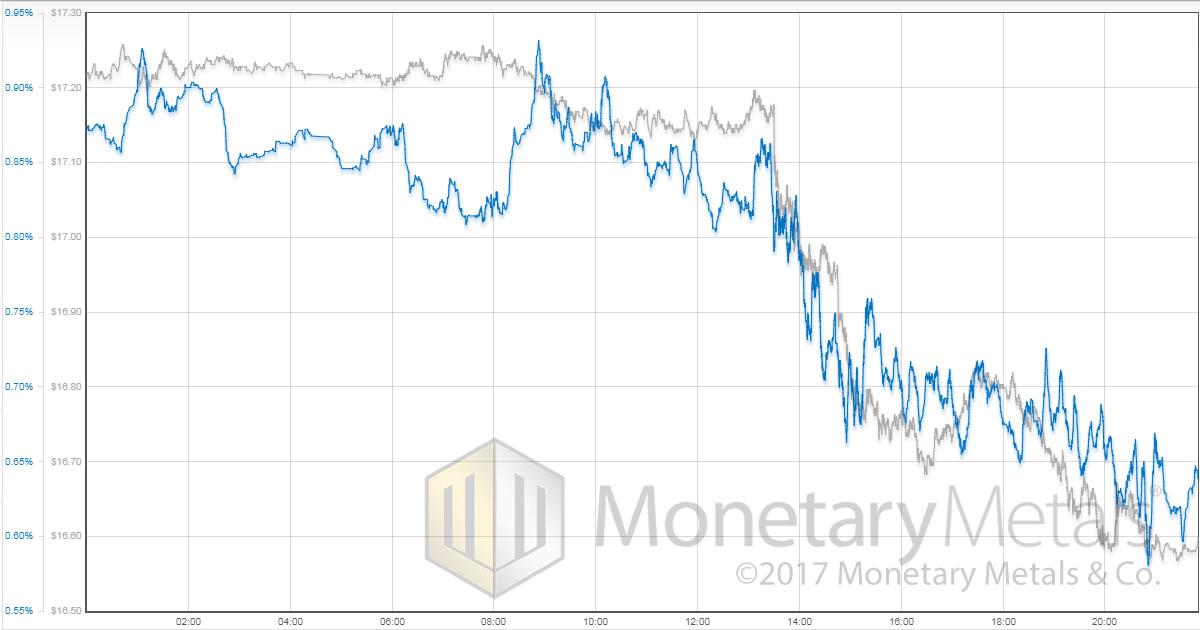
What we look for when analyzing intra-day price moves is the behavior of the price in relation to the basis. Friday’s action is similar to many of our previous intra-day Forensic Analysis, where we see that price and basis move together, in this case both falling.
This is a picture of selling primarily in the futures markets, or to put it another way, that futures selling led the spot market lower. It is a common pattern because speculators in futures market predominantly operate on margin/leverage compared to the spot (physical) market, where a higher proportion hold fully paid up positions.
© 2018 Monetary Metals
 Dr. Keith Weiner is the CEO of Monetary Metals and the president of the Gold Standard Institute USA. Keith is a leading authority in the areas of gold, money, and credit and has made important contributions to the development of trading techniques founded upon the analysis of bid-ask spreads. Keith is a sought after speaker and regularly writes on economics. He is an Objectivist, and has his PhD from the New Austrian School of Economics. His website is www.monetary-metals.com.


