Take The Long-Term View In A Late-Cycle Market


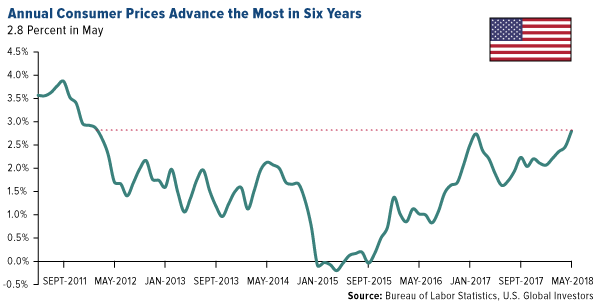
The U.S. inflation story made further inroads this month, with year-over-year price growth for consumers and producers alike hitting multiyear highs. U.S. consumer prices expanded at their strongest pace in more than six years, climbing to an annual change of 2.8 percent in May. Prices for final demand goods, meanwhile, grew 3.1 percent, their strongest annual surge since December 2011.
As you might expect, energy was the greatest contributor to higher prices in May, with fuel oil jumping more than 25 percent from the same month a year ago. The current average price for a gallon of regular gas nationwide was just under $3.00, compared to only $2.33 in June 2017, according to the American Automobile Association (AAA).
Inflation is set to get an even bigger jolt now that President Donald Trump has formally approved 25 percent tariffs on as much as $50 billion of Chinese goods. China has already announced retaliatory action. While I agree some targeted tariffs are welcome to address intellectual property theft, tariffs at the wholesale level are essentially regulations that threaten to undermine all the work Trump has done to supercharge the U.S. economy. They act as headwinds to further growth, which in turn makes gold look attractive as a safe haven investment.
Blaming OPEC
Let’s return to energy for a moment. Hot off the success of his historic summit with North Korea leader Kim Jong-un, Trump took a stab at foreign oil producers last week, tweeting: “Oil prices are too high, OPEC is at it again. Not good!”
The president isn’t wrong, but I believe he may be overselling the Organization of Petroleum Exporting Countries’ influence here. In May, the 14-member cartel added an extra 35,000 barrels per day (bpd) in output compared to the previous month, to reach a total of 31.8 million bpd. This is down from the average 32.6 million and 32.4 million bpd OPEC collectively produced in 2016 and 2017.
Venezuela’s output deteriorated once again, falling more than 42 percent in May to 1.4 million bpd, which is less than half of what it produced 20 years ago.
The beleaguered South American country didn’t have the biggest monthly decline among OPEC members, however—that title belonged to Nigeria, which saw its April-to-May production tumble 53.5 percent to 1.7 million bpd. Analysts predict output could fall further to 1.4 million bpd by July—a level not seen since 1988—as the country’s Nembe Creek Trunk Line (NCTL) has had to be closed recently to address product theft along its route.
OPEC will meet later this month and is widely expected to loosen production curbs as global demand strengthens. In the meantime, the U.S. continues to pump even more oil on a monthly basis, and by 2019 it could be producing more than 11 million bpd for the first time ever. This would make it the world’s top oil producer, above Russia.
Want to learn more? Watch this brief video featuring Samuel Pelaez, who outlines the six factors we use to select best-in-class oil and gas exploration and production companies!
Gold Glitters on Inflation Fears and U.S. Budget Imbalance
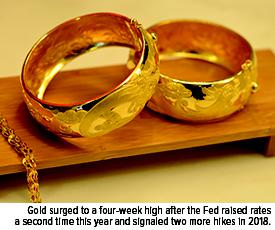
The inflation news helped support the price of gold, which traded as high as $1,309 an ounce last Thursday, its best intraday showing in four weeks.
The price jump came a day after the Federal Reserve lifted interest rates another 0.25 percent, the second time it has done so this year. Although rising rates have historically made the precious metal look less competitive, since it doesn’t offer a yield, gold markets could be forecasting slower economic growth as a result of higher borrowing costs, not to mention costlier servicing of corporate and government debt.
On that note, the Treasury Department announced last week that in the first eight months of the current fiscal year—October through May—the U.S. government deficit widened to a whopping $532 billion, or 23 percent more than the same eight-year period a year ago. That’s already more than the total deficits in fiscal years 2014 and 2015. Because of higher spending and lower revenues, it’s estimated that the deficit by the end of the fiscal year will balloon to $833 billion, which would be the greatest amount since 2012.
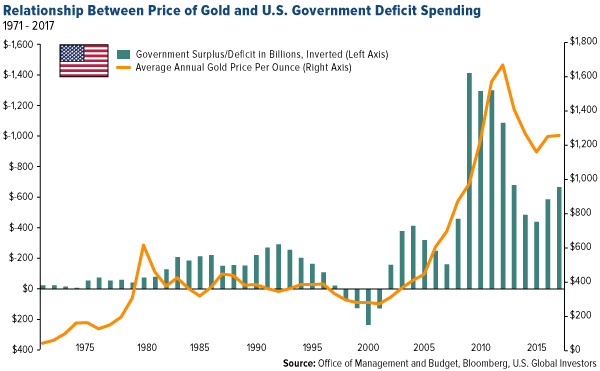
I believe this makes the investment case for gold and gold equities even more appealing as a store of value. In the chart below, notice how the price of gold has responded to government spending. I inverted the bars, representing surplus and deficit, to make the relationship more clear. In the years following the Clinton surplus of the late 90s, the difference between expenditure and revenue surged to new record amounts on the back of military spending in the Middle East and the multibillion-dollar bailouts of financial firms during the subprime mortgage crisis. Consequentially, the price of gold exploded.
Learn more about what’s driving the price of gold right now by clicking here!
How Close Are We to the End of the Business Cycle?
But back to the Fed. Besides lifting rates, the central bank has also signaled that we can expect two more hikes in 2018, suggesting it sees less and less need to accommodate a booming U.S. economy. Since the start of this particular rate hike cycle two and a half years ago, we haven’t yet seen four increases in a single calendar year.
This raises the question of how close we are to the end of the business cycle.
Rising rates, among other indicators, have often preceded the end of economic expansions and equity bull markets. Among other telltale signs: a flattening yield curve, record corporate and household debt, an overheated jobs market and increased mergers and acquisition (M&A) activity. So far this year, the value of global M&As has already reached $2 trillion, a new all-time high. The last two periods when M&As reached similar levels were in 2007 ($1.8 trillion) and in 2000 ($1.5 trillion), according to Reuters. Careful readers will note that those two years came immediately before the financial crisis and tech bubble.
Now, the world’s largest hedge fund, Bridgewater Associates, has reportedly turned bearish on “almost all financial assets,” according to one of its most recent notes to investors.
In the firm’s Daily Observations, co-CIO Greg Jensen writes that “2019 is setting up to be a dangerous year, as the fiscal stimulus rolls off while the impact of the Fed’s tightening will be peaking.”
Don’t Miss The Opportunities
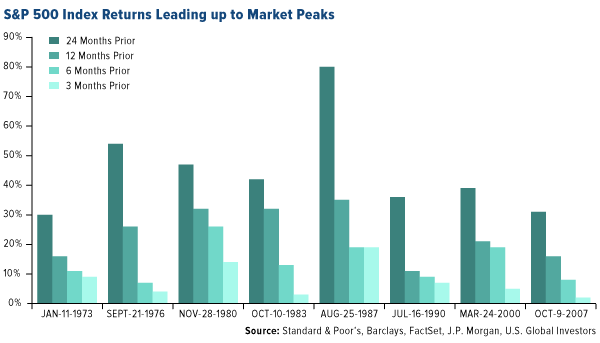
Be that as it may, calling the end of the cycle would be a fool’s errand and could result in missed opportunities, as J.P. Morgan’s Samantha Azzarello points out in a recent note to investors. Late-cycle returns can still be quite substantial, she says. Take a look at the chart below, which highlights returns 24 months, 12 months, six months and three months leading up to the past eight market peaks. Obviously returns were higher in the longer-term periods, but even the three-month periods delivered some attractive returns—returns that would be left on the table if skittish investors exited now. According to Azzarello, it’s important to “rebalance, stick to a plan and remember: get invested and stay invested.”
As further proof that many investors still see plenty of fuel in the tank, the June survey of fund managers conducted by Bank of America Merrill Lynch (BAML) found that equity investors are overweight U.S. stocks for the first time in 15 months. Commodity allocations are at their highest in eight years. And two-thirds of managers say the U.S. is the best region in the world right now for corporate profits, which is at a 17-year high.
That’s not to say there aren’t risks. Forty-two percent of survey participants said they believed corporations were overleveraged. That’s well above the peak of 32 percent from soon before the start of the financial crisis. Fund managers cited “trade war” as the biggest “tail risk” for markets at present.
This is largely why we find domestic-focused small to mid-cap stocks so attractive right now. These firms are well positioned to take advantage of Trump’s high-growth “America first” policies, yet because they don’t have as much exposure to foreign markets, they bypass many of the trade war pitfalls large multinationals must face. Since Election Day 2016, the small-cap Russell 2000 Index has outperformed the large-cap S&P 500 Index by more than 8.5 percent.
Get the scoop on small to mid-cap stocks by clicking here!
Rethinking Market Cap-Weighting
On a final note, I want to draw attention to a change we’ve observed in S&P 500 returns—specifically, the difference in performance between an equal-weighted basket of stocks and one that’s market cap-weighted. For the longer-term period, equal-weighting outperformed. But more recently, market cap-weighting has pulled ahead. This is the case for the one-year, three-year and five-year periods.
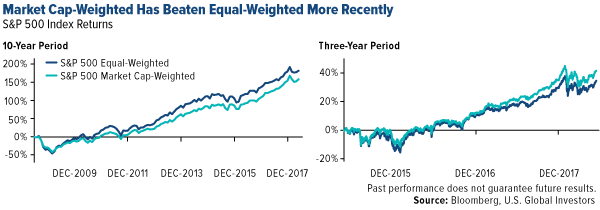
So why is this? Simply put, the phenomenally large FAANG stocks (Facebook, Apple, Amazon, Netflix and Google) have made the S&P 500 top heavy. Today, these five stocks represent a highly concentrated 12 percent of the S&P 500, nearly double from their share just five years ago. Apple alone represents 4 percent of the large-cap index.
Ten years ago, the FAANG stocks—excluding Facebook, which wasn’t public yet—had a combined market cap of $390 billion, according to FactSet data. In 2018, they’re valued at more than eight and half times that, or right around $3.32 trillion—a mind-boggling sum.
Market cap-weighted also means more money is disproportionately being reallocated to top winners such as Apple and Amazon, and so it becomes a self-fulling prophecy. This leaves you with too much exposure to companies that would be hardest hit in the event of a market downturn, and too little exposure to names and sectors that might rotate to the top in the next cycle.
Learn more about the domestic market by clicking here!
*********
All opinions expressed and data provided are subject to change without notice. Some of these opinions may not be appropriate to every investor. By clicking the link(s) above, you will be directed to a third-party website(s). U.S. Global Investors does not endorse all information supplied by this/these website(s) and is not responsible for its/their content.
The S&P 500 Index is a market capitalization weighted index of the 500 largest U.S. publicly traded companies by market value. The Russell 2000 Index is a small-cap stock market index of the bottom 2,000 stocks in the Russell 3000 Index.
Holdings may change daily. Holdings are reported as of the most recent quarter-end. None of the securities mentioned in the article were held by any accounts managed by U.S. Global Investors as of 3/31/2018.
U.S. Global Investors, Inc. is an investment adviser registered with the Securities and Exchange Commission ("SEC"). This does not mean that we are sponsored, recommended, or approved by the SEC, or that our abilities or qualifications in any respect have been passed upon by the SEC or any officer of the SEC.
This commentary should not be considered a solicitation or offering of any investment product.
Certain materials in this commentary may contain dated information. The information provided was current at the time of publication.
 Frank Holmes is the CEO and Chief Investment Officer of U.S. Global Investors. Mr. Holmes purchased a controlling interest in U.S. Global Investors in 1989 and became the firm’s chief investment officer in 1999. Under his guidance, the company’s funds have received numerous awards and honors including more than two dozen Lipper Fund Awards and certificates. In 2006, Mr. Holmes was selected mining fund manager of the year by the Mining Journal. He is also the co-author of “The Goldwatcher: Demystifying Gold Investing.” Mr. Holmes is engaged in a number of international philanthropies. He is a member of the President’s Circle and on the investment committee of the International Crisis Group, which works to resolve conflict around the world. He is also an advisor to the William J. Clinton Foundation on sustainable development in countries with resource-based economies. Mr. Holmes is a native of Toronto and is a graduate of the University of Western Ontario with a bachelor’s degree in economics. He is a former president and chairman of the Toronto Society of the Investment Dealers Association. Mr. Holmes is a much-sought-after keynote speaker at national and international investment conferences. He is also a regular commentator on the financial television networks CNBC, Bloomberg and Fox Business, and has been profiled by Fortune, Barron’s, The Financial Times and other publications. Visit the U.S. Global Investors website at http://www.usfunds.com. You can contact Frank at: [email protected].