Taking The Scenic Route To 4300SPX


I am going to start this week's missive with the quote from Robert Prechter's seminal book The Socionomic Theory of Finance, which is a book I strongly recommend to each and every investor:
Observers' job, as they see it, is simply to identify which external events caused whatever price changes occur. When news seems to coincide sensibly with market movement, they presume a causal relationship. When news doesn't fit, they attempt to devise a cause-and-effect structure to make it fit. When they cannot even devise a plausible way to twist the news into justifying market action, they chalk up the market moves to "psychology," which means that, despite a plethora of news and numerous inventive ways to interpret it, their imaginations aren't prodigious enough to concoct a credible causal story.
Most of the time it is easy for observers to believe in news causality. Financial markets fluctuate constantly, and news comes out constantly, and sometimes the two elements coincide well enough to reinforce commentators' mental bias towards mechanical cause and effect. When news and the market fail to coincide, they shrug and disregard the inconsistency. Those operating under the mechanics paradigm in finance never seem to see or care that these glaring anomalies exist.
So, with the hotter-than-expected inflation indications coming out this past week, everyone and their mother is certain that this is what caused the market decline we experienced this past week. The commonly used mechanical cause and effect perspective applied by almost all pundits certainly reinforced this over the past week. And, as each day goes by, more and more authors dazzle us with their brilliance in further regurgitating the same perspective.
The problem is that most of these people simply say the same thing over and over each week until the market seemingly complies. As I noted in a comments section this past week:
Perma-anything - whether they be bear or bull - should be summarily ignored. They are worthless when making determinations about the market... I know of very few analysts that can accurately predict market movements on both sides of the tape consistently. So, most just have a bias and push that bias. They then herald themselves when the market moves in their direction, and devolve into obscurity when it does not.
This brings me to my main point. If you ask these people, they will tell you that the news "certainly" caused the market drop. Yet, if you ask them why the same type of "hot" inflation report kicked off a 20% rally off the October 2022 low, all you will hear is silence or maybe crickets. Did that hotter-than-expected inflation report also "cause" that 20% rally?
I mean, based upon their logic, if the market moved after a report comes out, then it clearly caused that move, right? Then, if you ask them why the market pulled back in December after the announcement of a better-than-expected inflation report, you will again hear the same silence. Yet, the market dropped after a better-than-expected inflation report, and the market declined thereafter, so it must have caused that decline, right?
So, again, allow me to quote the relevant section of Prechter's post above:
When news and the market fail to coincide, they shrug and disregard the inconsistency. Those operating under the mechanics paradigm in finance never seem to see or care that these glaring anomalies exist.
As I have explained many times before, while a news event or report may "cause" a market movement, the substance of that news or report may be the exact opposite of what we would expect based upon the direction of the market movement. The bottom struck in October of 2022 and the top struck in December of 2022 were two perfect examples of my view.
I have discussed this at length before in many prior missives, but if you would like a bit more detail on this perspective, feel free to read the 2nd part of the 6-part series I wrote regarding my analysis methodology.
So, in summary, either you can believe the historical evidence or you can continue to believe the superficial perspective of pundits who claim that a specific report or news event was the certain "cause" of a market move (yet are silent when you ask them why a similar event or report seemingly caused an opposite market move).
Now, admittedly, this has been a very difficult market to traverse for quite some time, especially for someone who is focused on identifying market turning points in both directions. While we caught the high earlier this month at exactly 4195SPX, the support I was looking to hold has clearly broken. So, what do we do now?
Well, for those that followed me in 2022, we raised quite a bit of cash at the peaks of the rallies we saw, starting at the high at the end of 2021. We have been looking for points at which to place some of that money back into the market during rally set-ups.
Yet, the structure we have seen off the December low -- which struck within our target outlined to the members of ElliottWaveTrader.net -- has been very overlapping and not the type of rally one would expect in what we look for in a c-wave. (I know I may be getting a bit technical in this update, but I am sorry, as it is really the only way to attempt to explain what I am seeing).
You see, when we deal with corrective structures, they often take unexpected twists and turns, as compared to impulsive structures which are very predictable. And, the top struck at 4195SPX made it quite clear that it was a corrective structure, which is why I warned our members to expect whipsaw action after we topped at 4195SPX. While the market will not always outline its full intentions clearly to us all the time, it does give us strong indications of the type of environment we are in, as it allows us to adjust accordingly.
Let me take a step back to the October 2022 low. On October 12, I wrote this to the members of ElliottWaveTrader.net:
I sent out an update to our members noting the following:
Thus far, the market has made several attempts at hitting the blue box support region on the 60-minute SPX chart. And, each time, divergences continue to grow. And, if you look at the 5-minute SPX chart, there is still opportunity to actually strike that support below as long as we remain below the smaller degree resistance noted... But, I think we will likely be much higher than where we stand today as we look out towards the end of October, or even into early November, depending on how long it takes the market to bottom out, and how fast the rally I expect takes hold.
Then, in the pre-market hours after the hotter-than-expected CPI report came out on October 13, I posted an update to our members at 8:56 AM, noting my expectations for a bottom being struck and noting that "[t]his should now be the selling climax that completes the downside structure." The market bottomed within half an hour of my alert, and we began the rally that I told them to expect the prior day.
My initial upside target was the 4100-4150SPX from the 3500SPX region, to be followed by a pullback, with my expectation that we will then continue the rally to the 4300 region. Thus far, the market has taken the path I laid out at the bottom almost perfectly. And, take note, none of my analysis laid out at the October bottom and since that time has been based upon any expectation or assumption regarding news events or economic reports. Yet, our expectations have been quite accurate to date.
But, when we failed to break out over 4200SPX, it was suggesting that the market is still taking shape within the pullback I outlined above, which is likely the precursor to the rally to 4300SPX. In other words, the December pullback was only one leg of a 3-leg structure, which, when completed, will likely set us up to attack the 4300SPX region.
For now, this is how I see the market. But, remember, corrective structures are quite variable and difficult to navigate. So, I am simply going to let you know that our next level of support is now in the 3770-3858SPX region. If the market is unable to hold Friday's low and begin a rally to 4300SPX, then I am expecting us to test the next level of support.
Should we drop break Friday's low, then I will be looking for a 5-wave structure to develop off that lower support. Should we see that in the coming weeks, then I will be preparing for a rally to 4300SPX (with some potential we can even extend as high as the 4500/4600SPX region, depending on the size of the initial rally off the low we strike). I will also be outlining to our members how I will be deploying some of my raised cash in a low-risk fashion. And, until I see that structure develop in the coming weeks, I intend to maintain the levels of cash we raised over the last year.
Of course, should the market make it clear by the manner in which we decline off the 4195SPX high that this is all we are going as a high for this year, then I will be quite quick to change my view, and prepare for a drop to the 2700/2900SPX region. For now, I am seeing this as the lesser likely outcome at this time, at least until we are able to reach the 4300SPX region.
If you are still reading to this point, and are still not convinced by what I am trying to outline above regarding how markets work, then I am going to conclude this week's article with what I said in my keynote address at the New York Money Show this past week -- which should make this perspective abundantly clear:
Lastly, while most people view the Fed as being the reason markets bottom, Greenspan has clearly noted otherwise when he said: "It's only when the markets are perceived to have exhausted themselves on the downside that they turn. Trying to prevent them from going down just merely prolongs the agony."
Ultimately, as Greenspan correctly recognized, it is social mood and sentiment that moves markets and not the Fed or anything else. I believe this makes much more sense when deriving the causality chain for market movement.
Let's review the nature of a market decline and bottoming to try to understand this a bit better.
During a negative sentiment trend, the market declines, and the news seems to get worse and worse. Once the negative sentiment has run its course after reaching an extreme level, and it's time for sentiment to change direction, the general public then becomes subconsciously more positive. You see, once you hit a wall, it becomes clear it is time to look in another direction. Some may question how sentiment simply turns on its own at an extreme, and I will explain to you that many studies - some of which I have cited above - have explained how it occurs naturally within the limbic system within our brains.
When people begin to subconsciously turn positive about their future - which is a subconscious - and not conscious - reaction within their limbic system, as has been proven by many recent market studies- they are willing to take risks. What is the most immediate way that the public can act on this return to positive sentiment? The easiest and most immediate way is to buy stocks.
For this reason, we see the stock market lead in the opposite direction before the economy and fundamentals have turned.
In fact, historically, we know that the stock market is a leading indicator for the economy, as the market has always turned well before the economy does. This is why R.N. Elliott, whose work led to Elliott Wave theory, believed that the stock market is the best barometer of public sentiment.
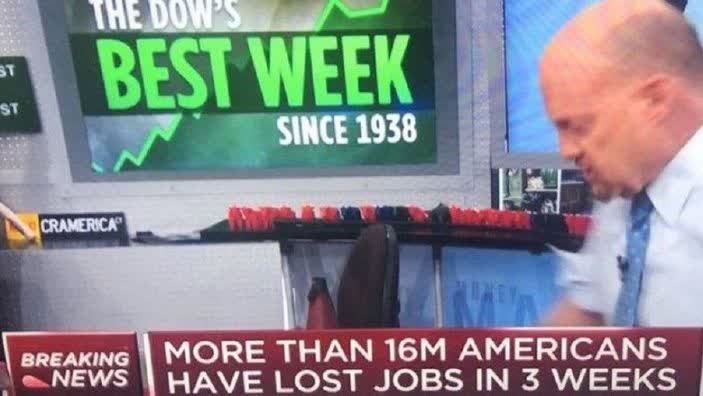
The most recent example of this is when the SPX bottomed at 2200SPX, and began a FAST thousand point rise despite the worst news of Covid deaths, record high unemployment, and economic shutdowns being reported during the heart of the rally off the low. And, this picture captured from one of Jim Cramer's episode around that time captures my point really well.
CNBC
But, let's look at the same change in sentiment and what it takes to have an effect on the fundamentals. When the general public's sentiment turns positive, this is the point at which they are willing to take more risks based on their positive feelings about the future.
Whereas investors immediately place money to work in the stock market, thereby having an immediate effect upon stock prices, business owners and entrepreneurs seek loans to build or expand a business, and those take time to secure.
They then put the newly acquired funds to work in their business by hiring more people or buying additional equipment, and this takes more time. With this new capacity, they are then able to provide more goods and services to the public and, ultimately, profits and earnings begin to grow - after more time has passed.
When the news of such improved earnings finally hits the market, most market participants have already seen the stock of the company move up strongly because investors effectuated their positive sentiment by buying stock well before evidence of positive fundamentals is evident within the market. This is why so many believe that stock prices present a discounted valuation of future earnings.
Clearly, there is a significant lag between a positive turn in public sentiment and the resulting positive change in the underlying fundamentals of a stock or the economy, especially relative to the more immediate stock-buying activity that comes from the same causative underlying sentiment change.
This is why I claim that fundamentals are a lagging indicator relative to market sentiment. This lag is a much more plausible reason as to why the stock market is a leading indicator, as opposed to some form of investor omniscience. This also provides a plausible reason as to why earnings lag stock prices, as earnings are the last segment in the chain of positive-mood effects on a business-growth cycle.
It is also why those analysts who attempt to predict stock prices based on earnings fail so miserably at market turns. By the time earnings are affected by a change in social mood, the social mood trend has already been negative for some time. And this is why economists fail as well - the social mood has shifted well before they see evidence of it in their "indicators."
Have a great week.
********
 Avi Gilburt is a widely followed Elliott Wave technical analyst and author of ElliottWaveTrader.net, a live Trading Room featuring his intraday market analysis (including emini S&P500, metals, oil, USD & VXX), interactive member-analyst forum, and detailed library of Elliott Wave education. You can contact Avi at: [email protected].


